

📝 SUMMARY OF TECHNICAL ANALYSIS BTC/USDT (H1 TIMEFRAME) 📝
🔎 1. TECHNICAL ASSESSMENT OF THE EUROPEAN SESSION
--------------------------------------------------
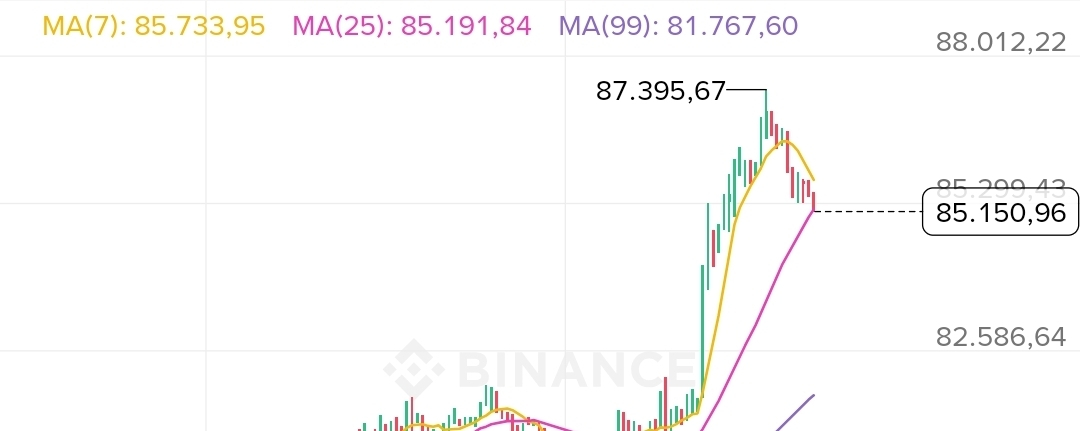
📈 Main trend: The uptrend (Bullish) is strongly dominating. The price structure is clearly forming higher highs compared to the previous peak, especially the breakout from the short-term bottom zone of 75,064.82 USDT straight up to the highest 24h high at 87,395.67 USDT.
📉 Current price action: The price is currently trading at 85,150.96 USDT, reflecting a slight bearish correction (down -0.94% for the day) after hitting the peak. This is a healthy accumulation phase to retest the dynamic support zones below.
📊 Moving Average (MA) system:
- Price is right above the MA(25) line at 85,191.84 USDT (purple line) and remains at a significant distance above the MA(99) at 81,767.60 USDT.
- The MA(7) line at 85,733.95 USDT is starting to turn sideways and slightly slope downward, showing that short-term take-profit pressure is appearing in the Asia session.
📉 Momentum indicator (MACD):
- The DIF (720.76) and DEA (1,001.29) lines are still completely above the 0 axis, maintaining the long-term uptrend structure.
- However, the Histogram bars have turned red and are gradually narrowing, while the two signal lines are trending downward (a mild Death Cross). This suggests the uptrend momentum is temporarily running out in the short term.
📊 Trading Volume: Trading volume has somewhat declined on the most recent candles when price is adjusting, indicating this is a technical pullback due to a lack of pushing force rather than a dump sell pressure (No-supply test).
📅 2. EUROPEAN SESSION STRATEGY DIRECTION
--------------------------------------------------
The European session is often when large capital flows from Europe get activated, which can easily create false breakouts (Fakeout) or strongly continue the trend.
📌 Key price levels to note:
⛔ Resistance zone: 86,000 - 87,400 USDT (nearest recently established old peak).
✅ Support zone: 83,700 - 84,000 USDT (confluence of the previously broken old peak zone and the dynamic support line).
⚠️ Deep support zone: 81,400 USDT (lowest price of the past 24h and the MA(99) zone).
💡 Action plan for the European session:
🚀 Scenario 1 (Priority - Trend continuation): Price continues to accumulate in a sideways range around 84,500 - 85,200 USDT, absorbing all supply pressure from the Asia session. When the European session opens, if a strong green H1 candle closes above 85,800 USDT with a surge in trading volume (Volume), the buyers will continue pushing price upward to retest the 87,395 USDT peak and move toward further targets.
📉 Scenario 2 (Deeper correction): Selling pressure increases early in the European session, causing price to break through the 84,800 USDT level. Price will then seek to sweep liquidity at the strong support zone of 83,700 - 84,000 USDT. Here, if there is a pinbar or a bullish reversal candle reaction, this will be the optimal zone to place a Buy (Long) order according to the larger trend.
🌟 Trading advice:
Avoid opening a Sell position (Short) in a chase at this stage because the overall market structure is still strongly bullish. Prioritize the strategy of "buying dips" at the support zones mentioned above to achieve the best R:R (Risk/Reward) ratio. Manage capital strictly and place an absolute stop-loss (SL) below the 83,500 USDT zone if entering a short-term buy position.
--------------------------------------------------
#Bitcoin #BTCUSDT #TechnicalAnalysis #CryptoVietNam #CryptoInvestment #CoinTrading #MarketTrend #Binance #CryptoTrading
The analysis information is for reference only, based on technical data at the time the screenshot was taken, and is not financial investment advice.
