#BTC market analysis 9.22
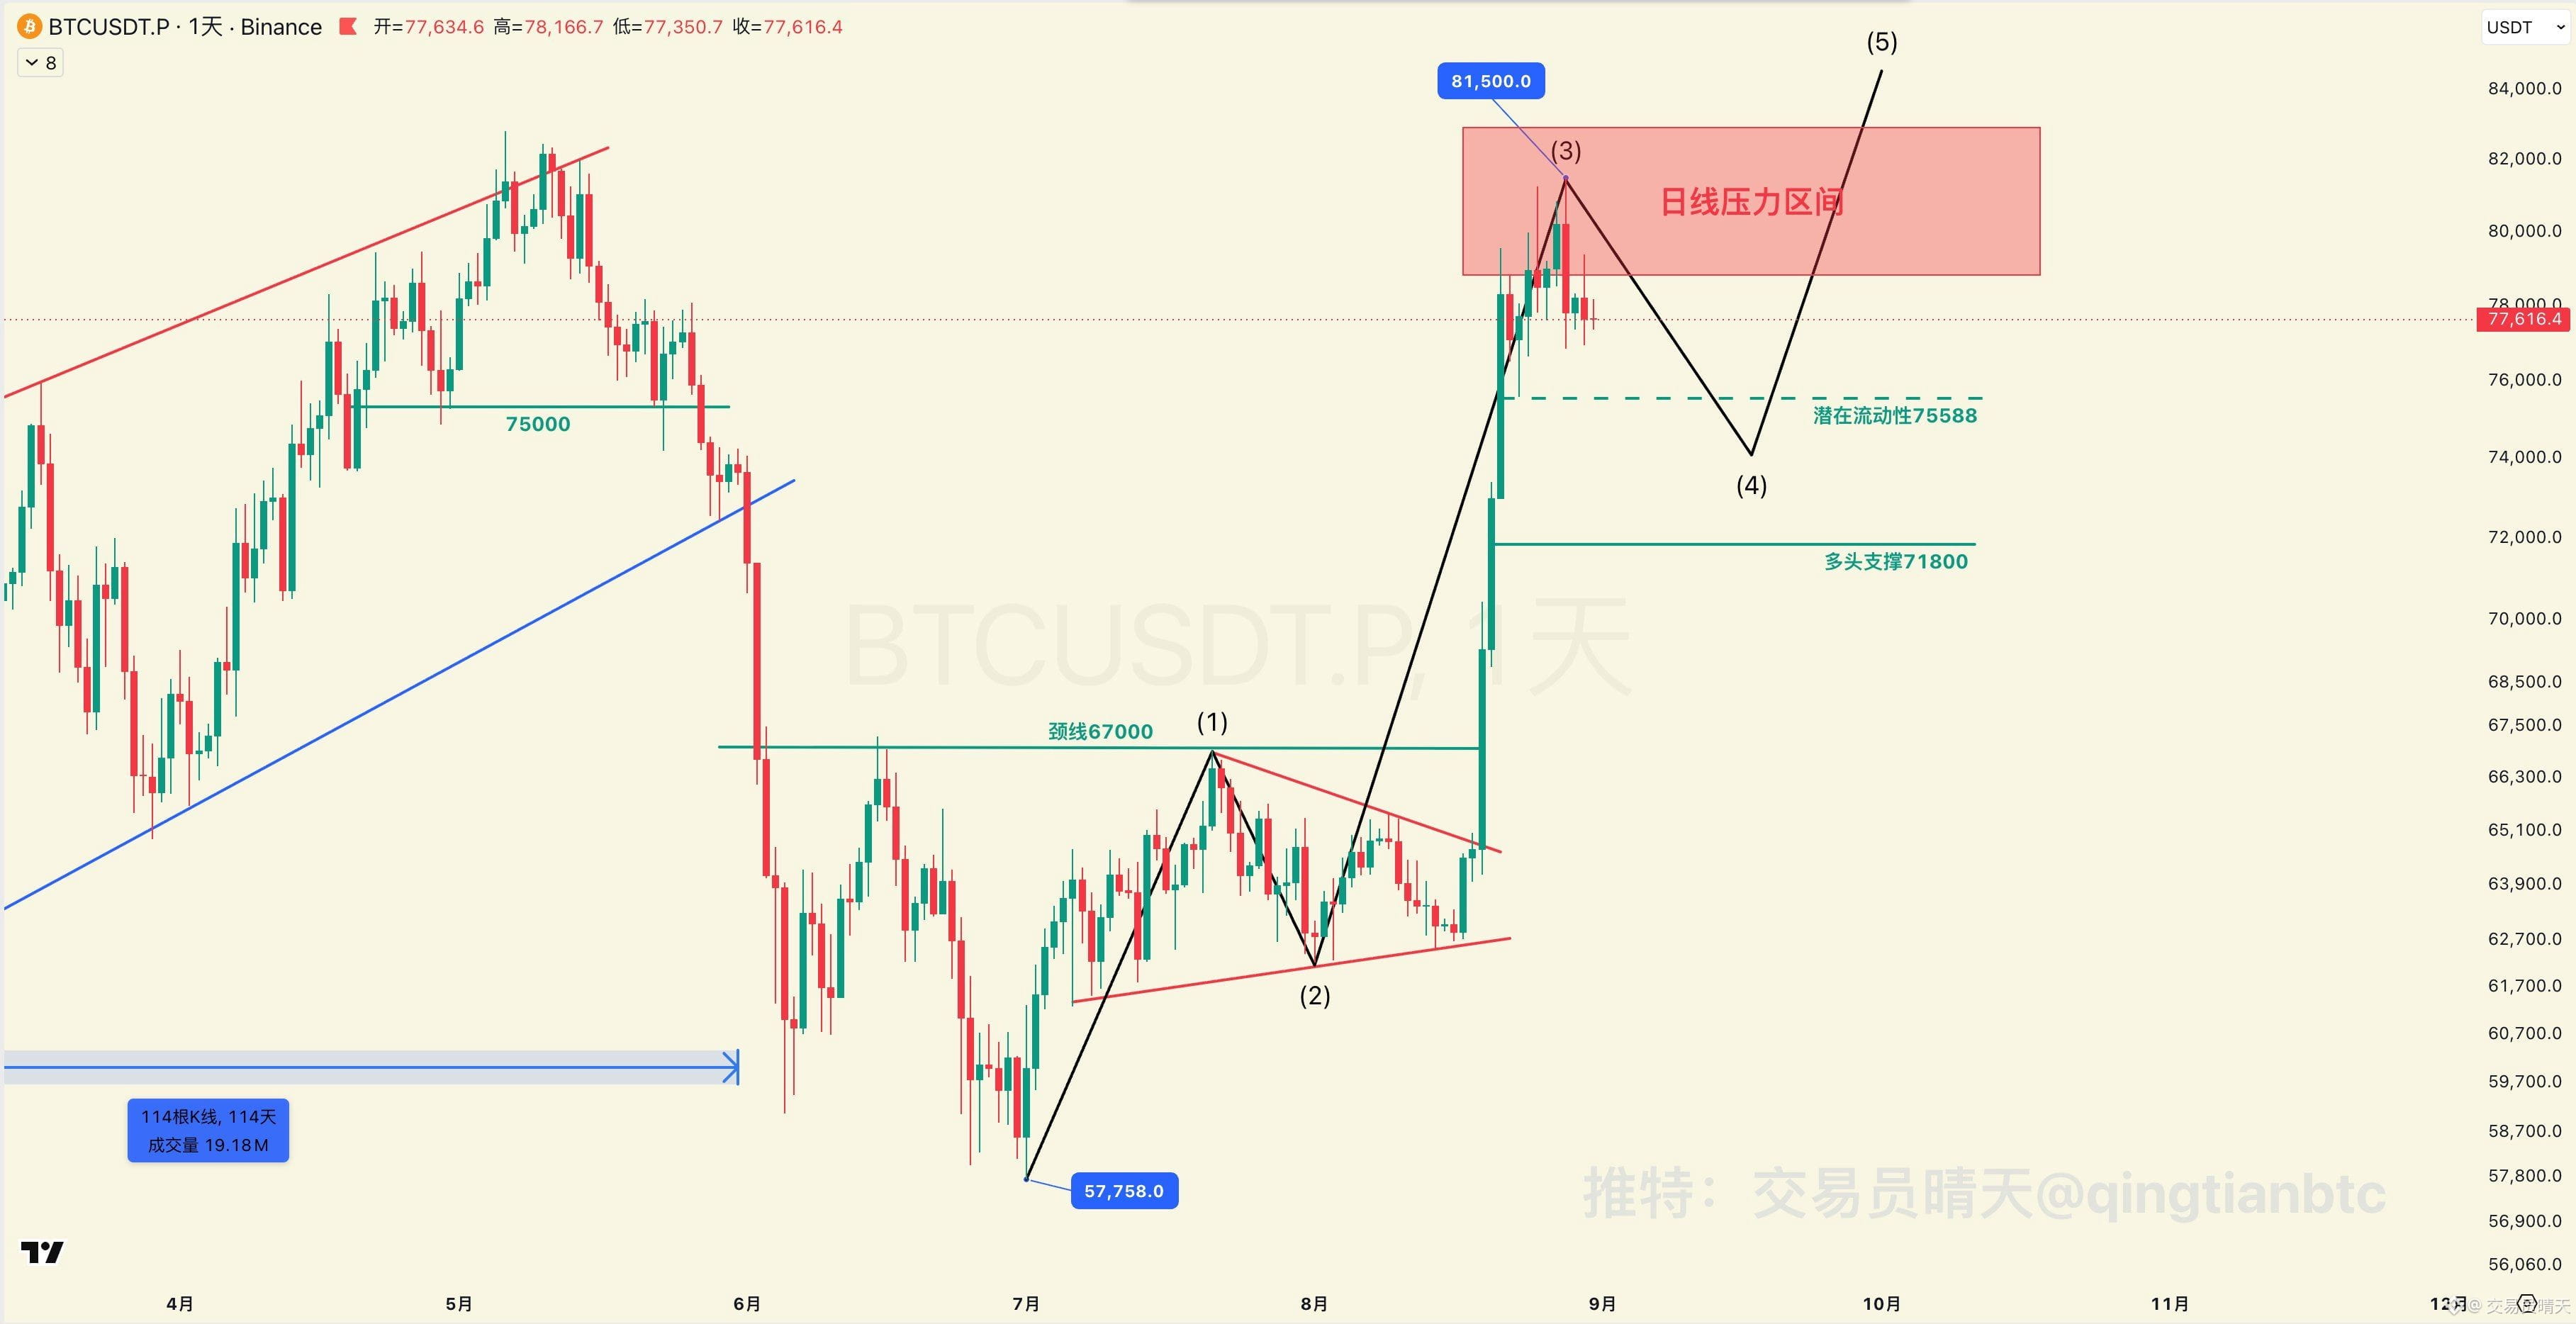
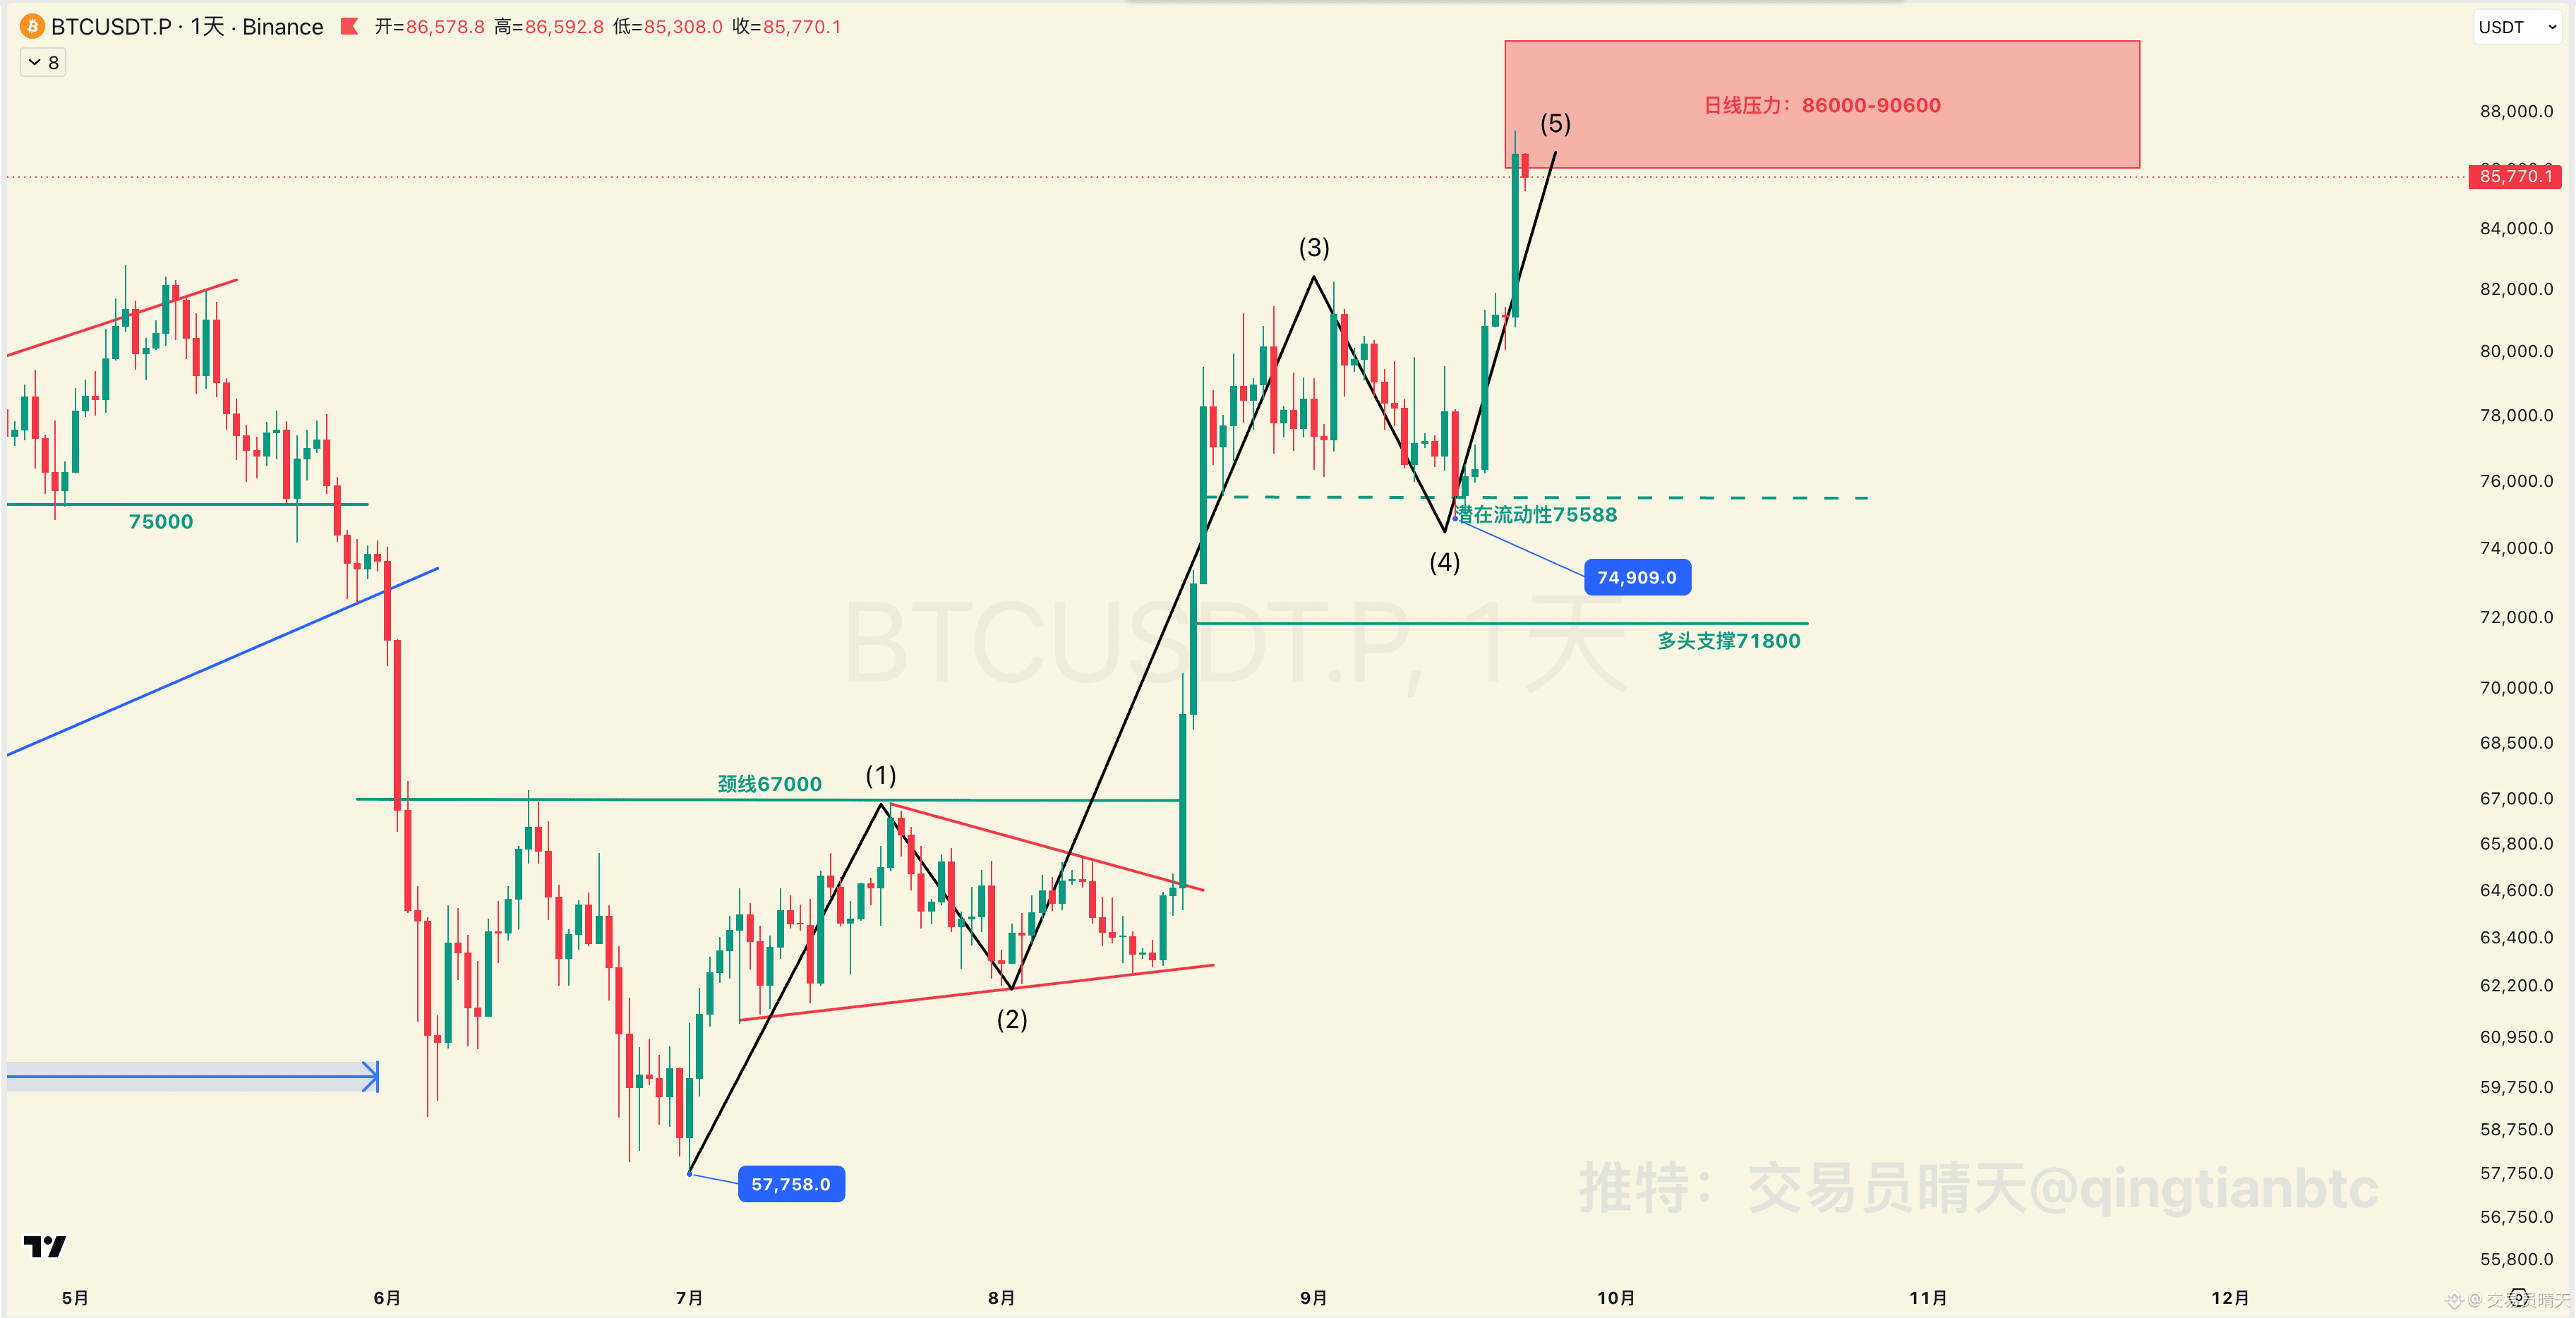
Below is a five-wave uptrend chart drawn on August 31. At the time, it was believed that after a pullback to 75,588–71,800 there would be another upward move; this has already played out. The move up from 74,090 is the final leg. After this leg ends, there will be a major pullback.
1) Daily resistance range: 86,000–90,600. The pressure here is a bit heavy, so it is absolutely not suitable to chase longs. If you short, the stop-loss should be placed above 90,600.
2) If the price is above 80,000, it is considered that the fifth leg is not finished yet. If the price breaks below it, a major pullback will begin.
Below is a five-wave uptrend chart drawn on August 31. At the time, it was believed that after a pullback to 75,588–71,800 there would be another upward move; this has already played out. The move up from 74,090 is the final leg. After this leg ends, there will be a major pullback.
1) Daily resistance range: 86,000–90,600. The pressure here is a bit heavy, so it is absolutely not suitable to chase longs. If you short, the stop-loss should be placed above 90,600.
2) If the price is above 80,000, it is considered that the fifth leg is not finished yet. If the price breaks below it, a major pullback will begin.