🚀 SOL HAS ESCAPED THE 100–110 RANGE — NOW 125 IS THE TEST
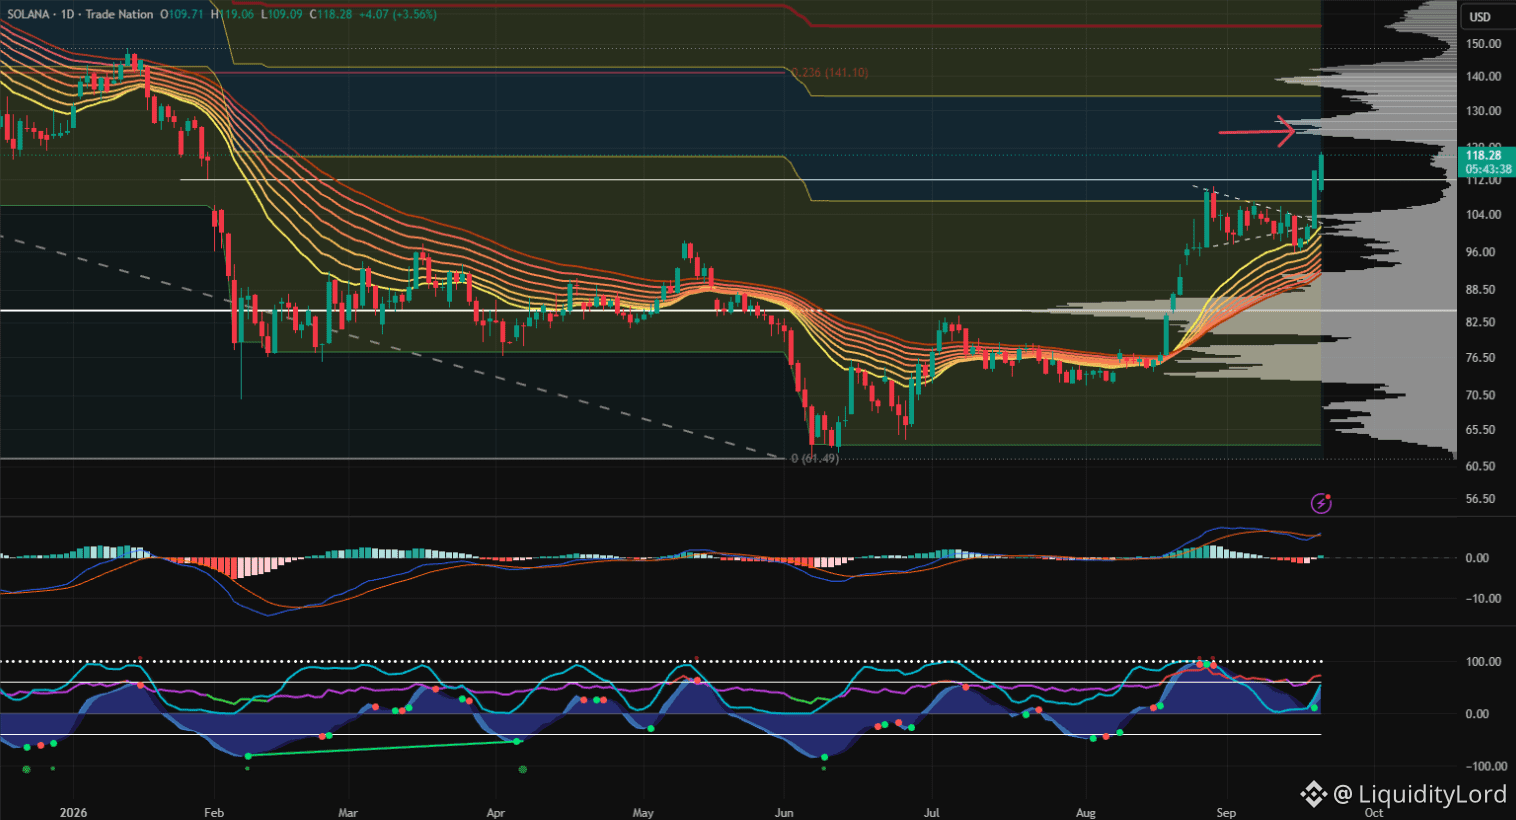
SOL/USD on the 1D chart is around 118.3 after reclaiming 100–105 and accelerating through the upper range. Price is now pressing into a high-volume region near 120–125, while the next marked Fibonacci level sits at 141.10.
🧭 THE DAILY SHIFT
SOL stopped making fresh lows around 60–65 and began building a broad recovery. After months of compression near 75–90, price expanded through 100 and held above the rising moving-average ribbon.
Now the structure is different: momentum is positive, but price is approaching a zone where previous activity can create resistance.
📍 THE MAP I AM USING
112–116 → first retest area
104–108 → deeper support
96 → structural invalidation
123–128 → immediate supply
141.10 → Fibonacci objective
150–155 → upper volume area
I would rather see 112–116 hold than chase the current expansion. If buyers defend it and reclaim 123–125, the path toward 141.10 becomes cleaner. A break above 128 would strengthen continuation and bring the upper volume area into focus.
If SOL loses 104 decisively, the breakout becomes less convincing. Below 96, the recent expansion is structurally damaged.
⚠ WATCH THE VOLUME PROFILE
The right-side profile shows meaningful activity. That can create friction on the way up, so acceptance matters. A breakout candle alone is less useful than holding the new range afterward.
⚙ THE DEFI ANGLE
That execution theme also appears in broader DeFi infrastructure. Omniston routes swaps through liquidity paths, aiming to reduce unnecessary price impact and improve execution. It is separate from SOL price action, not a Solana signal or evidence that SOL is traded there.
For now, 112–116 is the key zone I am watching most closely. Hold it, clear 125, and 141.10 becomes the next major reference. Lose support, and the chart needs to reset before another continuation attempt.
NFA - DYOR
$SOL
SOL/USD on the 1D chart is around 118.3 after reclaiming 100–105 and accelerating through the upper range. Price is now pressing into a high-volume region near 120–125, while the next marked Fibonacci level sits at 141.10.
🧭 THE DAILY SHIFT
SOL stopped making fresh lows around 60–65 and began building a broad recovery. After months of compression near 75–90, price expanded through 100 and held above the rising moving-average ribbon.
Now the structure is different: momentum is positive, but price is approaching a zone where previous activity can create resistance.
📍 THE MAP I AM USING
112–116 → first retest area
104–108 → deeper support
96 → structural invalidation
123–128 → immediate supply
141.10 → Fibonacci objective
150–155 → upper volume area
I would rather see 112–116 hold than chase the current expansion. If buyers defend it and reclaim 123–125, the path toward 141.10 becomes cleaner. A break above 128 would strengthen continuation and bring the upper volume area into focus.
If SOL loses 104 decisively, the breakout becomes less convincing. Below 96, the recent expansion is structurally damaged.
⚠ WATCH THE VOLUME PROFILE
The right-side profile shows meaningful activity. That can create friction on the way up, so acceptance matters. A breakout candle alone is less useful than holding the new range afterward.
⚙ THE DEFI ANGLE
That execution theme also appears in broader DeFi infrastructure. Omniston routes swaps through liquidity paths, aiming to reduce unnecessary price impact and improve execution. It is separate from SOL price action, not a Solana signal or evidence that SOL is traded there.
For now, 112–116 is the key zone I am watching most closely. Hold it, clear 125, and 141.10 becomes the next major reference. Lose support, and the chart needs to reset before another continuation attempt.
NFA - DYOR
$SOL