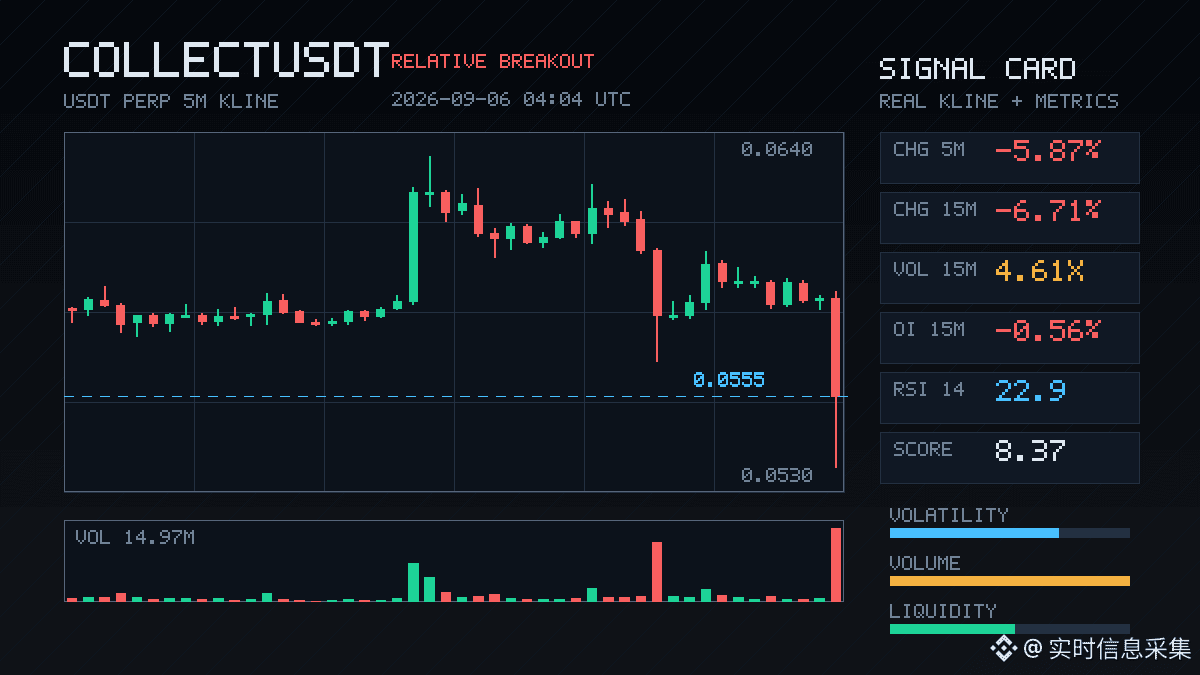
$COLLECT this 15-minute move dumped 6.7% outright, with volume surging to 4.6 times the usual level. It even closed below the lower edge of the 20 five-minute candles — in plain terms, the main force is showing its hand with real money, not just making a false move.
What’s interesting is that OI actually shrank: down 0.56% on the 15-minute chart and down 1.44% on the 1-hour chart. This kind of “price down + open interest down” structure looks more like longs being forcibly de-leveraged, rather than shorts aggressively adding positions. The selling pressure was also brutal, with a buy-sell ratio of only 0.56, and shorts were suppressing price the entire time.
24-hour trading volume topped 36 million USD, and the abnormal capital flow ranked in the top 10 of the entire pool. At this kind of position, it’s either the final panic at a short-term bottom, or the accelerated start of a breakdown. The key is whether it can quickly reclaim the level next; if not, the downside may need to be reassessed.
Don’t rush to catch the falling knife — let the bullet fly for a while first.
What’s interesting is that OI actually shrank: down 0.56% on the 15-minute chart and down 1.44% on the 1-hour chart. This kind of “price down + open interest down” structure looks more like longs being forcibly de-leveraged, rather than shorts aggressively adding positions. The selling pressure was also brutal, with a buy-sell ratio of only 0.56, and shorts were suppressing price the entire time.
24-hour trading volume topped 36 million USD, and the abnormal capital flow ranked in the top 10 of the entire pool. At this kind of position, it’s either the final panic at a short-term bottom, or the accelerated start of a breakdown. The key is whether it can quickly reclaim the level next; if not, the downside may need to be reassessed.
Don’t rush to catch the falling knife — let the bullet fly for a while first.