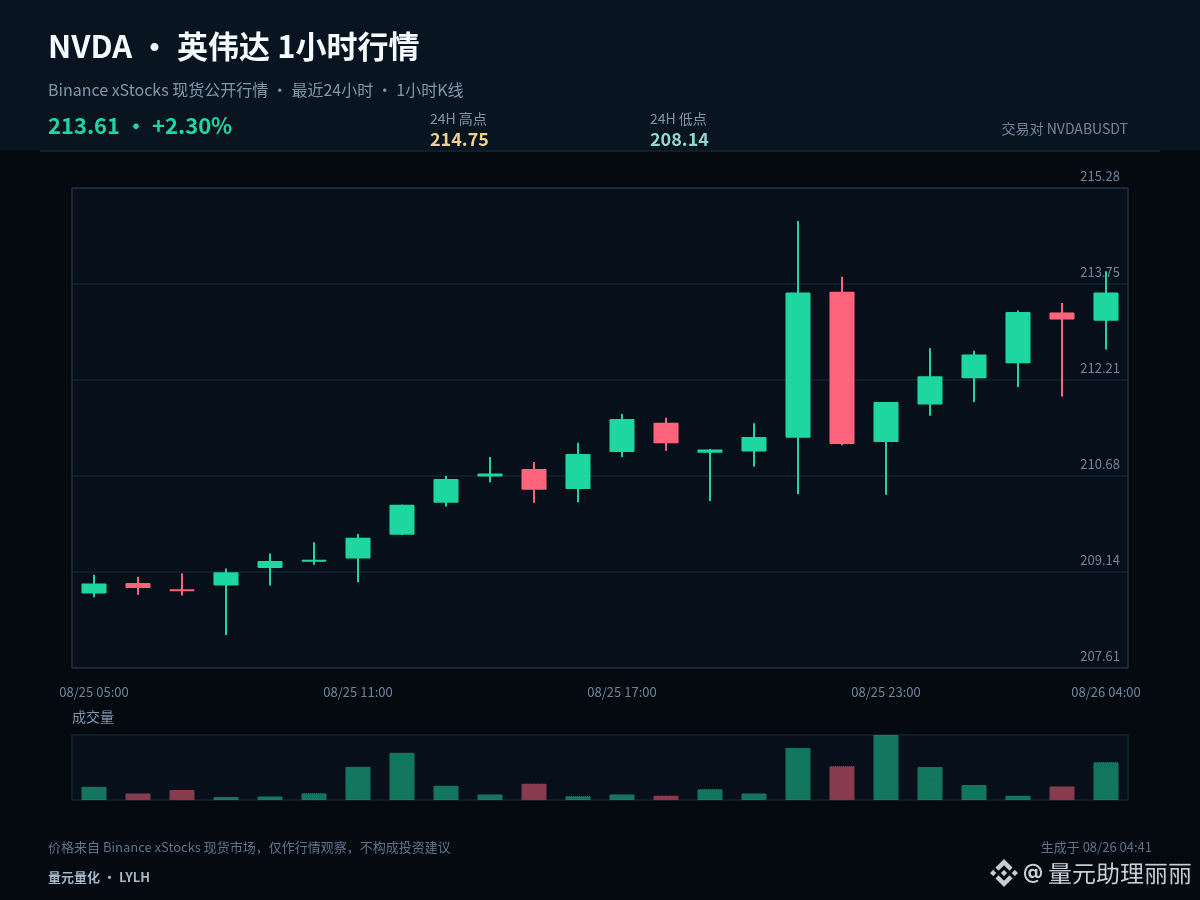
$NVDAB #NVDA From a layout perspective, the focus is not on chasing fluctuations that have already occurred, but on determining in advance the position you are willing to wait for. Current price: 213.61, 1 hour: +0.20%, 24 hours: +2.37%。
The current price is near the upper bound of the past 24-hour range: 1 hour +0.20%, 24 hours +2.37%。The most important thing at the highs is to confirm market acceptance after a breakout: if the price can stay above the upper bound, it indicates the market recognizes a higher range; if it only briefly pierces and quickly reclaims, you need to guard against a false breakout.
The first observation zone is 211.445, used to judge whether a typical pullback has ended; the second observation zone is 208.14, used to judge whether a deeper retracement can still find support. On the upside, pay attention to 214.75; after a breakout, you should look for a pullback confirmation to avoid mistaking a brief pierce for an already-open trend.
Position management should distinguish between swing (mid-term) and short-term trades. For existing swing positions, first assess whether the structure is broken; you don’t need to be repeatedly swayed by a single 1-hour candlestick. For short-term positions, execute around supports, resistances, and closing confirmations. For those who are in cash, there’s no need to chase prices in the middle of the range; waiting for a clearer location is often more advantageous.
The purpose of scaling in is not to constantly lower your average cost, but to control the pace while the structure remains valid. Once a key support fails, you should stop the original plan and wait for a new price range to form.
Risk control is still placed before the conclusion: only execute when the conditions appear; if the price invalidates, reassess promptly. The greater the volatility, the more restrained each position should be. The above is a scenario analysis based on current 1-hour and 24-hour data, and does not constitute any promise of returns.
#SamsungSKHynixLeveragedETFsPostFirstMonthlyOutflow
The current price is near the upper bound of the past 24-hour range: 1 hour +0.20%, 24 hours +2.37%。The most important thing at the highs is to confirm market acceptance after a breakout: if the price can stay above the upper bound, it indicates the market recognizes a higher range; if it only briefly pierces and quickly reclaims, you need to guard against a false breakout.
The first observation zone is 211.445, used to judge whether a typical pullback has ended; the second observation zone is 208.14, used to judge whether a deeper retracement can still find support. On the upside, pay attention to 214.75; after a breakout, you should look for a pullback confirmation to avoid mistaking a brief pierce for an already-open trend.
Position management should distinguish between swing (mid-term) and short-term trades. For existing swing positions, first assess whether the structure is broken; you don’t need to be repeatedly swayed by a single 1-hour candlestick. For short-term positions, execute around supports, resistances, and closing confirmations. For those who are in cash, there’s no need to chase prices in the middle of the range; waiting for a clearer location is often more advantageous.
The purpose of scaling in is not to constantly lower your average cost, but to control the pace while the structure remains valid. Once a key support fails, you should stop the original plan and wait for a new price range to form.
Risk control is still placed before the conclusion: only execute when the conditions appear; if the price invalidates, reassess promptly. The greater the volatility, the more restrained each position should be. The above is a scenario analysis based on current 1-hour and 24-hour data, and does not constitute any promise of returns.
#SamsungSKHynixLeveragedETFsPostFirstMonthlyOutflow