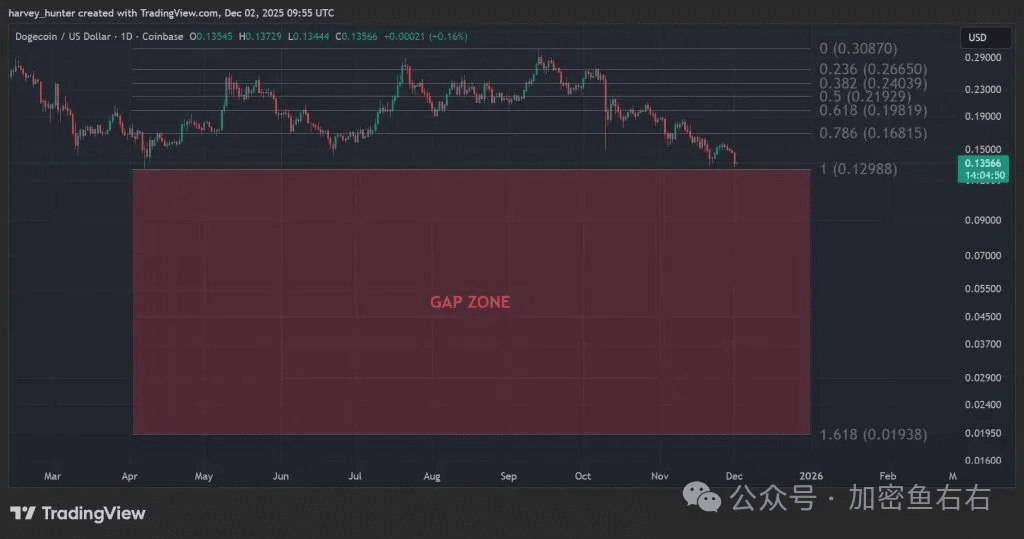
Dogecoin price has broken below the upward trend line that has lasted for a year and is currently testing the key Fibonacci support level of $0.13. The market is in extreme divergence: if it effectively breaks below, it may plunge to $0.02 (an 85% drop); if it reverses here, it could potentially begin a bullish journey towards $1 (a 530% increase). Historical performance shows that a monthly closing price below the trend line often marks the start of a 'surge season' rather than a crash.
⚖️ Bull-Bear Critical Point: Dual meaning of $0.13
Downward Risk Path:
Trigger Condition: Daily closing price confirms a break below $0.13
Target Price Level: $0.02 (1.618 Fibonacci extension)
Estimated decline: 85% deep correction
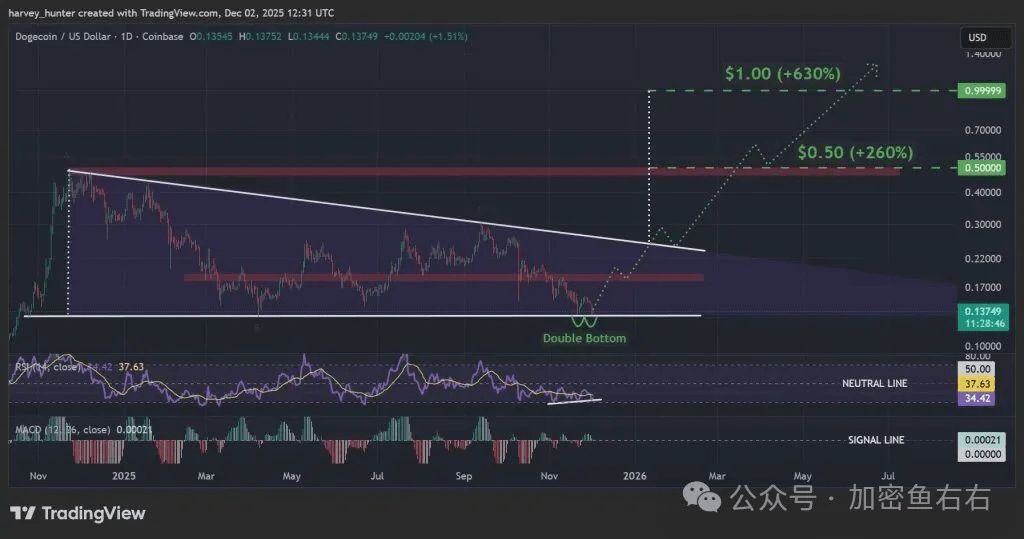
Upward reversal opportunity:
Technical foundation: Double bottom pattern + descending triangle lower edge resonance
Initial target: $0.19 (0.618 Fibonacci retracement)
Breakthrough target: $0.50 (+220%) → $1 (+530%)
 📊 Technical indicators sending conflicting signals
Positive signal:
RSI divergence: New price lows while the indicator does not reach new lows, suggesting momentum shift
Pattern support: Double bottom structure coinciding with the descending triangle lower edge
Historical pattern: A breakout below the trend line on the monthly chart often leads to a surge
Risk warning:
Trend break: Long-term upward trend line has been broken
MACD threat: Death cross is forming
Environmental dependence: Requires coordination with macro benefits like interest rate policy
 🔮 Market environment and catalytic factors
Key variable:
U.S. interest rate policy: A rate cut in December will boost risk assets
Market sentiment: Overall capital flow in the meme coin sector
Volume coordination: Breakthrough requires volume confirmation
Analyst perspective:
This could be a deceptive bullish pattern initiation platform — history shows that such breakouts often signal a 'Dogecoin surge season.'
Operational strategy: It is recommended to use $0.13 as the boundary line for long and short positions, with light positions for bullish attempts above, and strict stop loss below. If a volume rebound occurs and recovers $0.14, consider adding positions; if it remains weak and sideways, maintain a wait-and-see approach. Pay close attention to U.S. interest rate decisions and the overall sentiment in the cryptocurrency market.
When extreme fear and historic opportunities appear simultaneously, investors need discipline rather than courage. $0.13 is not just a technical level, but a litmus test for market psychology — holding it will brew new life, while losing it leads to the abyss.
The market changes rapidly, and specific entry and exit points should be decided in real time; follow the trend! Regardless of how confident you are, please strictly execute the stop-loss strategy! That's all for today! Follow me, don't get lost! The price of Dogecoin has fallen below the upward trend line maintained for over a year, and is currently testing the key Fibonacci support level of $0.13. The market is in extreme divergence: if it effectively breaks down, it may plunge towards $0.02 (an 85% drop); if it reverses here, it may initiate a bull market journey towards $1 (a 530% increase). The historical performance of the monthly closing price below the trend line often indicates the beginning of a 'surge season' rather than a collapse.
⚖️ Critical point of long and short positions: The dual meaning of $0.13
Downward risk path:
Trigger condition: Daily closing price confirms a drop below $0.13
Target price: $0.02 (1.618 Fibonacci extension)
Estimated decline: 85% deep correction
Upward reversal opportunity:
Technical foundation: Double bottom pattern + descending triangle lower edge resonance
Initial target: $0.19 (0.618 Fibonacci retracement)
Breakthrough target: $0.50 (+220%) → $1 (+530%)
📊 Technical indicators sending conflicting signals
Positive signal:
RSI divergence: New price lows while the indicator does not reach new lows, suggesting momentum shift
Pattern support: Double bottom structure coinciding with the descending triangle lower edge
Historical pattern: A breakout below the trend line on the monthly chart often leads to a surge
Risk warning:
Trend break: Long-term upward trend line has been broken
MACD threat: Death cross is forming
Environmental dependence: Requires coordination with macro benefits like interest rate policy
🔮 Market environment and catalytic factors
Key variable:
U.S. interest rate policy: A rate cut in December will boost risk assets
Market sentiment: Overall capital flow in the meme coin sector
Volume coordination: Breakthrough requires volume confirmation
Analyst perspective:
This could be a deceptive bullish pattern initiation platform — history shows that such breakouts often signal a 'Dogecoin surge season.'
Operational strategy: It is recommended to use $0.13 as the boundary line for long and short positions, with light positions for bullish attempts above, and strict stop loss below. If a volume rebound occurs and recovers $0.14, consider adding positions; if it remains weak and sideways, maintain a wait-and-see approach. Pay close attention to U.S. interest rate decisions and the overall sentiment in the cryptocurrency market.
When extreme fear and historic opportunities appear simultaneously, investors need discipline rather than courage. $0.13 is not just a technical level, but a litmus test for market psychology — holding it will brew new life, while losing it leads to the abyss.
The market changes rapidly, and specific entry and exit points should be decided in real time; follow the trend! Regardless of how confident you are, please strictly execute the stop-loss strategy! That's all for today! Follow me, don't get lost!
