


The Belt Hold is a single model of Japanese candlesticks that often signals the end of the current correction and the resumption of the main trend. Its name comes from the visual similarity to a sumo wrestler holding an opponent by the belt (both terms in Japanese technique often have roots in martial arts).
This model is a type of marubozu candlestick, but with one important difference: it has a small shadow on one side.
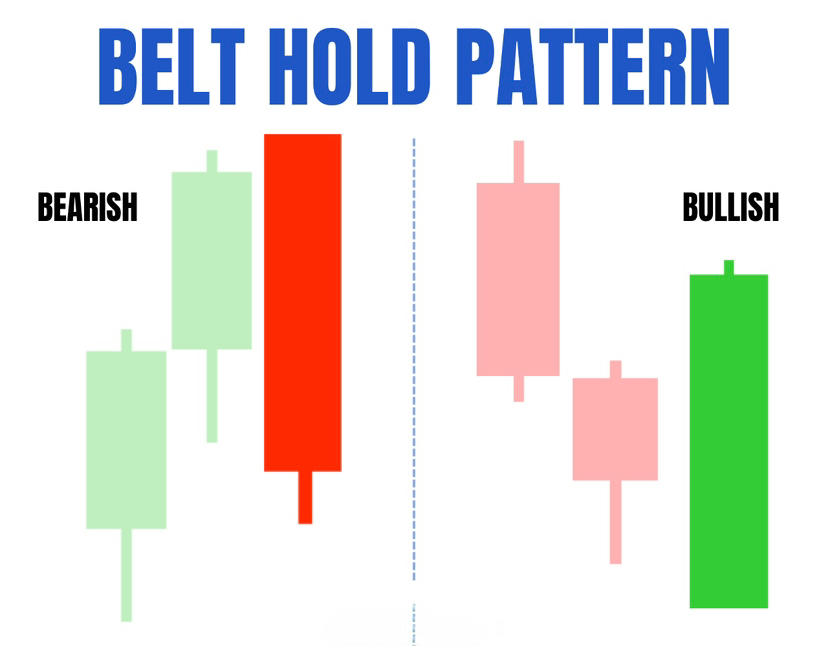

Anatomy of the model
The main characteristic of Belt Hold is the complete absence of a shadow from the opening price. This means that the market immediately started moving in one direction after opening, without retracing a single point.
1. Bullish Belt Hold
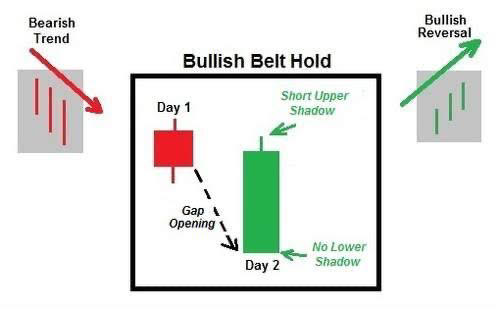
Appears during a downward trend or local pullback.
• Opening: Price opens with a gap (break) down, at the low of the candlestick.
• Shadows: The lower shadow is completely absent. The upper shadow may be short.
• Body: Long, white (green).
• Signal: Buyers immediately seized the initiative. This indicates the capitulation of bears.
2. Bearish Belt Hold
Appears during an upward trend.
• Opening: Price opens with a gap up, at the very peak.
• Shadows: The upper shadow is absent. The lower shadow may be short.
• Body: Long, black (red).
• Signal: Strong selling pressure right 'from the get-go', indicating a likely reversal or deep correction.
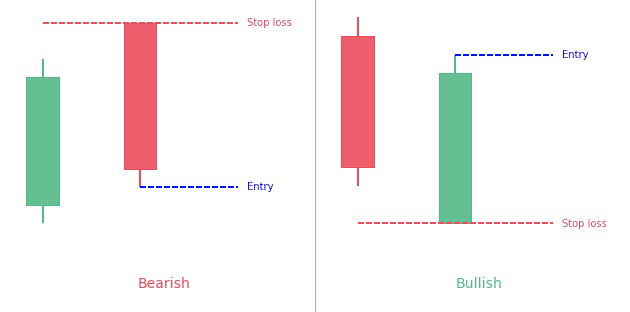
Market psychology
The 'Waist Hold' model demonstrates a change in sentiment. When a Belt Hold of the opposite color appears after a series of candlesticks of one color, it triggers panic among those holding positions in the previous trend.
• The absence of shadow from the opening indicates that the opposite side didn't even attempt to resist.
• A long body confirms that the momentum is strong and significant.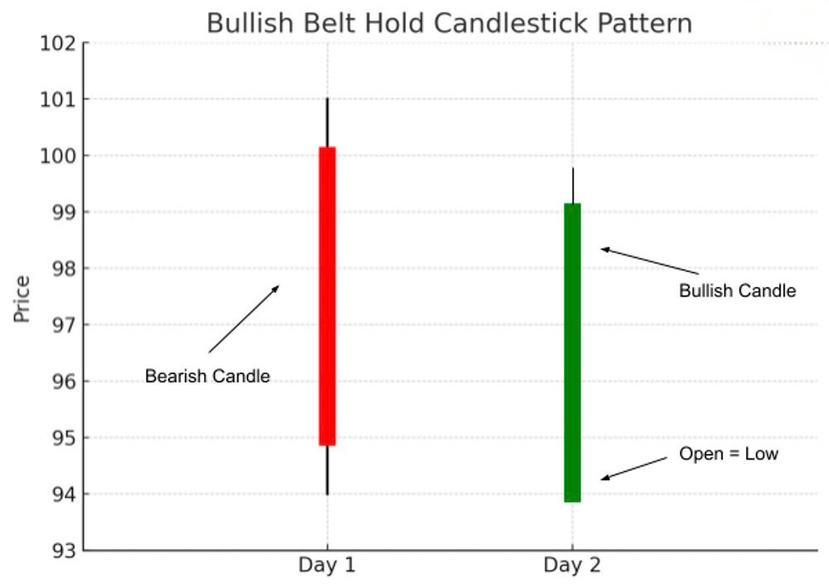
Trading rules and confirmations
Despite the strength of the signal, Belt Hold is just a single candlestick. For successful trading, it's crucial to consider the context:
1. Body length: The longer the candlestick compared to previous ones, the stronger the signal is considered.
2. Support/resistance levels: The signal becomes significantly more reliable if the Belt Hold bounces off an important level or moving average.
3. Volume: Increased trading volumes during the formation of this candlestick confirms the influx of 'smart money'.
4. Next candlestick: It is recommended to wait for confirmation. If the next candlestick closes above the high of the bullish Belt Hold (or below the low of the bearish), this is a signal to enter.
Risks and warnings
• False signals in a range: If the market is in a sideways move, Belt Hold often has no predictive power and is just noise.
• Too long body: If the candlestick is abnormally large, entering the market might be too late, as the price has already made most of the move, and the stop-loss might be too large.
• Fundamental factors: Belt Hold often forms on the release of important news. In such cases, technical analysis may be secondary to the market's reaction to the news.
Tip: Use Belt Hold in conjunction with oscillators (e.g., RSI or Stochastic). If the model appears in an oversold/overbought zone, its effectiveness increases significantly.
📊13 Best Indicators for Crypto Trading: Complete Guide to Day and Swing Trading📈📉