
After ten years of struggling in the crypto space, it wasn't until six years ago, under the careful guidance of a senior, that I finally realized and found the key.
A trading strategy of one's own characteristics. Today, although I have not made it into the ranks of the wealthy, I have achieved consistent profits, enough to keep me in the top 20% of the investment field.
Years ago, I realized deeply that an excellent trading strategy is an indispensable tool for investors. Without systematic guidance, it is like a blind person trying to touch an elephant, with slim chances of success. However, refining an effective trading strategy is not an easy task.
The efficiency of this strategy lies precisely in its contrarian nature. It requires us to abandon greed and fear, to be calm and decisive, to reject personal assumptions, and to steadfastly execute established guidelines.
In the crypto space, to make money in the long term, it's not about luck but about systematic strategies, strict discipline, and good execution. Below, I will share some tried-and-true trading strategies from practice, along with the bottom line principles I have set, hoping they will be helpful to you.
1. Money management strategy: Risk control is the top priority.
1. Never go all in; always leave some room.
The fundamental reason many people lose money in trading is not that they bought the wrong asset, but that their position size is too heavy, leaving them with no chance to recover once the market turns against them.
Control position size with every trade; do not heavily bet on a single cryptocurrency.
Allocate funds reasonably, e.g., 60% for long-term spot holdings, 30% for spot swing trades, and 10% cash waiting for opportunities.
Always leave some bullets; when the market gives opportunities, you need to have money to bottom-fish.
2. Control the maximum loss to 10%-20%.
"You can't be right every time, but you must ensure that your losses are manageable when you're wrong."
I set stop-loss points for every trade, usually not exceeding 10%-20%.
If I incur a loss of 10% after buying, I will directly stop loss to avoid being deeply trapped.
If the market is favorable, gradually increase your position, but add no more than 50% of your position to avoid excessive risk exposure.
Most people lose money in the crypto space not because they lose 10% on a single trade, but because they endure a -90% drawdown.
2. Trading strategy: Go with the trend, avoid pointless struggles.
3. Only trade mainstream coins; do not touch scam coins.
Hold BTC and ETH long-term, sell gradually in a bull market, and buy gradually in a bear market.
Participate in some quality altcoins with small positions, but firmly avoid Ponzi schemes, scam coins, and multi-level marketing coins.
The main reason 80% of retail investors lose money in the crypto space is that they invest most of their funds into scam coins, ultimately leading to the project owner running away or the investment going to zero.
4. Trade with the trend; do not go against it.
"Market trends are always your friend."
In a bull market, think bullish; add to your position when the price is low, and set target take-profits.
In a bear market, hold cash and wait for a larger turning point before entering the market.
When BTC stabilizes above the 200-day moving average, the market is likely in a bull market, and you can actively go long.
When BTC falls below the 200-day moving average, it is highly likely to enter a bear market, reduce trading, and avoid being harvested.
If you don't know how the trend is going, look at the larger cycle candlesticks and don't be disturbed by short-term fluctuations.
5. Set 'entry point, stop-loss point, take-profit point' before trading.
"Without a trading plan, it's like running naked."
Entry point: Wait for the trend to clarify before entering; do not guess the bottom.
Stop-loss point: directly stop loss if it falls below a key support level; do not cling to the position.
Take-profit point: Partially take profit when gaining 30%-50% to prevent a pullback.
Execution is more important than strategy! Once rules are set, strictly enforce them, and do not change them on the fly.
3. Bottom line principle: Don't make fatal mistakes.
6. Absolutely avoid high-leverage contracts.
"Contracts can make you rich overnight, but they can also cause you to go bankrupt overnight."
Many people trade correctly, but they open too much leverage, and just a slight market fluctuation can lead to liquidation, resulting in losses.
Use a maximum of 2-3 times leverage; never use above 10 times leverage.
Only use leverage when the trend is extremely clear; otherwise, only trade spot.
The fate of most contract traders: initial capital of 100,000 - leverage to 1,000,000 - ultimately losing everything.
7. When you make money, you must secure it.
"Paper wealth is not wealth; only realized gains count."
Many people made a fortune in the bull market but failed to cash out, ultimately losing everything in the bear market.
My principles:
In a bull market, gradually take profits by converting 30% to USDT or fiat currency to secure your gains.
Regularly withdraw a portion of your profits for real-life investments.
In a bear market, use the realized funds to buy back BTC and ETH at lower prices.
Market fluctuations are cyclical; do not think you can sell at the highest point every time; making money is the key.
Summary: My trading strategy in the crypto space.
1. Money management:
Do not go all in; allocate positions reasonably and always leave some room.
Losses should not exceed 10%-20%; strict stop-loss.
2. Trading strategy:
Only trade mainstream coins; do not touch scam coins.
Trade with the trend; do not try to bottom-fish against it.
Set entry points, stop-loss points, and take-profit points, and strictly enforce them.
3. Bottom line principle:
Absolutely avoid high leverage; contracts are just a cherry on top, not a recovery tool.
When you make money, you must secure it; regularly withdraw profits.

Basic guide to the ABCD pattern.
1. Introduction.
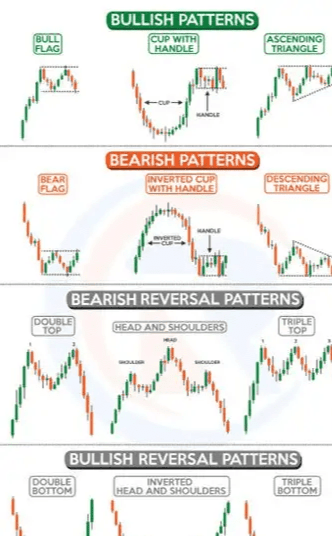
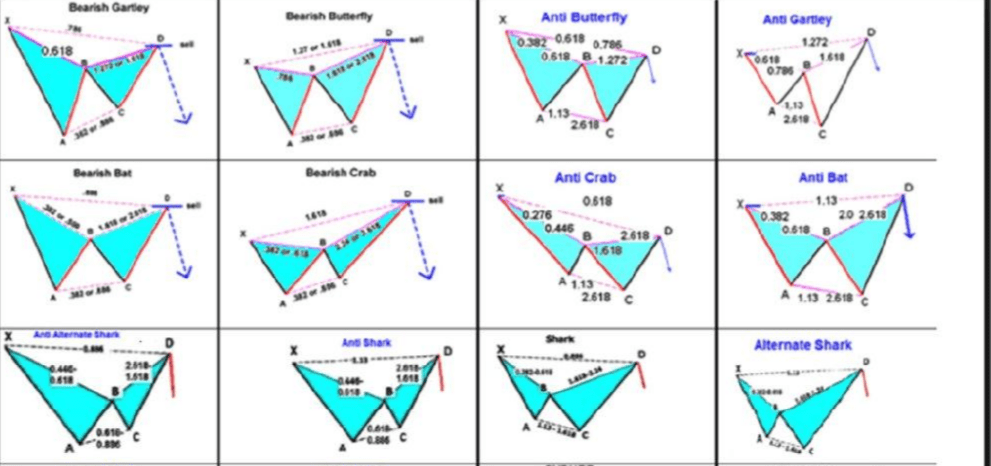
In the world of trading, chart patterns are undoubtedly numerous. From crab shapes to dinosaur shapes, these chart patterns may be the most popular, as shown in the figure below.
This is a type belonging to H.M. Gartley.
The proposed harmonic pattern.
Family patterns.
In this guide, we will not use those complicated Fibonacci tools; you will learn the following:
(1) How to interpret the ABCD pattern to accurately understand its appearance on the chart.
(2) Avoid common mistakes when trading the ABCD pattern, as these mistakes can undermine your trading results.
(3) Answers on how to overcome the shortcomings of the ABCD pattern.
(4) A simple process and strategy on how to handle and trade the ABCD pattern.
(5) The best secret strategy for trading the ABCD pattern.
2. The ABCD pattern revealed: What is it, and how does it work?
Imagine the vast trading environment as an engaging puzzle, as shown in the figure below.
Although this may be somewhat exaggerated, its core is indeed the ABCD pattern. This is an extraordinary guide that sets the tone for traders seeking strategic insights. Unlike harmonic trading, it is clearly composed of various elements, as shown in the figure below.
The ABCD pattern leverages its simplicity to gain an advantage, built on the interactions between four key elements: A, B, C, and D. It can be said that this is a balanced trading strategy.
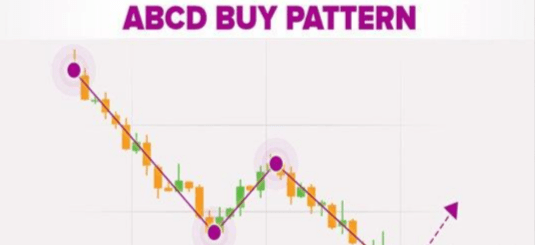
As shown in the figure above, like a puzzle, each piece fits together cleverly, revealing the core of market dynamics through these unique perspectives. As a trader, your responsibility is to decode these stories and turn them into wise profit decisions.
So, how do the various elements in the ABCD pattern connect with each other?
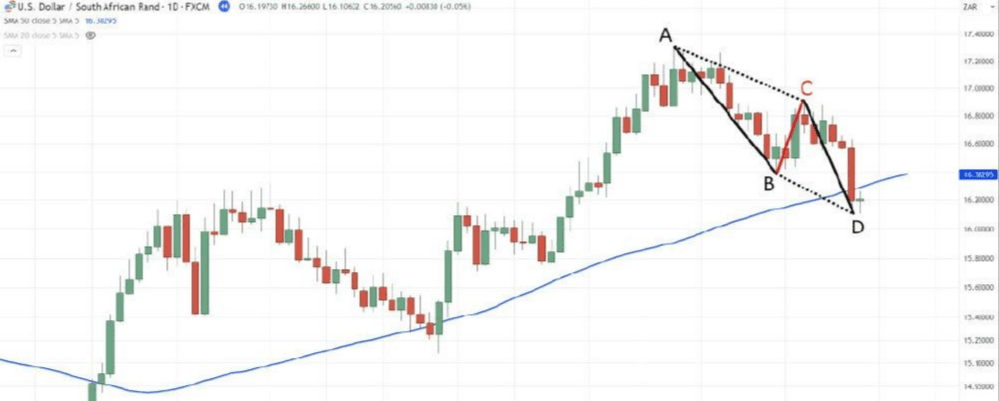
(1) ABCD Pattern: A to B.
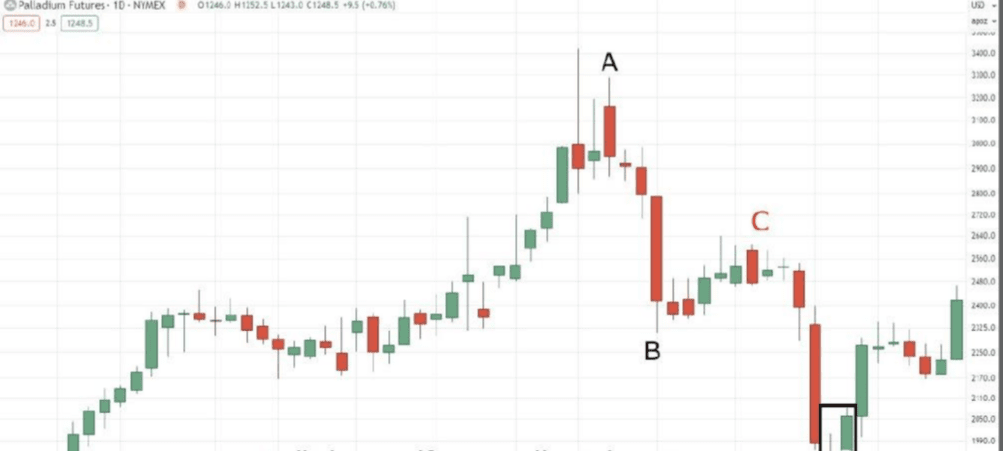
The story starts from A to B, where A and B are a dynamic pair initiating this sequence with bold and powerful market actions, captivating like a gripping novel, as shown in the figure below.
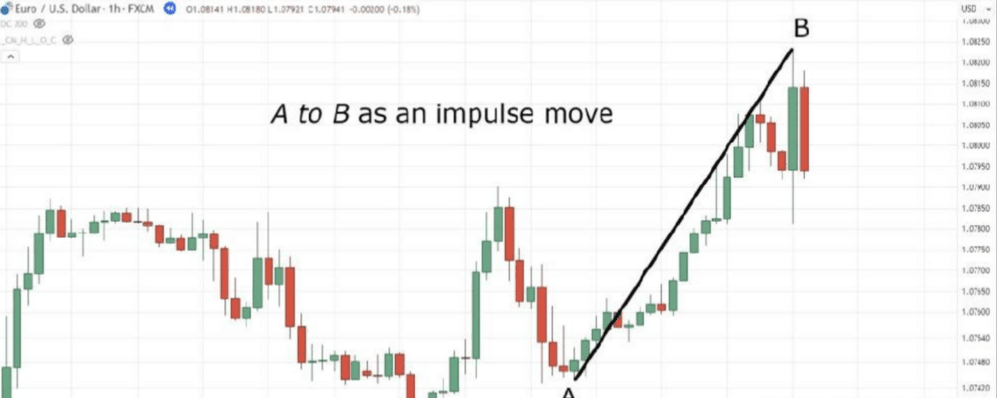
This move is not merely an inception; it is an engaging prologue that can lay the foundation for success and confuse traders. Nevertheless, the movement from A to B must be clear and almost without hesitation, as this is our first sign of identifying the pattern.
(2) ABCD Pattern: B to C.
In the unfolding story of the ABCD pattern, consider B to C as a crucial halftime where the market needs time to readjust, gradually pulling back from the initial rapid rise. In short, is it a pullback or a consolidation, as shown in the figure below?
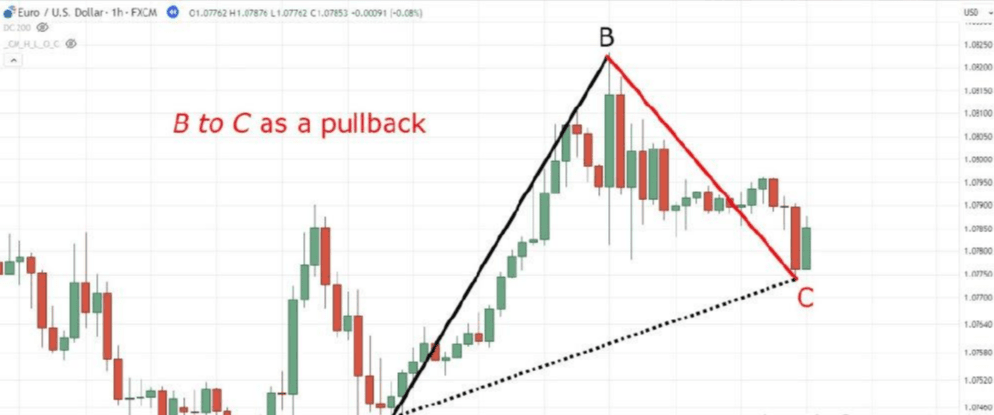
This part is crucial because most traders find it difficult to recognize it; I will briefly introduce it in the following content.
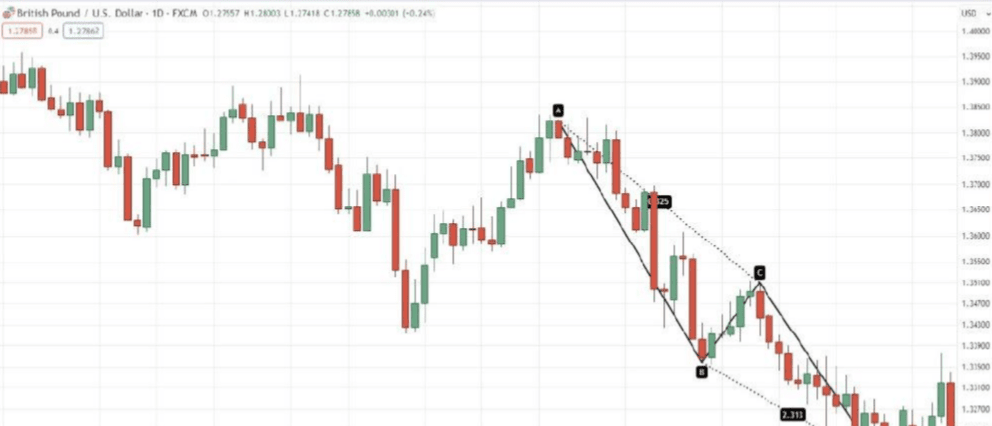
(3) ABCD Pattern: C to D.
As the curtain rises on the climax of the pattern, we enter C to D, this dramatic reveal phase completes the entire ABCD pattern. However, you should remember a few things; the movement from C to D must follow the same principles I used to identify the A to B leg, as shown in the figure below.
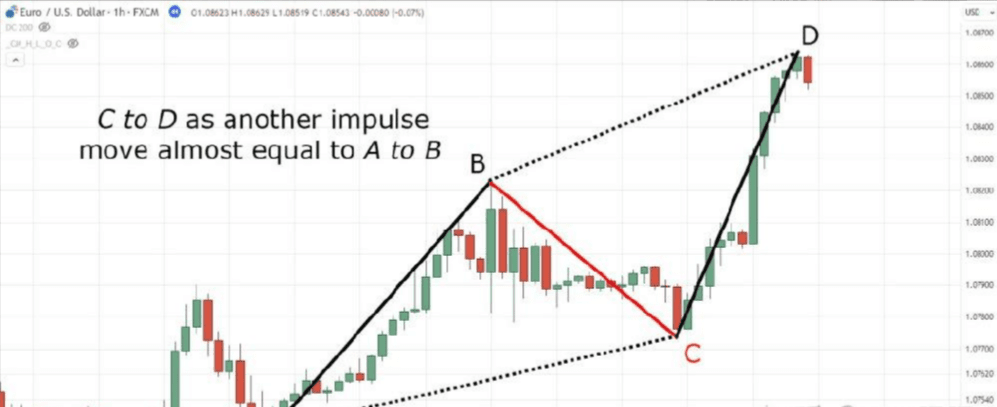
This is a powerful move, almost without hesitation, almost equivalent to the impulsive movement from A to B. Indeed, the A-B and C-D legs must be almost equal. I say 'almost' because each concept and indicator is always a 'zone' on the chart.
Overall, the ABCD pattern encapsulates the beauty of simplicity in the complex trading world. From A to B, from B to C, from C to D, this pattern provides a dynamic sequence that may even reflect the ups and downs of life itself. So considering all this, how do we trade the ABCD pattern correctly?
3. ABCD Pattern Wizardry: Trade in a correct, intelligent, and stylish way.
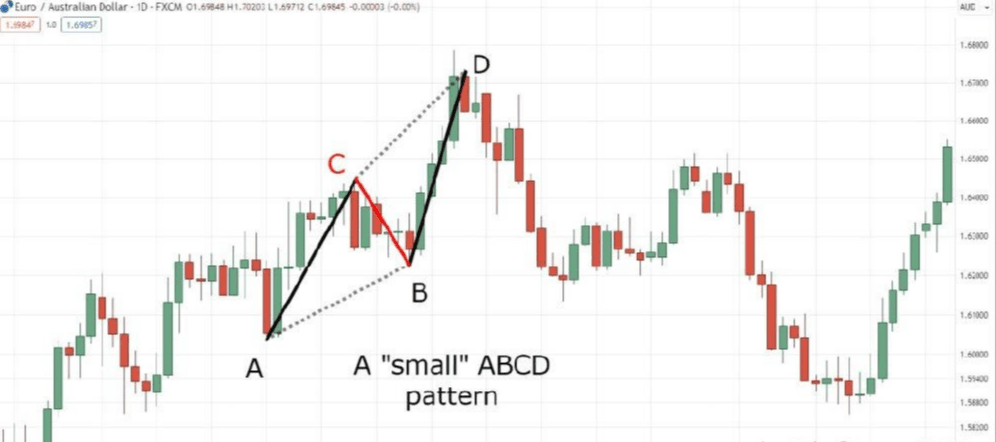
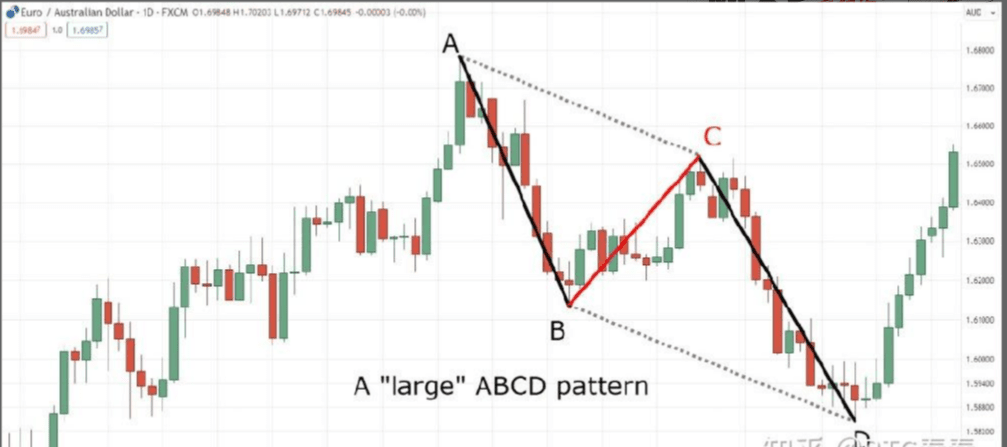
Let’s delve deeper into the ABCD pattern, not as an observer, but as a participant in this trading game. Therefore, when dealing with the ABCD pattern, you must identify the ABCD pattern with the goal of trading, rather than just analyzing. A core fact is that ABCD patterns exist in their variants, some larger, as shown in the figure below.
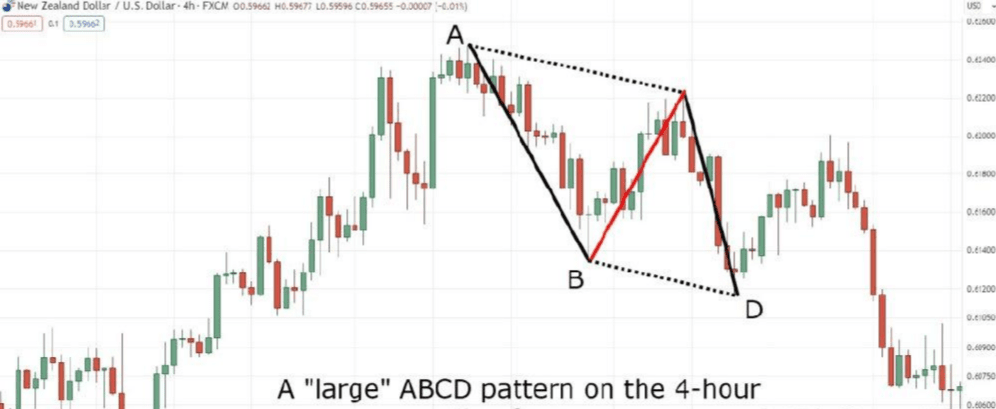
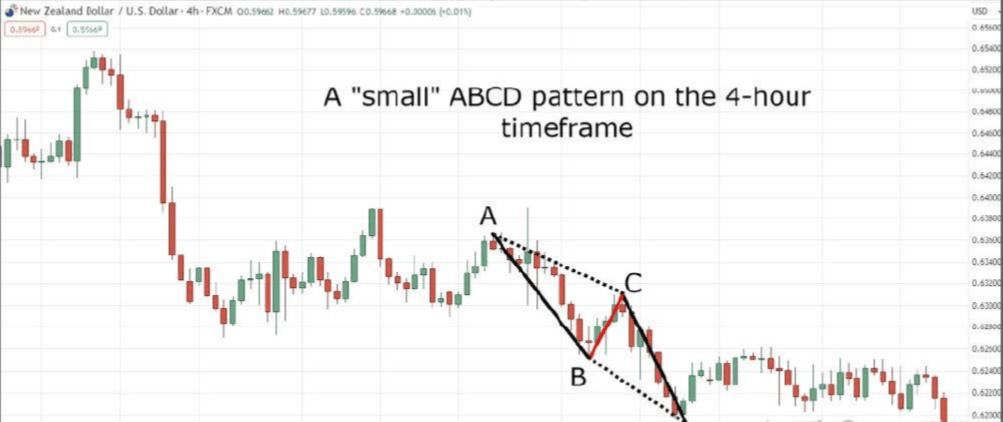
But remember, any ABCD pattern can fail before completing its pattern, just like any other pattern. Therefore, when trading the ABCD pattern, stick to one time frame and trade based on patterns that show their size on the chart. Never forget that the ABCD pattern is an element of your winning trades, not an artifact of endless analysis.
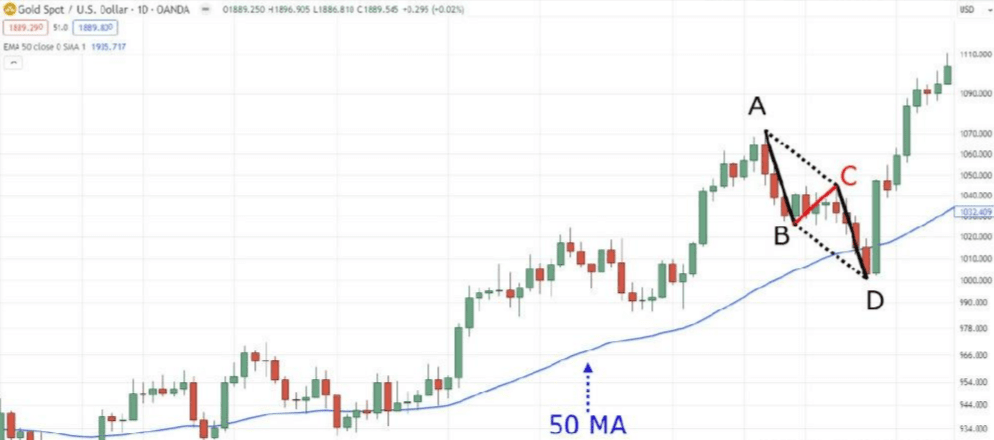
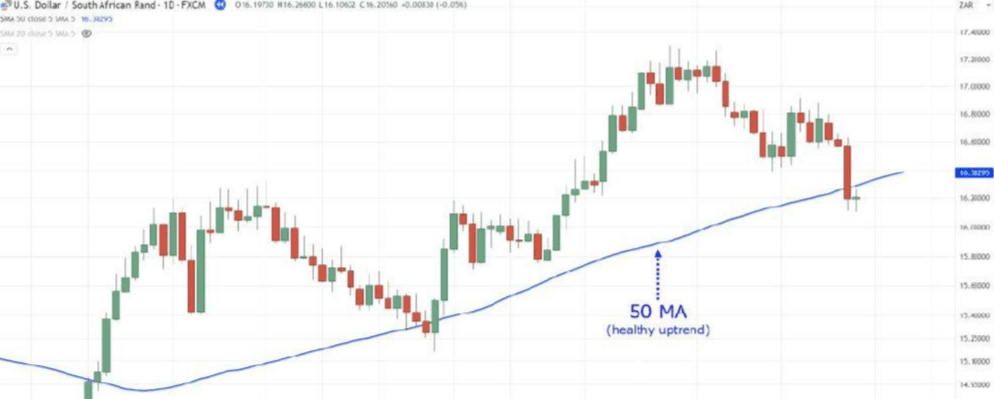
So, are you ready to discuss some trends? Because if you intend to trade using the ABCD pattern, you must do so by using the 50-period moving average.
Ensure there is a recognized healthy trend. When navigating the terrain of the ABCD pattern, a fundamental rule remains unchanged: embrace the comfort of mature, healthy trends, which means looking for bullish ABCD patterns in a healthy uptrend, as shown in the figure below.
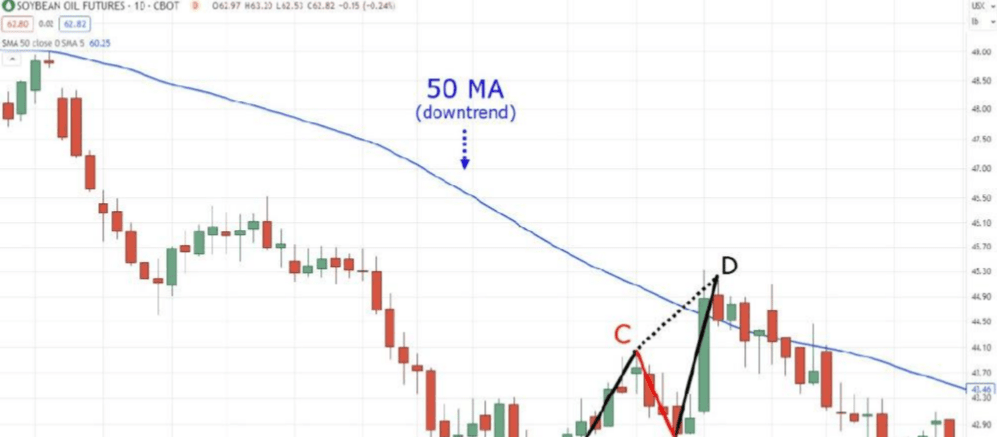
In a mature downtrend, look for bearish ABCD patterns, as shown in the figure below.
Of course, not the opposite, as shown in the figure below.
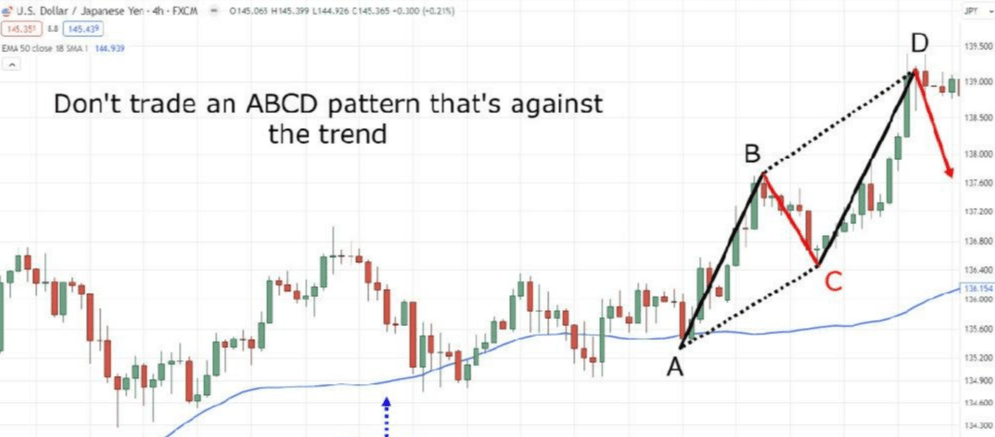
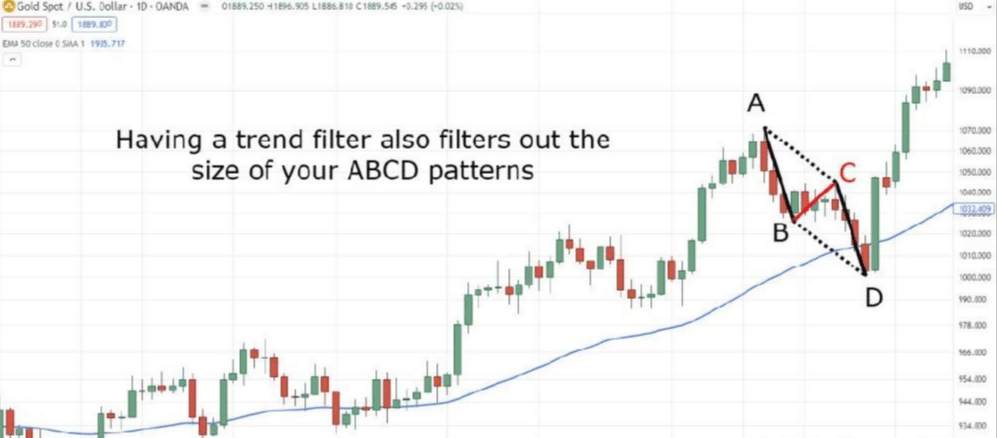
You may ask: How can this be? Isn't the purpose of the ABCD pattern to predict trend reversals? You can trade the ABCD pattern like this, but if you do, you will be at a significant disadvantage because, regardless of the pattern, you can never consistently predict the end of a trend. Now, you may wonder: Why do I need moving averages? The reason is that the ABCD pattern can be very large or very small, and by adopting a trend filter, you ensure that every ABCD pattern you discover is very consistent in size.
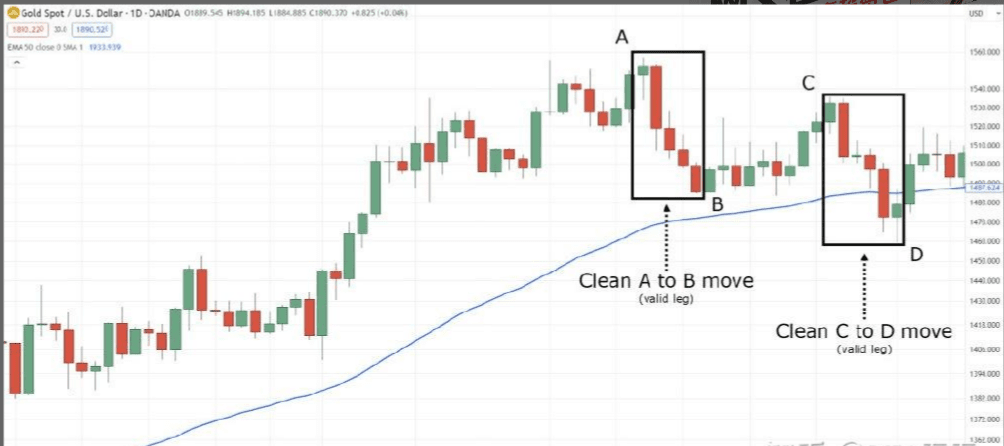
Another key part is always looking for strong symmetrical movements from A to B and C to D, rather than "choppy" movements. Imagine a dance floor; you prefer smooth movements rather than a choppy cha-cha; the ABCD pattern is no exception, so aim for those symmetrical movements from A to B and C to D, as shown in the figure below.
And not that choppy cha-cha, as shown in the figure below.
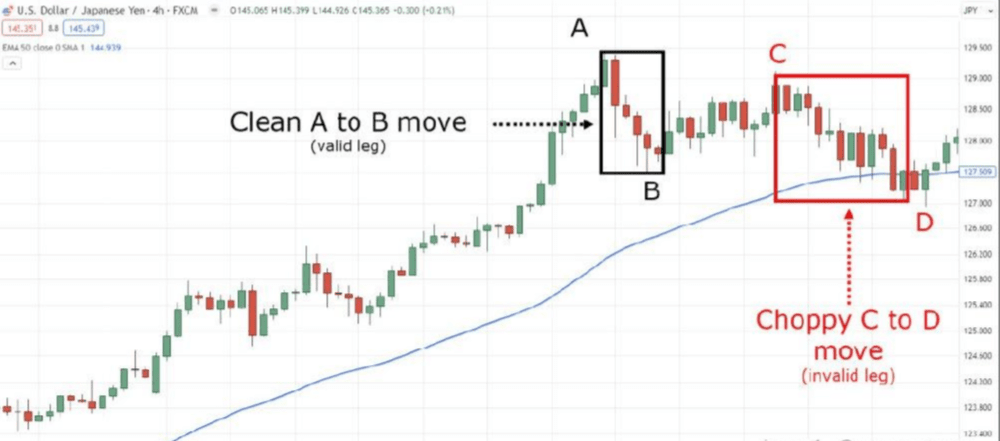
Look for a clear A-B and C-D movement, just like finding a perfect dance partner to complement your moves. Therefore, avoid a "choppy" dance and instead opt for a harmonious duet.
Now, suppose the ABCD pattern is complete, and it's part of an effective health trend, how exactly did you enter this pattern? Wait for a strong candle rejection at the completion of 'D'. You see, most traders blindly place orders the moment the pattern is complete, as shown in the figure below.
But ultimately, you should remember that the completion of 'D' is just a hypothetical area; the market can still decline, ignoring the entire pattern itself, as shown in the figure below.
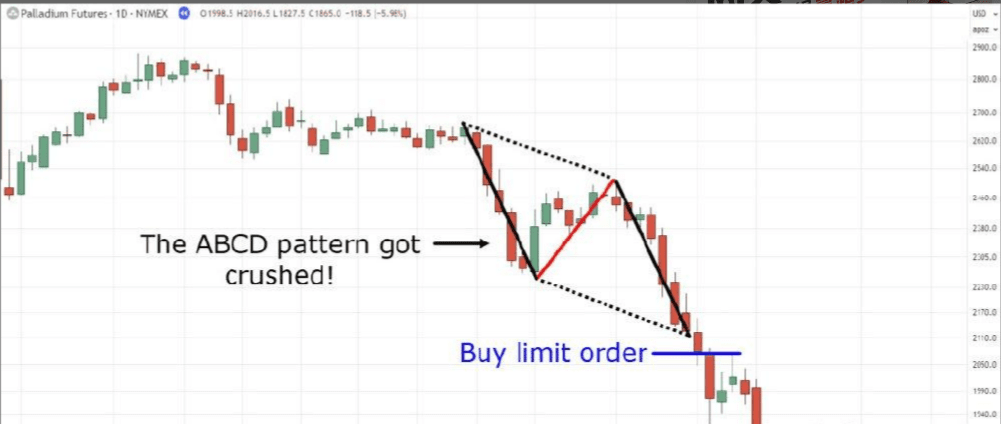
So, how do you judge when this hypothetical pattern will turn into a healthy reality? You must ensure that the market reacts to effective candlestick price rejections, as shown in the figure below.
When you observe the moment the market shows rejection from the completion of the 'D' formation, that is when you can consider that the market has recognized this formation. In short, with intentional gameplay, a story of trends, compelling actions, and the convergence task with the ABCD pattern, you are ready to conquer the trading realm gracefully. Next, I will share common mistakes when dealing with the ABCD pattern, so we can minimize those low points in your ABCD trading life.
4. ABCD Pattern Pitfalls: Avoid these dangerous mistakes.
(1) Error 1: Trading the pattern even if it is not yet complete.
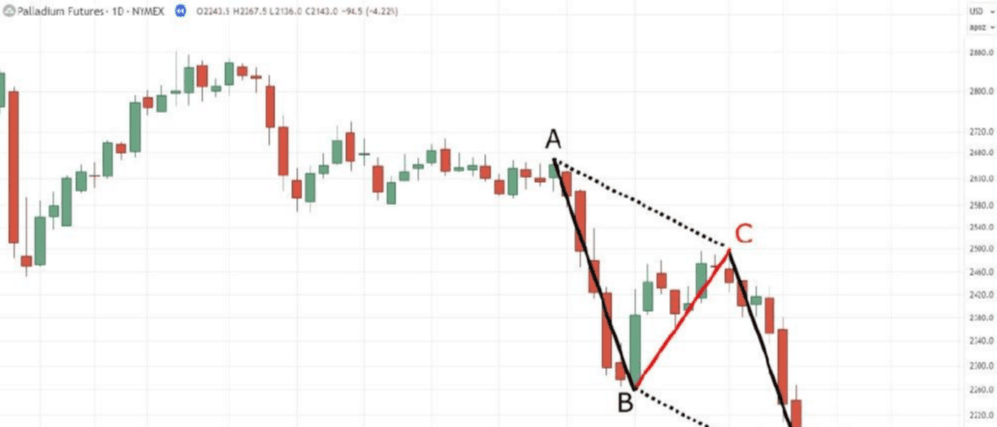
This is the most common mistake made by harmonic traders; just because the price forms an ABC pattern does not mean it will complete, and it never guarantees the completion of the C to B pattern. The market can easily reverse, as you observed in the previous example, as shown in the figure below.
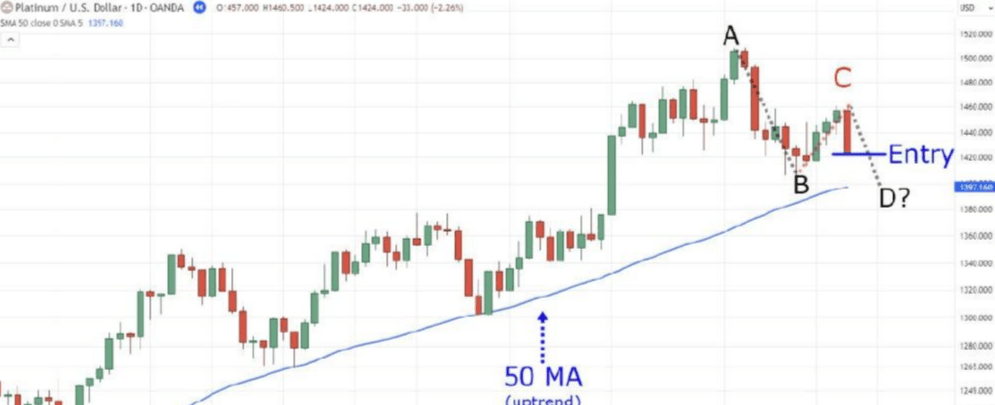
This is why it is vital to first determine the current trend; attempting to trade against the trend in the 'C' leg is too risky. This is why you must remember that patience is not just a virtue here; waiting for the entire ABCD pattern to complete is key to keeping those trading gears running smoothly.
(2) Error 2: Trying to identify every ABCD pattern you see.
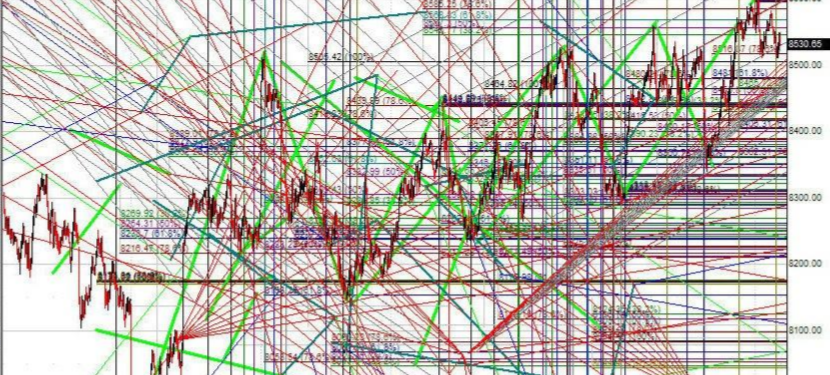
This is another golden rule to remember when trading the ABCD pattern. We use this pattern to trade the market, not just analyze it. If you use the ABCD pattern to analyze the market, your chart may present a shape like this.
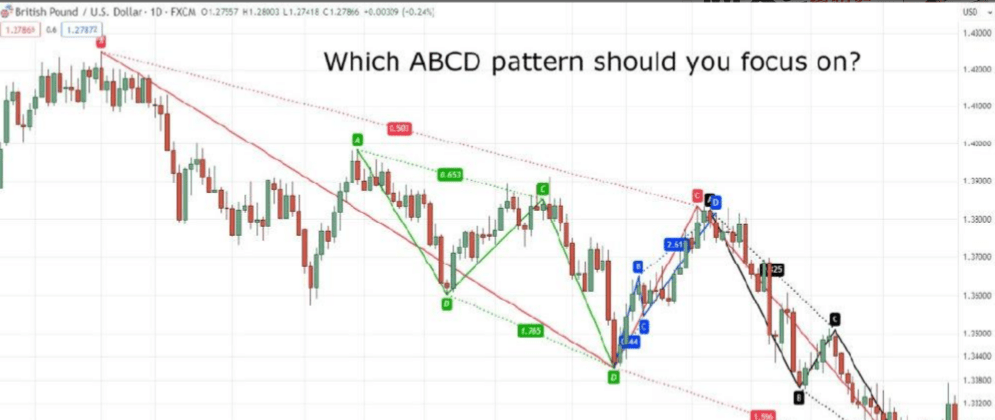
Even if your chart has countless 'converging' indicators, if it only paralyzes you and prevents you from pressing that buy button, then it is meaningless. That is why here the key is to focus on an ABCD pattern relevant to the current price, rather than a multitude of ABCD patterns behind you, as shown in the figure below.
Therefore, do not let your trading process become a noisy circus; do not draw multiple ABCD patterns on the chart, and avoid analysis paralysis.
(3) Error 3: Expecting all ABCD patterns to look the same.
Imagine a group of cats; although they are the same species, each has its unique personality. Similarly, the ABCD pattern presents a similar diversity; they may share family similarities, but each cat has its unique habits and variations, which bear similarities, as shown in the figure below.
There are different quirks and variations, as shown in the figure below.
So what is the solution to identify them? It includes the following two points:
1) Always use the 50-period moving average to identify trends.
2) Stick to one time frame.
This way, you will almost never miss the opportunity to discover the ABCD pattern, as shown in the figure below.
Therefore, in short, consider these ABCD pattern traps as quirky characters in your trading journey, just as any adventure has its challenges, so does trading the ABCD pattern. However, by avoiding these traps, you will be better equipped to handle the twists and turns and victories ahead. Now, I will reveal my secret strategy for trading the ABCD pattern; even if you don't have a precise trading strategy, you can use some concepts to add to your own strategy.
5. Unlocking the ABCD pattern mastery: Complete trading strategy.
Now is the moment of the grand finale, where we will reveal the 'secret' strategies to gain overwhelming advantages in trading the ABCD pattern. So, imagine you are executing a mission, opening the door to a room filled with treasures; what treasure are you pursuing? Of course, it's winning trades. Now, we will start from the first step to reveal the complete strategy.
(1) Step 1: Determine the healthy trend.
Do you remember what I shared with you earlier about healthy trends? Because this time we will use the 50-period moving average to systematically define healthy trends, as shown in the figure below.
It is recommended to look for ABCD patterns in healthy trends, but if you prefer, you can also choose to look for ABCD patterns in weak trends using the 200-period moving average.
(2) Step 2: Identify the ABCD pattern.
Regarding the pros and cons we discussed earlier, it all comes down to this step—correctly identifying patterns. Therefore, to keep it as simple as possible, the next step is to identify the ABCD pattern within your chosen timeframe in the existing health trends, as shown in the figure below.
(3) Step 3: Drop down to the 4-hour time frame and wait for the structural break.
Therefore, you might say: Why do we choose shorter time frames? For some traders, trading patterns can be very challenging in general because you must wait for the pattern to complete. You must be patient, remain calm, and let the pattern materialize.
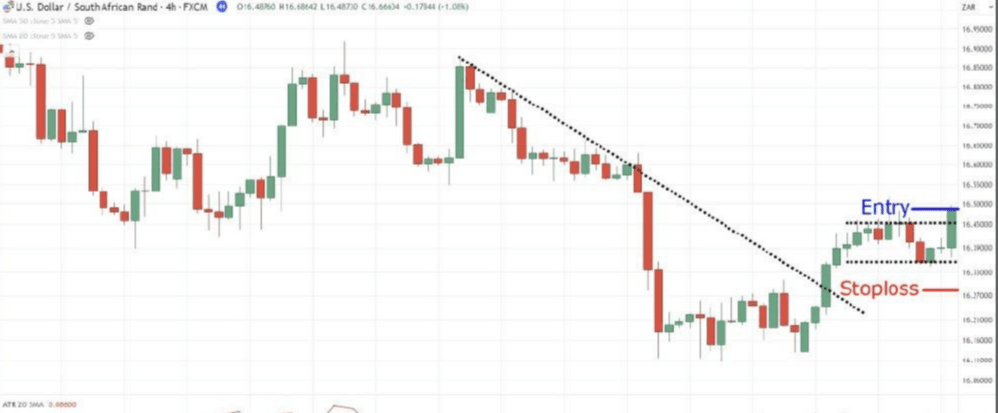
Some traders (maybe even you) might not be satisfied with this, so how do you address this issue? Drop down to a lower time frame, allowing you to ensure that you don't miss the pattern you've been waiting for. But you may want to know: What are we looking for here? Simply put, the breakout of structures and flag patterns, as shown in the figure below. Once you identify that ideal flag pattern breakout, as shown in the figure below.
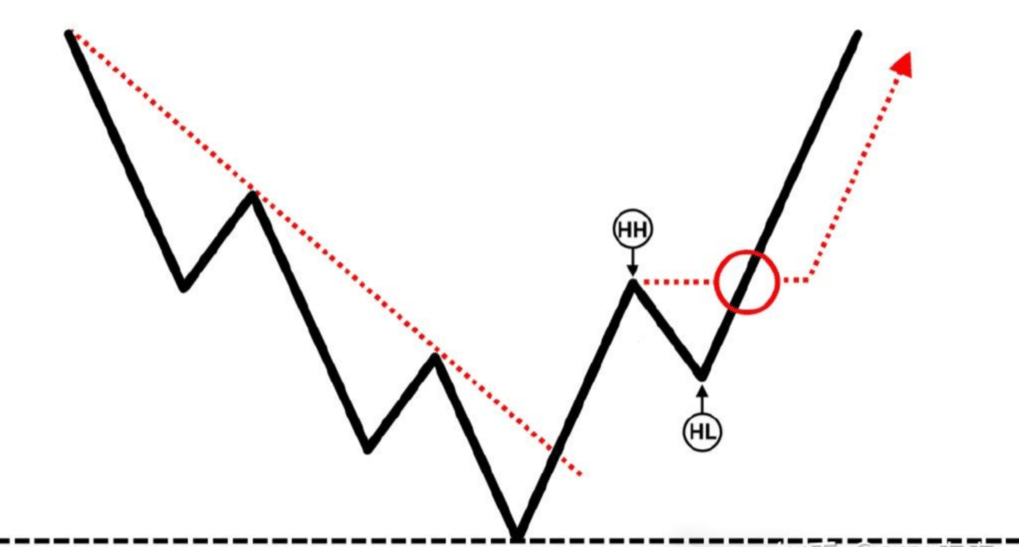
Once you identify that ideal flag pattern breakout, as shown in the figure below.
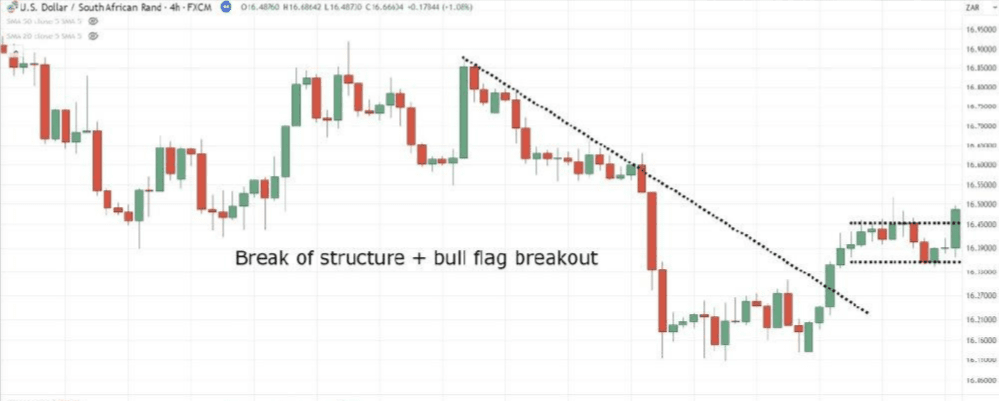
You can enter at the opening of the next candle and subtract 1 ATR (Average True Range) from the low point of the flag, as shown in the figure below.
Similarly, this is the same chart we saw in the previous step. When choosing a time frame, you can use a factor of 4-6 (for instance, if your entry time frame is H1, then your higher time frame could be H4).
(4) Step 4: Use the 20-period moving average on the daily time frame to track stop-losses.
This is called transitional trading, where we enter using a shorter time frame and manage trades with a longer time frame. Think of this as tracking the safe details of your treasure. Let me explain how it works internally based on our example. Once you enter a structural breakout on the 4-hour time frame, you go back to the daily time frame and pull out the 20-period moving average; you will only exit the trade if the price closes (not touches) above the 20-period moving average, as shown in the figure below.
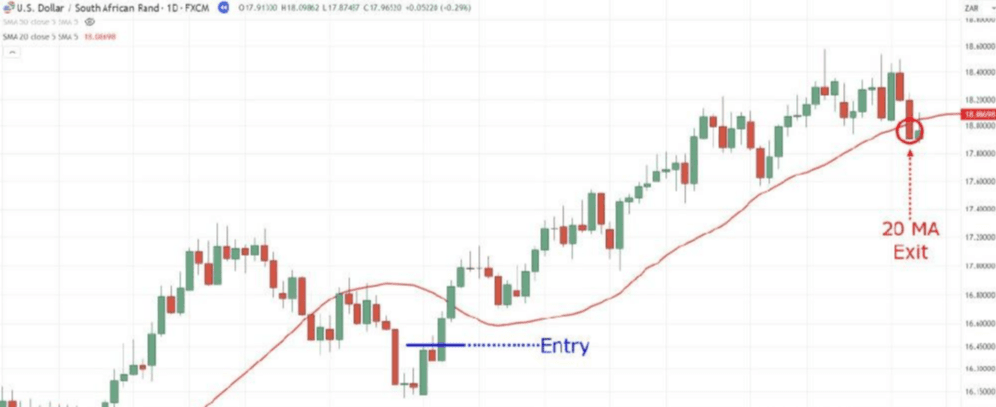
When we enter, the price is below the 20 MA; in this case, the trade is still valid. You will wait for the price to exceed it. With a stop-loss in place, you now proudly possess a complete trend continuation strategy using the ABCD pattern. Now, you may be curious: Why 20 periods? Why not use the 50-period moving average? This does not change the fact that we are entering lower time frames; to compensate for volatility in lower time frames, we use short-term moving averages daily.
You have uncovered some core secrets behind trading the ABCD pattern, from identifying trends to hourly risks; you have navigated the maze of trading with excellent strategies and considerable wisdom.
6. Conclusion: Below are the key points summarized from this guide:
(1) The ABCD pattern consists of two impulse moves, namely AB and C-D, followed by a corrective move, namely B-C.
(2) When identifying the ABCD pattern, it is crucial to simultaneously stick to one time frame and remain open to its various changes while having enough patience to wait for the pattern to complete.
(3) When trading the ABCD pattern, it's worth waiting for a healthy trend and a good false breakout at the completion of 'D' before entering the trade.
(4) One of the secret methods for trading the ABCD pattern is to use transitional trading, waiting for structural breaks in a shorter time frame and tracking stop-losses in a longer time frame.

Seven iron rules for trading cryptocurrencies!
1. For strong coins, if they drop from a high position for nine consecutive days, be sure to follow up in a timely manner.
2. Any cryptocurrency that rises for two consecutive days should be reduced in position size in a timely manner.
3. Any cryptocurrency that rises more than 7% has a chance to continue rising the next day, so you can continue to observe.
4. For strong bull coins, make sure to wait until the pullback is over before entering.
5. If any cryptocurrency has been stagnant for three consecutive days, observe for another three days; if there is no change, consider switching coins.
6. If any cryptocurrency fails to recover its cost price the next day, you should exit in a timely manner.
7. If a cryptocurrency has risen on the leaderboard, it must have risen five times, and if it has risen five times, it must have risen seven times. Coins that have risen for two consecutive days should be entered at a low point; the fifth day is usually a good selling point.
Welcome to follow Huihui, where you can learn and communicate through real trading, and gain clear direction and strategies for the market. Regardless of the market style, knowing in advance allows you to better grasp it!!!
BTC ETH