Daily Share
As the market develops, Bitcoin has once again broken through 30,000. As mentioned in yesterday's article, if it stabilizes at 30,000, the overall trend will indeed be bullish. At present, the price breakthrough has not yet been completely stabilized, but there are some signs of change. We still need some time to consider the weekly structure.
Regarding short-term, it is recommended not to chase too high, because the current trend is not a new round of market, which will be discussed later. What is certain is that there will be a pullback in the future, and there is a high probability that 28,000 and 27,000 will be reached. Even if you are strongly bullish, you should wait for a pullback before entering the market. In other words, even if you want to chase more now, it is recommended to enter and exit quickly with a stop loss.
Regarding the judgment of the market, I think the judgment is wrong, and there is nothing to hide, just be open and honest. But some villains keep on pestering, as if they can judge 100% accurately almost every day of the year. Moreover, it is hard to say whether the weekly trend is right or not. I will not talk about these. If you are still nagging, I will think that you are a bad person and block you directly.
BTC mid- to long-term
Weekly:
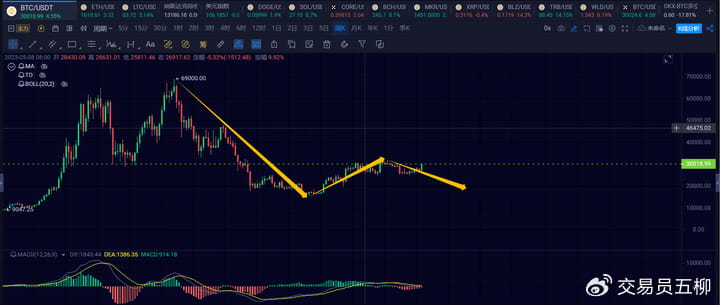
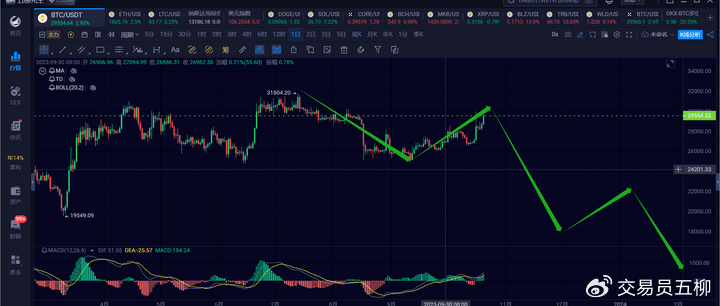
We originally judged that the second half of this year would see a weekly decline. The logic is very simple. When a weekly rebound ends, there will inevitably be a corresponding weekly decline. This is inevitable. It will not end in a weekly rebound. If this is the case, the market will continue to rise in a straight line, and there will be no ups and downs.
So the question is, the current weekly level decline has not come out, 31800~24900, this is a daily level decline. 24900~30,000 above, this is a daily level rebound, if the current weekly level decline, then where is the third daily level decline?
For a weekly rise, at least three daily moves up, down, and up are required. For a weekly fall, at least three daily moves down, up, and down are required. It is obvious that the third move down has not been made yet, and the market is approaching the starting point of the first daily move down.
In this case, we need to observe that if the current daily rise breaks through 31800, it means that the weekly rebound has been extended. But as mentioned before, you can't always extend it. That means that even if it breaks through, it will most likely come down and continue to fluctuate in the range of 25000~32000.
If it does not break through 31800, then we will continue to see the third daily decline. However, since the second daily rebound is relatively high, it is hard to say whether the third daily will break through 25000. This depends on the subsequent situation. Then we can draw a simple diagram:
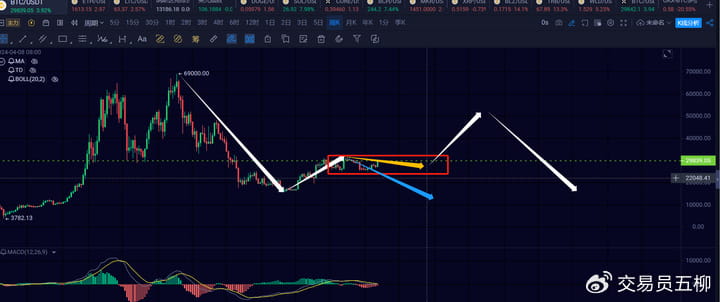
The white arrow, yellow arrow, and blue arrow in the above picture are all weekly lines.
The Bitcoin 25,000-32,000 is a daily pivot. Regardless of whether the current daily line breaks 31,800 or not, it will oscillate again in this pivot, thereby upgrading the current daily pivot to a weekly pivot. Because the current pivot level does not reach the weekly level, the operating time period is not enough, so this wave of rebound will come down again, which is a high probability event. Remember, it is a high probability event to come down again.
It just means that if it falls again in the future, as long as the price does not fall below 24900, it means that the weekly decline may run in the form of central oscillation, as shown by the yellow arrow in the figure above. Of course, if it continues to fall below 24900, we can see a perfect weekly decline, as shown by the blue arrow in the figure above.
If it is a yellow arrow, and the weekly pullback runs in a volatile manner, then the overall trend is indeed an extension of a small bull market. However, in this case, it will be difficult to have a big bull market next year. After reaching 40,000 or 50,000, it will be easy to see a new wave of market plunge.
Daily Line:
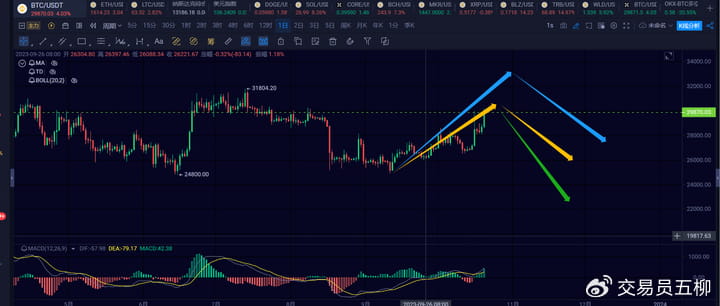
First of all, the daily rebound structure starting from 24900 is perfect, and there is a possibility of callback at any time, but it is not certain whether it will extend further. There are three situations to consider. The first blue arrow, the rebound here can continue to extend upward, breaking 31800, then in this case, at most it will break slightly and then fall again, and should be able to return to around 28000. Why the blue arrow method can't go higher, because the current rebound level is the daily level, not a new weekly level rise.
There is a big difference between a new weekly rebound and a new daily rebound. The weekly rebound lasted from November last year to the highest point in July this year, which took more than 8 months. The current daily rebound started in mid-September and has been running for 39 days. The time is definitely far less than the weekly rebound.
Therefore, the current daily rebound will not last too long.
The second yellow arrow could not break through 31,800, so it turned downward and started a new daily level decline. It should have a chance to reach around 26,000.
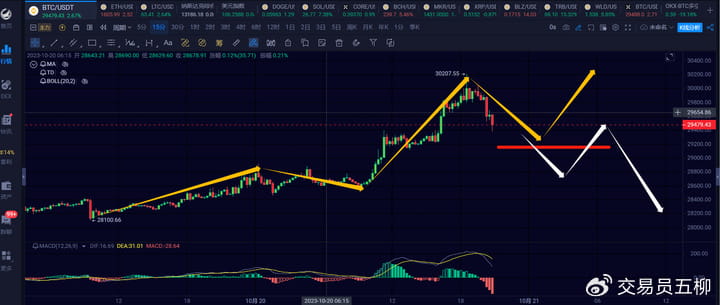
The third green arrow, if it cannot even stand stable around 30,000 for 12 hours, then the next daily decline has a certain probability of falling below 24,900 again.
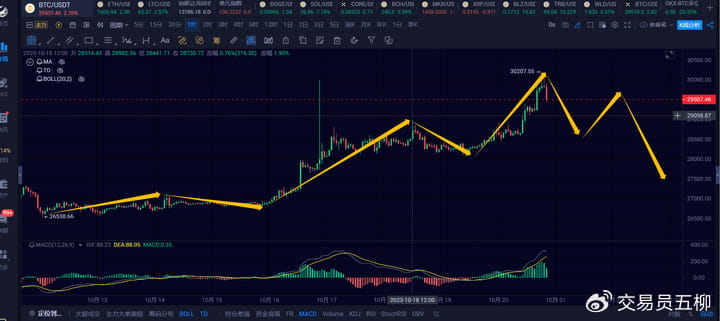
Regarding the blue and yellow arrows, what is the subsequent structure? Draw a picture:
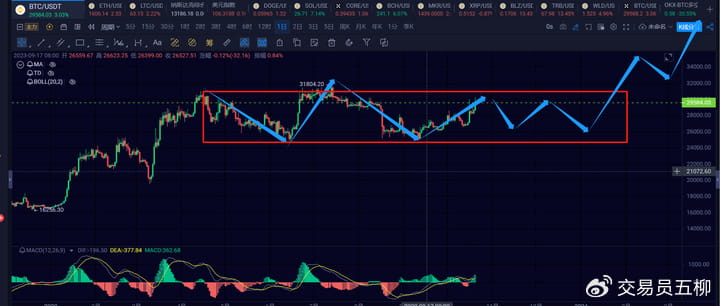
It is probably that the range of 25,000~32,000 will oscillate repeatedly for a few months, and then break through directly upward.
The structure of the green arrow is as follows:
This is the standard weekly level decline that we had expected.
4H:
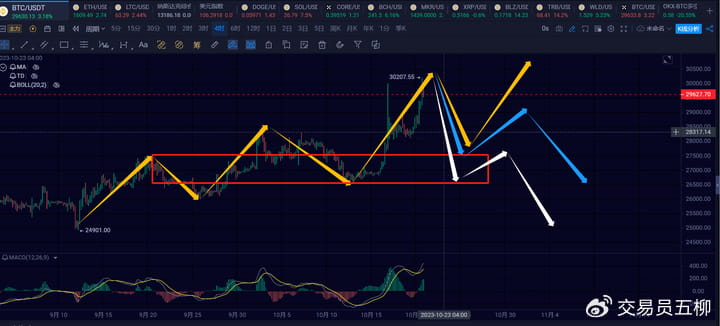
At the 4h level, there have been 5 moves so far. The fifth move at the 4h level will not go up much, and at most it will extend. We will see a 4h level decline in the future. For the 4h level decline, we have a complete classification of 3 situations.
The first one is that the 4h level decline does not break 28000, and a three-buy rebound is made, and a high point is reached again. If the yellow arrow in the above figure.
The second type is that the 4h level decline does not break 27500, and a three-buy is formed, but it is highly likely that it will not pass the previous high point, and then fall again, forming a three-buy-two-sell. As shown by the blue arrow.
The third type is that the 4h level decline directly breaks through 27500, and takes a non-divergent decline, as shown by the white arrow.
We need to wait and see whether the current 4h level rebound has ended. If it falls below 28,700, it is likely to be over.
BTC short term
Due to the rapid changes in the short-term market, the article can only predict the market changes at the moment of publication. Short-term players should pay attention to the latest changes in the market and use it as a reference only.
1H:
We have already had the fifth 1h level rebound. There is a high probability that there will be a 1h level decline. If it breaks 28700, the next 1h level rebound will not be able to reach 30200, forming a 4h level decline.
15M:
At the 15-minute level, there is currently a 15-minute level correction, which is expected to last until at least midnight. If it stays above 29,200, there is a chance to touch 30,200 or above. If it falls below, we will see a decline at the 1h level.
I won’t write Ether for the time being. I had a stomachache last night and had diarrhea. I managed to finish the article.
Trend Direction
Weekly level: The direction is downward, which can be divided into two types: either the weekly line maintains a range of 25,000 to 32,000, or a weekly line declines.
Daily level: The direction is downward. The second daily level rebound has come to an end and will end soon.
4-hour level: The direction is downward, and the fifth 4h-level rebound is about to end. Even if it extends further, it will not last too long.
1 hour level: Downward direction, below 29200, looking for a 1h level decline
15-minute level: Downward direction. Currently, we see a 15-minute level pullback. Stay above 29,200. There is a chance to touch 30,200 again.
