

#educaciongratis
educaciongratis
38 views
2 Discussing
Hot
Latest

·
--
📉 Educational Analysis: Why Do We Take a SHORT on ESPUSDT? 🧠💡
Hello, Community! Today I’m sharing a technical breakdown based on the recent price action of ESPUSDT (Perpetual Contract) on the 5-minute timeframe. Let’s analyze the signals that validated this short trade:
1. Respect for Resistance and False Breakout (Fakeout) 🚫
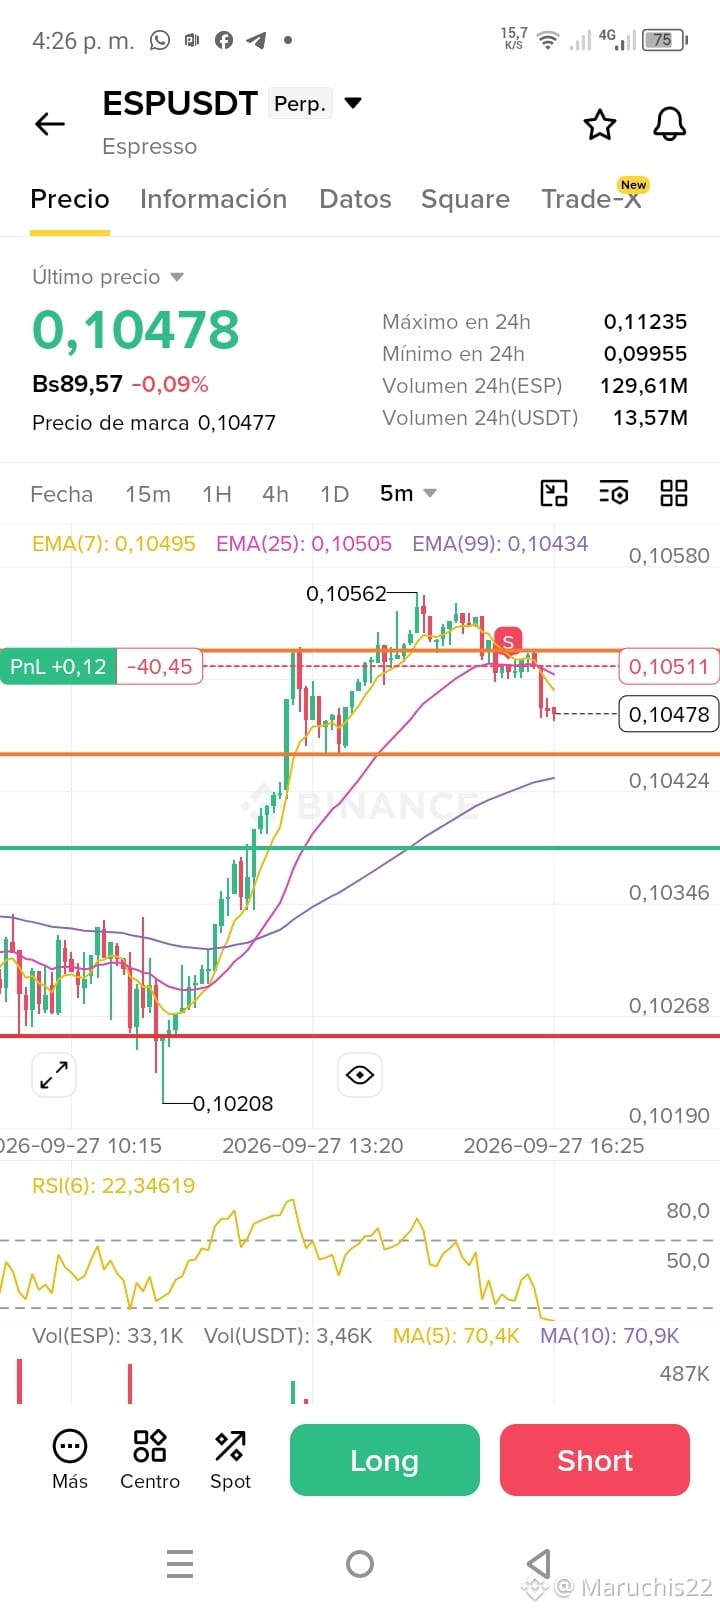
The price had a strong bullish impulse, reaching a local high at 0,10562. However, the 0,10511 area acted as a very strong psychological and structural resistance. Noting that the following candles lost volume and left long upper wicks, it confirmed buyer exhaustion (absorption by the whales).
2. Crossover of Exponential Moving Averages (EMA) 📉
If we look at the chart lines:
The price has broken strongly downward below the EMA(7) (yellow line) and the EMA(25) (purple line).
In the last candle, both EMAs are starting to curve downward above the current price (0,10478), which changes the immediate structure from bullish to bearish in the short term.
3. RSI in Oversold Territory, but with Active Direction 📉
The RSI(6) indicator is currently at 22,34. Even though it’s already in oversold levels, on timeframes as low as 5m, the RSI often stays below while price seeks liquidity in lower supports, such as the EMA(99) (blue line) near 0,10434 or the green-marked support area around 0,10380.
4. Trade Management 🎯
Current entry price: Close to 0,10478 (with PnL already in profit).
First Target (Take Profit): The immediate and institutional support zone at 0,10424 (confluence with the 99-period EMA).
Stop Loss: It must be placed strictly above the last swing high or the resistance at 0,10511 to invalidate the trade if the market regains strength. #Write&Earn #BinanceSquare #educaciongratis
📉 Educational Analysis: Why Do We Take a SHORT on ESPUSDT? 🧠💡
Hello, Community! Today I’m sharing a technical breakdown based on the recent price action of ESPUSDT (Perpetual Contract) on the 5-minute timeframe. Let’s analyze the signals that validated this short trade:
1. Respect for Resistance and False Breakout (Fakeout) 🚫
The price had a strong bullish impulse, reaching a local high at 0,10562. However, the 0,10511 area acted as a very strong psychological and structural resistance. Noting that the following candles lost volume and left long upper wicks, it confirmed buyer exhaustion (absorption by the whales).
2. Crossover of Exponential Moving Averages (EMA) 📉
If we look at the chart lines:
The price has broken strongly downward below the EMA(7) (yellow line) and the EMA(25) (purple line).
In the last candle, both EMAs are starting to curve downward above the current price (0,10478), which changes the immediate structure from bullish to bearish in the short term.
3. RSI in Oversold Territory, but with Active Direction 📉
The RSI(6) indicator is currently at 22,34. Even though it’s already in oversold levels, on timeframes as low as 5m, the RSI often stays below while price seeks liquidity in lower supports, such as the EMA(99) (blue line) near 0,10434 or the green-marked support area around 0,10380.
4. Trade Management 🎯
Current entry price: Close to 0,10478 (with PnL already in profit).
First Target (Take Profit): The immediate and institutional support zone at 0,10424 (confluence with the 99-period EMA).
Stop Loss: It must be placed strictly above the last swing high or the resistance at 0,10511 to invalidate the trade if the market regains strength. #Write&Earn #BinanceSquare #educaciongratis
Hello, Community! Today I’m sharing a technical breakdown based on the recent price action of ESPUSDT (Perpetual Contract) on the 5-minute timeframe. Let’s analyze the signals that validated this short trade:
1. Respect for Resistance and False Breakout (Fakeout) 🚫
The price had a strong bullish impulse, reaching a local high at 0,10562. However, the 0,10511 area acted as a very strong psychological and structural resistance. Noting that the following candles lost volume and left long upper wicks, it confirmed buyer exhaustion (absorption by the whales).
2. Crossover of Exponential Moving Averages (EMA) 📉
If we look at the chart lines:
The price has broken strongly downward below the EMA(7) (yellow line) and the EMA(25) (purple line).
In the last candle, both EMAs are starting to curve downward above the current price (0,10478), which changes the immediate structure from bullish to bearish in the short term.
3. RSI in Oversold Territory, but with Active Direction 📉
The RSI(6) indicator is currently at 22,34. Even though it’s already in oversold levels, on timeframes as low as 5m, the RSI often stays below while price seeks liquidity in lower supports, such as the EMA(99) (blue line) near 0,10434 or the green-marked support area around 0,10380.
4. Trade Management 🎯
Current entry price: Close to 0,10478 (with PnL already in profit).
First Target (Take Profit): The immediate and institutional support zone at 0,10424 (confluence with the 99-period EMA).
Stop Loss: It must be placed strictly above the last swing high or the resistance at 0,10511 to invalidate the trade if the market regains strength. #Write&Earn #BinanceSquare #educaciongratis
112
Log in to explore more content
Join global crypto users on Binance Square
⚡️ Get latest and useful information about crypto.
💬 Trusted by the world’s largest crypto exchange.
👍 Discover real insights from verified creators.
Email / Phone number
Trending Topics
1
#GoldFallsTo$4144
400 views
18 Discussing
2
#QNTFallsOver40%FromMorningHigh
563 views
99 Discussing
3
#BitgetCEOConfirms$388MStolenInHack
14 views
12 Discussing
4
#BTCFallsBelow$83000
6,296 views
87 Discussing
5
#BitgetDetailsSecurityIncidentTimeline
2,285 views
142 Discussing
6
#BitcoinSpotETFs$2.39BWeeklyNetInflow
1,214 views
17 Discussing
7
#FedProposesPaymentStablecoinRules
24,307 views
505 Discussing
8
#ChinaMayLetAlibabaByteDanceBuyNvidiaChips
27,931 views
540 Discussing
9
#USChinaRelease$30BTariffCutProductLists
3,094 views
49 Discussing
10
#SKoreaFSCConsidersVirtualAssetMarketMaker
16,395 views
389 Discussing