

#binancedata
binancedata
7,657 views
44 Discussing
Hot
Latest

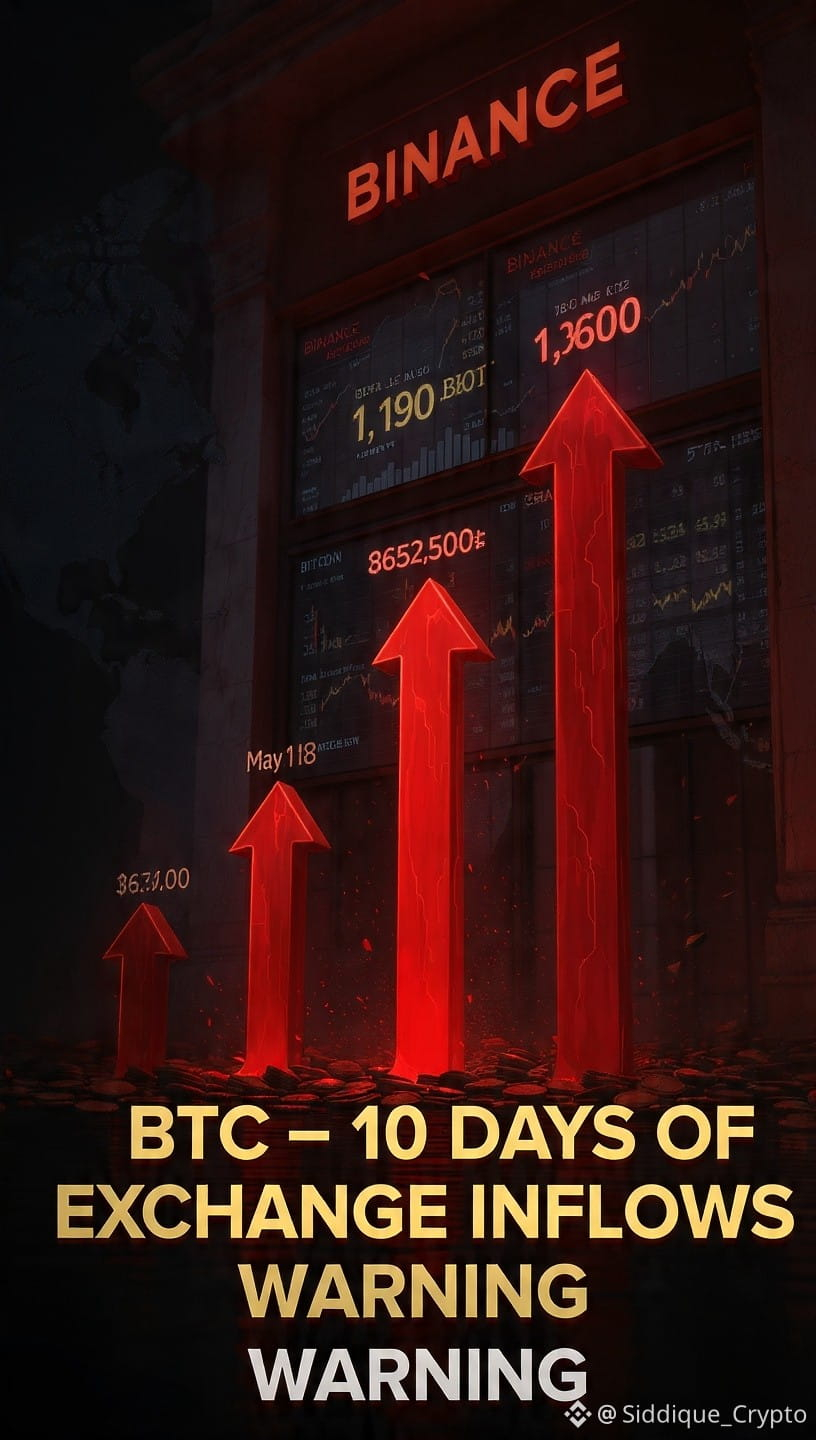
$BTC — 10 Days of Continuous Binance Inflows — What This Means 👀📊
One important on-chain signal has been building quietly for nearly 10 consecutive days — and it deserves serious attention.
The Data:
📊 May 16 weekly average inflows: 378 BTC
📈 Today weekly average: 1,190 BTC
🔺 Increase: more than 3x in less than 10 days
🔴 Single day record — May 18: 3,600+ BTC
📊 Binance BTC reserves: 616,000 → 632,000 BTC
📈 Increase of 16,000 BTC in one month
Why this matters:
⚠️ When BTC moves TO exchanges — holders usually intend to sell
📉 Consistent inflows = potential sell side pressure building
🔴 More BTC available on exchange = more supply for selling
Three reasons holders send BTC to exchange:
1️⃣ Taking profits
2️⃣ Reducing exposure due to uncertainty
3️⃣ Defensive repositioning during macro stress
The macro context:
🌍 Geopolitical tensions affecting global economies
📉 Risk assets under pressure worldwide
📊 BTC printed -6.2% performance over this same period
⚠️ Difficult environment for all risk assets right now
The honest interpretation:
Dominant and consistent exchange inflows have historically preceded price weakness. This does not guarantee further decline — but it is a signal worth monitoring carefully. 🧠
Watch Binance reserve data closely this week. 👀
DYOR — Not financial advice! 🙏
#Bitcoin❗ #BTC☀️ #OnChainData #BINANCEDATA #dyor
$BTC — 10 Days of Continuous Binance Inflows — What This Means 👀📊
One important on-chain signal has been building quietly for nearly 10 consecutive days — and it deserves serious attention.
The Data:
📊 May 16 weekly average inflows: 378 BTC
📈 Today weekly average: 1,190 BTC
🔺 Increase: more than 3x in less than 10 days
🔴 Single day record — May 18: 3,600+ BTC
📊 Binance BTC reserves: 616,000 → 632,000 BTC
📈 Increase of 16,000 BTC in one month
Why this matters:
⚠️ When BTC moves TO exchanges — holders usually intend to sell
📉 Consistent inflows = potential sell side pressure building
🔴 More BTC available on exchange = more supply for selling
Three reasons holders send BTC to exchange:
1️⃣ Taking profits
2️⃣ Reducing exposure due to uncertainty
3️⃣ Defensive repositioning during macro stress
The macro context:
🌍 Geopolitical tensions affecting global economies
📉 Risk assets under pressure worldwide
📊 BTC printed -6.2% performance over this same period
⚠️ Difficult environment for all risk assets right now
The honest interpretation:
Dominant and consistent exchange inflows have historically preceded price weakness. This does not guarantee further decline — but it is a signal worth monitoring carefully. 🧠
Watch Binance reserve data closely this week. 👀
DYOR — Not financial advice! 🙏
#Bitcoin❗ #BTC☀️ #OnChainData #BINANCEDATA #dyor
One important on-chain signal has been building quietly for nearly 10 consecutive days — and it deserves serious attention.
The Data:
📊 May 16 weekly average inflows: 378 BTC
📈 Today weekly average: 1,190 BTC
🔺 Increase: more than 3x in less than 10 days
🔴 Single day record — May 18: 3,600+ BTC
📊 Binance BTC reserves: 616,000 → 632,000 BTC
📈 Increase of 16,000 BTC in one month
Why this matters:
⚠️ When BTC moves TO exchanges — holders usually intend to sell
📉 Consistent inflows = potential sell side pressure building
🔴 More BTC available on exchange = more supply for selling
Three reasons holders send BTC to exchange:
1️⃣ Taking profits
2️⃣ Reducing exposure due to uncertainty
3️⃣ Defensive repositioning during macro stress
The macro context:
🌍 Geopolitical tensions affecting global economies
📉 Risk assets under pressure worldwide
📊 BTC printed -6.2% performance over this same period
⚠️ Difficult environment for all risk assets right now
The honest interpretation:
Dominant and consistent exchange inflows have historically preceded price weakness. This does not guarantee further decline — but it is a signal worth monitoring carefully. 🧠
Watch Binance reserve data closely this week. 👀
DYOR — Not financial advice! 🙏
#Bitcoin❗ #BTC☀️ #OnChainData #BINANCEDATA #dyor
84

·
--
Article
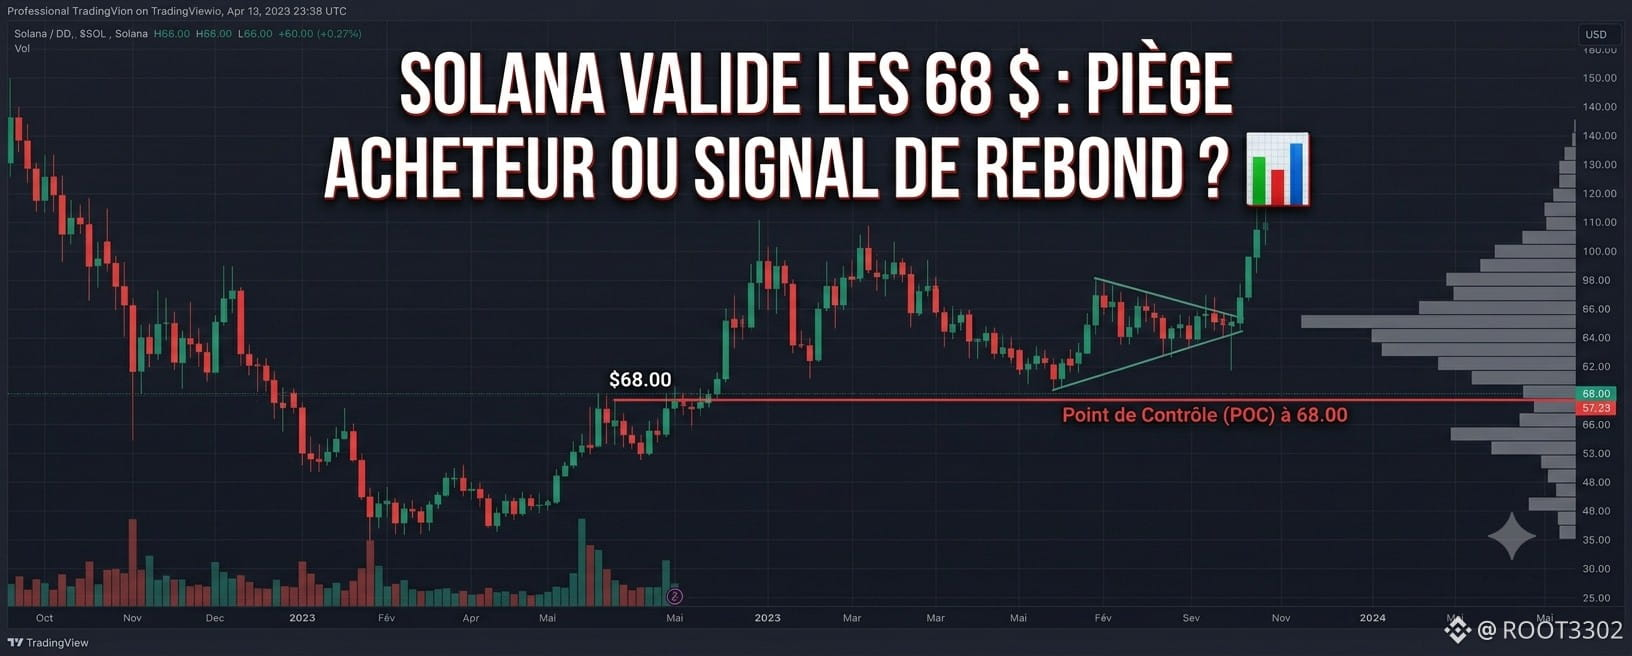
🎯 ZOOM ALTCOINS: Solana holds its pivot level amid declining volumes on Binance.The pair $SOL is currently trading at $68.18 on Binance after experiencing a moderate dip in volatility over the last 24 hours.
Let's validate the exact chart levels to display your trading charts:
1) Support defense: The day's low hit the $67.98 zone before triggering an immediate bounce caused by the activation of programmed buy orders.
2) Trend resistance: To break the bearish Daily trend that started in early June, Solana needs to clear the resistance at $68.84. This is the precise level where the largest block of sell orders in the Binance order book is concentrated.
🎯 ZOOM ALTCOINS: Solana holds its pivot level amid declining volumes on Binance.
The pair $SOL is currently trading at $68.18 on Binance after experiencing a moderate dip in volatility over the last 24 hours.
Let's validate the exact chart levels to display your trading charts:
1) Support defense: The day's low hit the $67.98 zone before triggering an immediate bounce caused by the activation of programmed buy orders.
2) Trend resistance: To break the bearish Daily trend that started in early June, Solana needs to clear the resistance at $68.84. This is the precise level where the largest block of sell orders in the Binance order book is concentrated.
Let's validate the exact chart levels to display your trading charts:
1) Support defense: The day's low hit the $67.98 zone before triggering an immediate bounce caused by the activation of programmed buy orders.
2) Trend resistance: To break the bearish Daily trend that started in early June, Solana needs to clear the resistance at $68.84. This is the precise level where the largest block of sell orders in the Binance order book is concentrated.
159


Article
The Outperformer StrategyThe Outperformer Alpha: What Multi-Asset Managers Do When Major Caps Take a Break 📊🚀
When Bitcoin and major caps move in a tight, choppy range, amateur traders get bored and step away. But seasoned professionals know this is exactly when the "Alpha Hunt" begins.
Today’s market data proves it perfectly. While major blue-chips are trading mixed, specific high-utility mid-cap assets like SKL (+65%) and KAT (+32%) have gone completely vertical.
How to play these micro-cycles:
Follow the Volume: Capital doesn't leave the market during consolidation; it simply rotates into ecosystems that have massive active usage and upcoming catalysts.Avoid Chasing Green Candles: The goal isn't to buy something after it pumps 60%. The goal is to study ecosystem metrics early so you can position yourself before the volume shifts.
Don't look for action in the same old charts every day. Diversify your research and find where the quiet volume is building. 🔍📈
Click Here to Check the Live Market Update: [https://www.binance.com/en/markets](https://www.binance.com/en/markets)
#MarketRotation #CryptoAlpha #TradingStrategy #MidCapGains #BinanceData
The Outperformer Strategy
The Outperformer Alpha: What Multi-Asset Managers Do When Major Caps Take a Break 📊🚀
When Bitcoin and major caps move in a tight, choppy range, amateur traders get bored and step away. But seasoned professionals know this is exactly when the "Alpha Hunt" begins.
Today’s market data proves it perfectly. While major blue-chips are trading mixed, specific high-utility mid-cap assets like SKL (+65%) and KAT (+32%) have gone completely vertical.
How to play these micro-cycles:
Follow the Volume: Capital doesn't leave the market during consolidation; it simply rotates into ecosystems that have massive active usage and upcoming catalysts.Avoid Chasing Green Candles: The goal isn't to buy something after it pumps 60%. The goal is to study ecosystem metrics early so you can position yourself before the volume shifts.
Don't look for action in the same old charts every day. Diversify your research and find where the quiet volume is building. 🔍📈
Click Here to Check the Live Market Update: https://www.binance.com/en/markets
#MarketRotation #CryptoAlpha #TradingStrategy #MidCapGains #BinanceData
When Bitcoin and major caps move in a tight, choppy range, amateur traders get bored and step away. But seasoned professionals know this is exactly when the "Alpha Hunt" begins.
Today’s market data proves it perfectly. While major blue-chips are trading mixed, specific high-utility mid-cap assets like SKL (+65%) and KAT (+32%) have gone completely vertical.
How to play these micro-cycles:
Follow the Volume: Capital doesn't leave the market during consolidation; it simply rotates into ecosystems that have massive active usage and upcoming catalysts.Avoid Chasing Green Candles: The goal isn't to buy something after it pumps 60%. The goal is to study ecosystem metrics early so you can position yourself before the volume shifts.
Don't look for action in the same old charts every day. Diversify your research and find where the quiet volume is building. 🔍📈
Click Here to Check the Live Market Update: https://www.binance.com/en/markets
#MarketRotation #CryptoAlpha #TradingStrategy #MidCapGains #BinanceData
209


·
--
Discuss transparency and metrics for ZKC through Binance.
@boundless_network
As ZKC has listings and publicly accessible data through CoinMarketCap and others, users on Binance can use real numbers: circulating supply (~200.94 M at launch), inflation model, contract address, trading pairs.
Having tokenomics and protocol whitepaper easily available for Binance users you're not left in the dark. You can track unlock schedules, staking/collateral lock-ups, token distribution. For $ZKC the first circulating supply was ~20% of the 1 billion genesis supply.
Such transparency enables better-informed decision-making — and not just on sentiment trading. With infrastructure tokens such as ZKC, the metrics do come into play. On Binance you can observe order book data, volume trends, unlock schedules, staking dashboards (where available) and make your decisions accordingly.
#ZKC #Transparency #Boundless #BinanceData #InfrastructureToken
Discuss transparency and metrics for ZKC through Binance.
@boundless_network
As ZKC has listings and publicly accessible data through CoinMarketCap and others, users on Binance can use real numbers: circulating supply (~200.94 M at launch), inflation model, contract address, trading pairs.
Having tokenomics and protocol whitepaper easily available for Binance users you're not left in the dark. You can track unlock schedules, staking/collateral lock-ups, token distribution. For $ZKC the first circulating supply was ~20% of the 1 billion genesis supply.
Such transparency enables better-informed decision-making — and not just on sentiment trading. With infrastructure tokens such as ZKC, the metrics do come into play. On Binance you can observe order book data, volume trends, unlock schedules, staking dashboards (where available) and make your decisions accordingly.
#ZKC #Transparency #Boundless #BinanceData #InfrastructureToken
@boundless_network
As ZKC has listings and publicly accessible data through CoinMarketCap and others, users on Binance can use real numbers: circulating supply (~200.94 M at launch), inflation model, contract address, trading pairs.
Having tokenomics and protocol whitepaper easily available for Binance users you're not left in the dark. You can track unlock schedules, staking/collateral lock-ups, token distribution. For $ZKC the first circulating supply was ~20% of the 1 billion genesis supply.
Such transparency enables better-informed decision-making — and not just on sentiment trading. With infrastructure tokens such as ZKC, the metrics do come into play. On Binance you can observe order book data, volume trends, unlock schedules, staking dashboards (where available) and make your decisions accordingly.
#ZKC #Transparency #Boundless #BinanceData #InfrastructureToken
3
29

·
--
Bearish
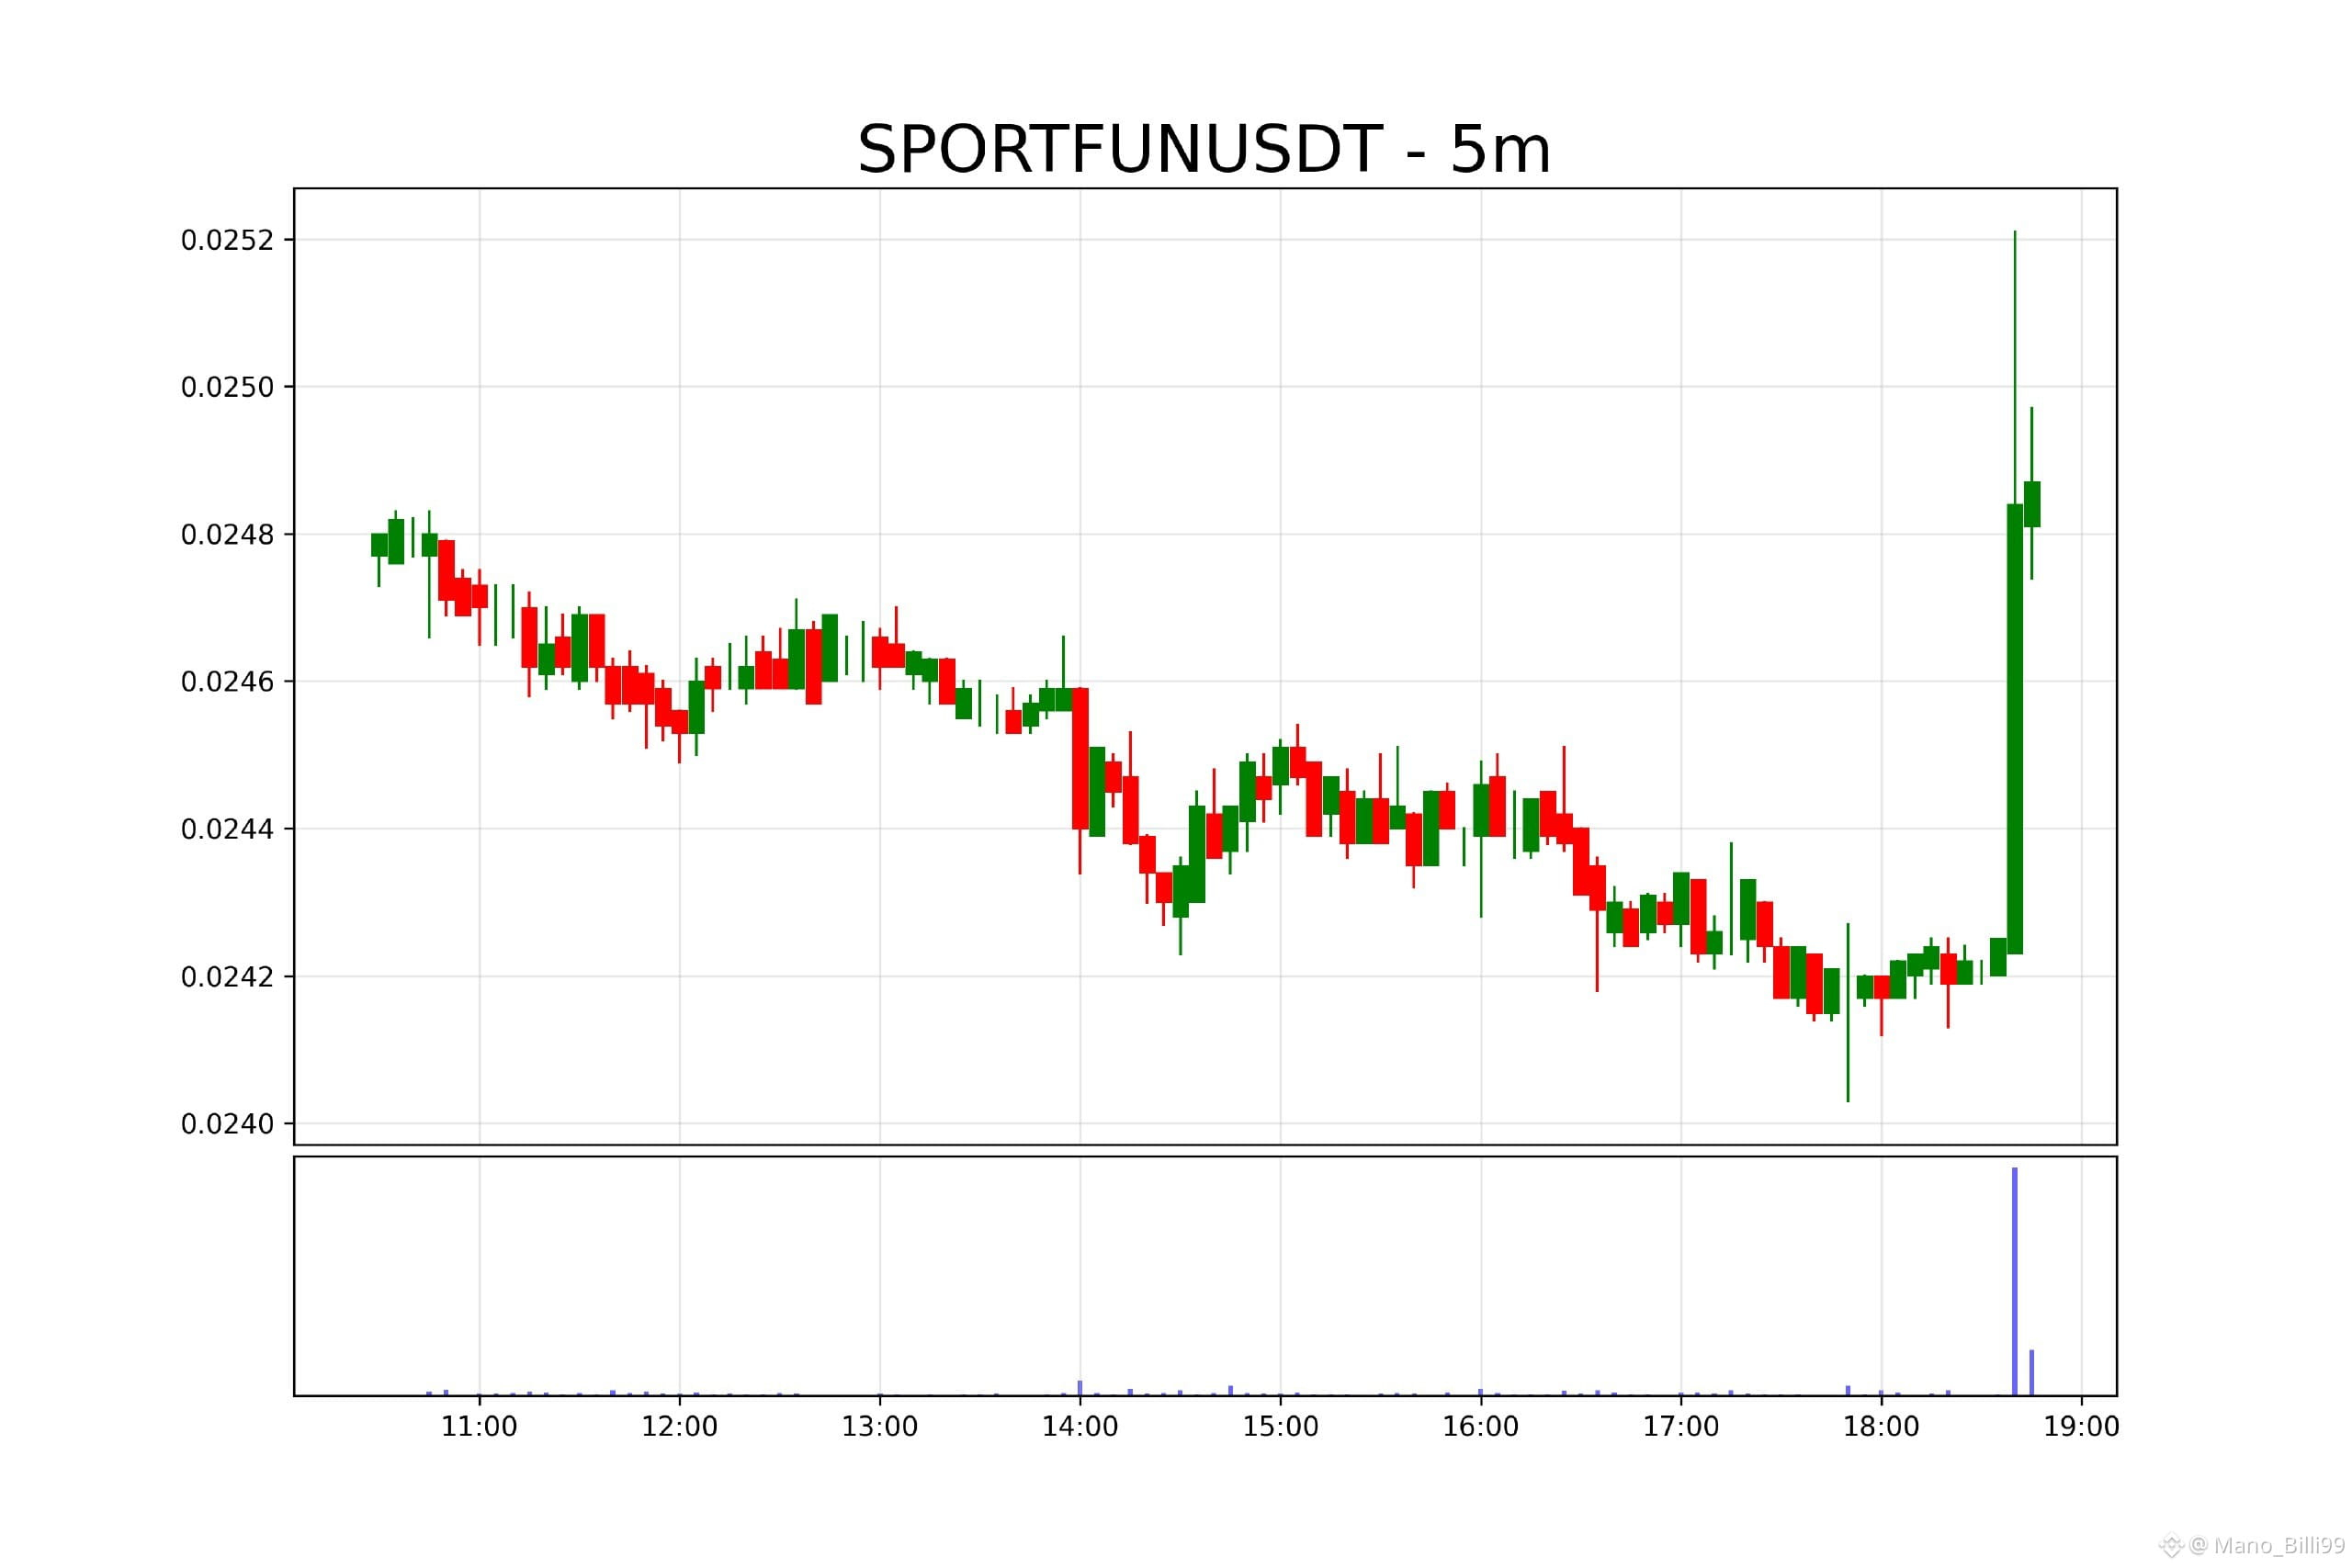
SPORTFUNUSDT is showing a massive anomaly in the markets. While the price is up 2.4% on the latest check, it is still down 4.6% over the last 24 hours. The real story here is the volume, which has absolutely exploded by 7362.6% to reach 717.58K. This kind of extreme volume spike despite a negative daily trend usually points to intense accumulation or a major liquidity shift happening behind the scenes. Price is currently at 0.02482. Keep a close watch on this pair, as such rapid changes in participation often trigger sudden, sharp movements in either direction. Be ready for high volatility.
$SPORTFUN
{future}(SPORTFUNUSDT)
#SPORTFUN #CryptoMarketAlert #BINANCEDATA #VolumeAnomaly #ActiveTrading
SPORTFUNUSDT is showing a massive anomaly in the markets. While the price is up 2.4% on the latest check, it is still down 4.6% over the last 24 hours. The real story here is the volume, which has absolutely exploded by 7362.6% to reach 717.58K. This kind of extreme volume spike despite a negative daily trend usually points to intense accumulation or a major liquidity shift happening behind the scenes. Price is currently at 0.02482. Keep a close watch on this pair, as such rapid changes in participation often trigger sudden, sharp movements in either direction. Be ready for high volatility.
$SPORTFUN
#SPORTFUN #CryptoMarketAlert #BINANCEDATA #VolumeAnomaly #ActiveTrading
$SPORTFUN
#SPORTFUN #CryptoMarketAlert #BINANCEDATA #VolumeAnomaly #ActiveTrading
222

BEAT, CAP & BTW: A Real-Time Market Snapshot Traders Should Watch
BEAT, CAP, and BTW are each showing very different market profiles right now, which makes them interesting to track from both a momentum and risk-management perspective. As of the latest live Binance data, CAP is trading around $0.057 with a market cap near $89M and roughly $144.5M in 24-hour volume, suggesting strong turnover relative to its size and elevated short-term attention.
BTW is currently trading around $0.242 on Binance price data, with a market cap near $654.5M and about $23.9M in 24-hour volume. Binance Futures data also shows BTWUSDT Perpetual among notable movers, which indicates rising speculative interest and stronger trader participation in derivatives alongside spot visibility.
BEAT is the most unusual of the three. On Binance’s token price page, BEAT shows no meaningful spot market cap and zero 24-hour spot volume, while Binance Futures lists BEATUSDT Perpetual, implying that current tradable interest may be more visible through derivatives than through active spot market depth. That makes BEAT a higher-uncertainty name where traders should pay extra attention to liquidity, spread behavior, and execution risk rather than price alone.
From a market-structure perspective, CAP looks like the strongest volume-driven momentum candidate, BTW looks more balanced with both market-cap scale and active trading attention, and BEAT appears more speculative due to thinner spot confirmation. That does not guarantee any future outcome, but it does highlight where liquidity and participation are currently concentrated. As always, short-term price action can change quickly, and historical or current momentum should not be treated as a prediction of what happens next.
#CryptoMarket #BinanceData #BEAT #CAP #BTW
Trade here 👇👇👇
$BEAT
{future}(BEATUSDT)
$CAP
{future}(CAPUSDT)
$BTW
{future}(BTWUSDT)
BEAT, CAP & BTW: A Real-Time Market Snapshot Traders Should Watch
BEAT, CAP, and BTW are each showing very different market profiles right now, which makes them interesting to track from both a momentum and risk-management perspective. As of the latest live Binance data, CAP is trading around $0.057 with a market cap near $89M and roughly $144.5M in 24-hour volume, suggesting strong turnover relative to its size and elevated short-term attention.
BTW is currently trading around $0.242 on Binance price data, with a market cap near $654.5M and about $23.9M in 24-hour volume. Binance Futures data also shows BTWUSDT Perpetual among notable movers, which indicates rising speculative interest and stronger trader participation in derivatives alongside spot visibility.
BEAT is the most unusual of the three. On Binance’s token price page, BEAT shows no meaningful spot market cap and zero 24-hour spot volume, while Binance Futures lists BEATUSDT Perpetual, implying that current tradable interest may be more visible through derivatives than through active spot market depth. That makes BEAT a higher-uncertainty name where traders should pay extra attention to liquidity, spread behavior, and execution risk rather than price alone.
From a market-structure perspective, CAP looks like the strongest volume-driven momentum candidate, BTW looks more balanced with both market-cap scale and active trading attention, and BEAT appears more speculative due to thinner spot confirmation. That does not guarantee any future outcome, but it does highlight where liquidity and participation are currently concentrated. As always, short-term price action can change quickly, and historical or current momentum should not be treated as a prediction of what happens next.
#CryptoMarket #BinanceData #BEAT #CAP #BTW
Trade here 👇👇👇
$BEAT
$CAP
$BTW
BEAT, CAP, and BTW are each showing very different market profiles right now, which makes them interesting to track from both a momentum and risk-management perspective. As of the latest live Binance data, CAP is trading around $0.057 with a market cap near $89M and roughly $144.5M in 24-hour volume, suggesting strong turnover relative to its size and elevated short-term attention.
BTW is currently trading around $0.242 on Binance price data, with a market cap near $654.5M and about $23.9M in 24-hour volume. Binance Futures data also shows BTWUSDT Perpetual among notable movers, which indicates rising speculative interest and stronger trader participation in derivatives alongside spot visibility.
BEAT is the most unusual of the three. On Binance’s token price page, BEAT shows no meaningful spot market cap and zero 24-hour spot volume, while Binance Futures lists BEATUSDT Perpetual, implying that current tradable interest may be more visible through derivatives than through active spot market depth. That makes BEAT a higher-uncertainty name where traders should pay extra attention to liquidity, spread behavior, and execution risk rather than price alone.
From a market-structure perspective, CAP looks like the strongest volume-driven momentum candidate, BTW looks more balanced with both market-cap scale and active trading attention, and BEAT appears more speculative due to thinner spot confirmation. That does not guarantee any future outcome, but it does highlight where liquidity and participation are currently concentrated. As always, short-term price action can change quickly, and historical or current momentum should not be treated as a prediction of what happens next.
#CryptoMarket #BinanceData #BEAT #CAP #BTW
Trade here 👇👇👇
$BEAT
$CAP
$BTW
228
Log in to explore more content
Join global crypto users on Binance Square
⚡️ Get latest and useful information about crypto.
💬 Trusted by the world’s largest crypto exchange.
👍 Discover real insights from verified creators.
Email / Phone number
Trending Topics
1
#UKFCAWinsCourtOrderToRecover851400Pounds
38,599 views
824 Discussing
2
#ChainlinkLaunchesCCIP2WithEnterpriseVerification
50,791 views
992 Discussing
3
#GoldFallsTo$4144
17,260 views
167 Discussing
4
#QNTFallsOver40%FromMorningHigh
98,373 views
1,386 Discussing
5
#USDTAdds845900HoldersInPast7Days
21,831 views
444 Discussing
6
#KospiFalls2.7%SamsungSKHynixDropOver5%
34,330 views
614 Discussing
7
#BitgetCEOConfirms$388MStolenInHack
5,653 views
43 Discussing
8
#BTCFallsBelow$83000
35,173 views
170 Discussing
9
#BitgetDetailsSecurityIncidentTimeline
56,070 views
763 Discussing
10
#BitcoinSpotETFs$2.39BWeeklyNetInflow
16,544 views
49 Discussing