
#ltcpriceprediction
ltcpriceprediction
639,516 views
957 Discussing
Hot
Latest

·
--
Bearish
SHORT signal $LTC
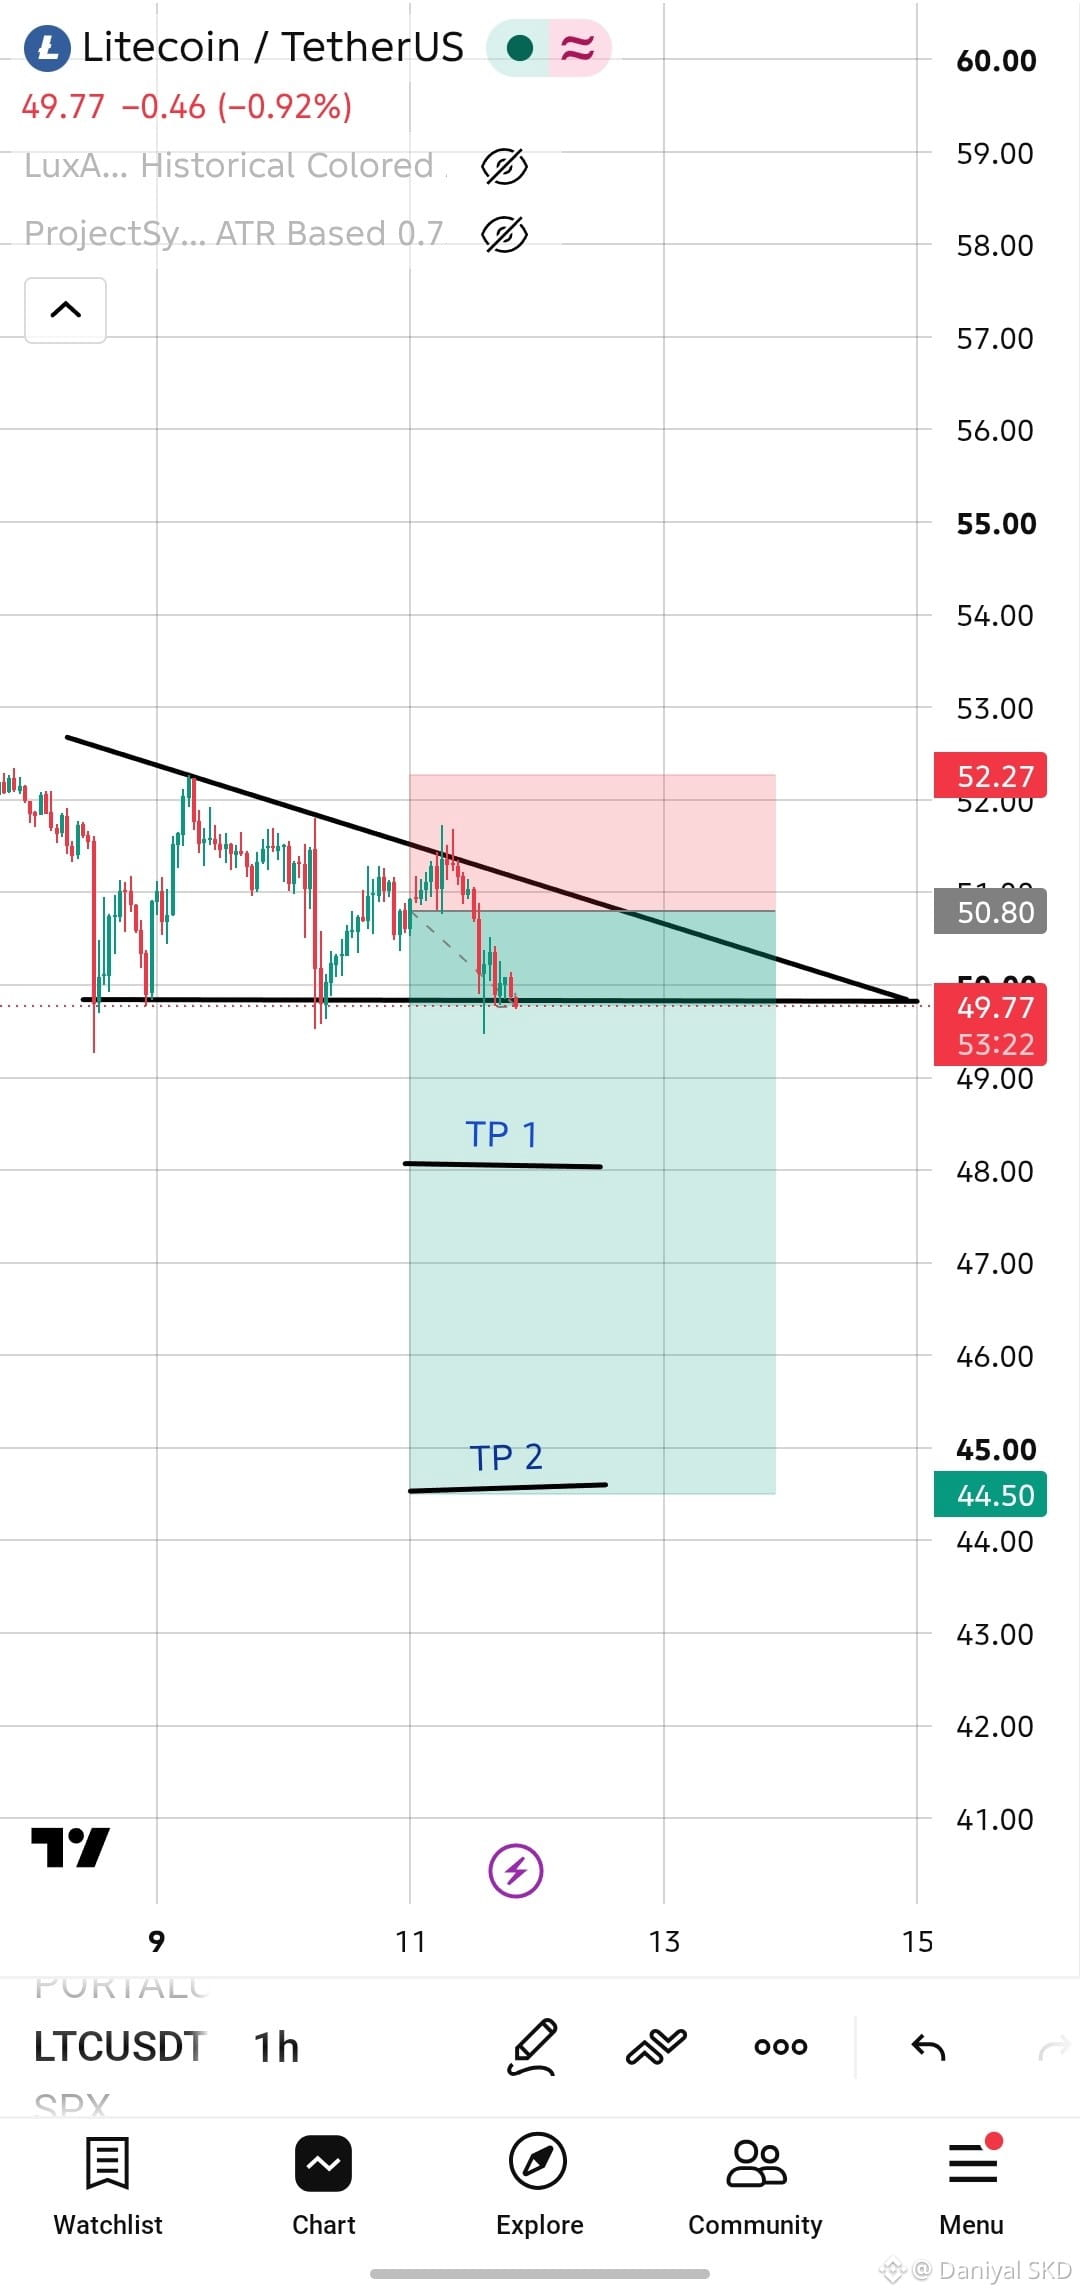
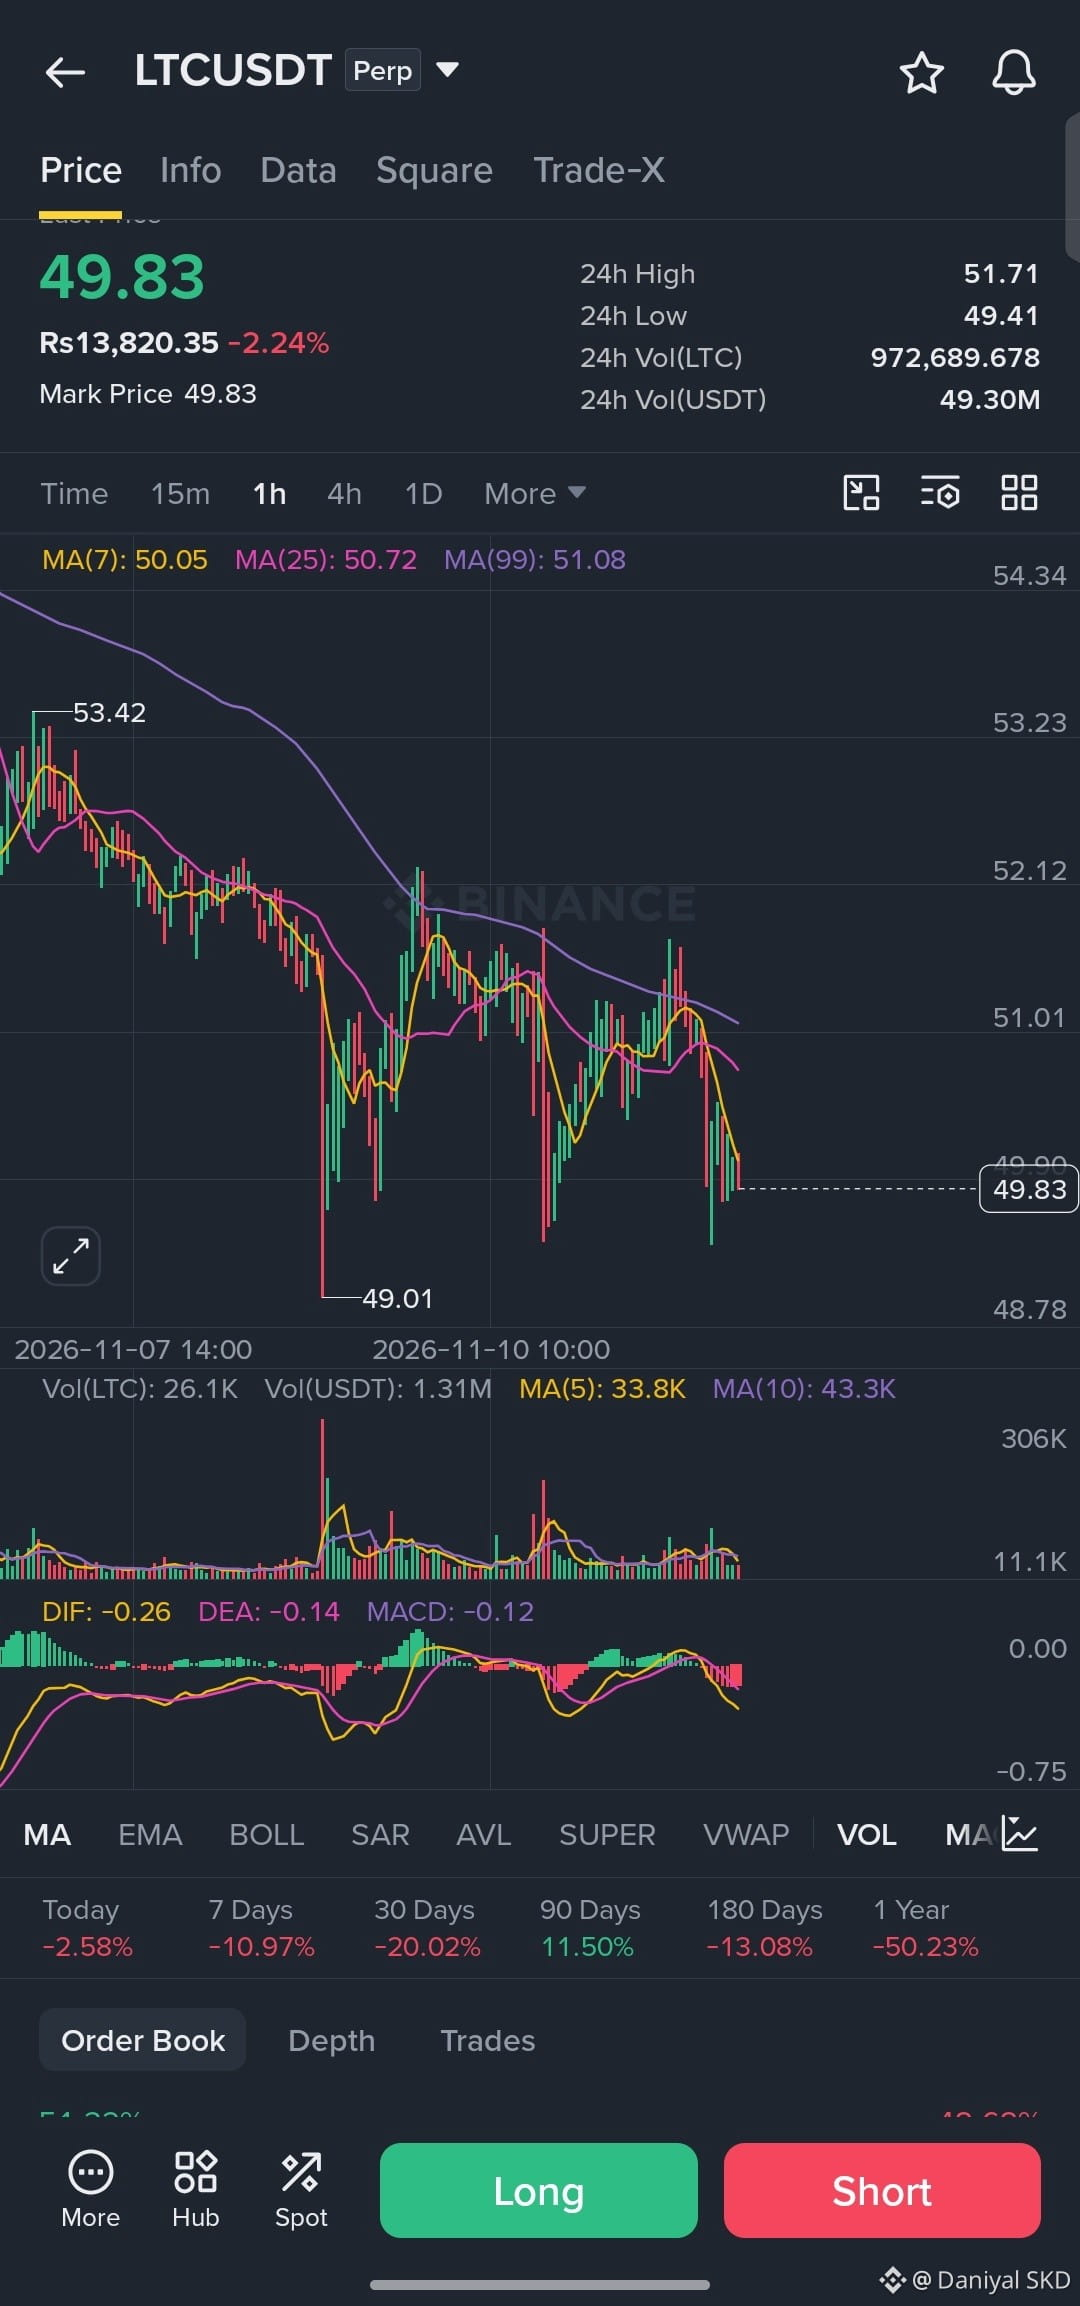
according to my analysis the $LTC goes down in the level of 50 so everyone can short position in this coin and make some profit 👍 👍 💯 😉
ENTRY: 49.70 to 50.80
SL: 52.3
TP 1:48
TP 2:44.5
{spot}(LTCUSDT)
#LTCPricePrediction #DumpPrice #TradeSignal
SHORT signal $LTC
according to my analysis the $LTC goes down in the level of 50 so everyone can short position in this coin and make some profit 👍 👍 💯 😉
ENTRY: 49.70 to 50.80
SL: 52.3
TP 1:48
TP 2:44.5
#LTCPricePrediction #DumpPrice #TradeSignal
according to my analysis the $LTC goes down in the level of 50 so everyone can short position in this coin and make some profit 👍 👍 💯 😉
ENTRY: 49.70 to 50.80
SL: 52.3
TP 1:48
TP 2:44.5
#LTCPricePrediction #DumpPrice #TradeSignal
1
687

·
--
$LTC is navigating a challenging technical landscape, characterized by a short-term bearish trend. After experiencing a significant correction through late summer and early autumn, the price is currently consolidated near a multi-month demand zone around $53.77.
Market Outlook: Sellers Retain Control
The immediate technical setup favors the bears, as LTC is trading strictly below its flattening 50-day and 200-day Exponential Moving Averages (EMAs).
Crucial Defense Zone: A breakout below the $53.77 support line would invalidate the current base case and could trigger a liquidation event, targeting the next macro support around $47.56.
Bulls’ Roadblock: The $58.59 level (the current position of the downward-sloping 50-day EMA) serves as initial strong resistance. The trend will only pivot constructively on a decisive daily candle close above $65.74, which would reclaim key structural liquidity.
Neutral Momentum Indicators: While the primary trend is down, short-term indicators such as the daily Relative Strength Index (RSI) are hovering near 37.06, signaling neutral-to-bearish momentum. It is not yet oversold, indicating that further downside capacity remains
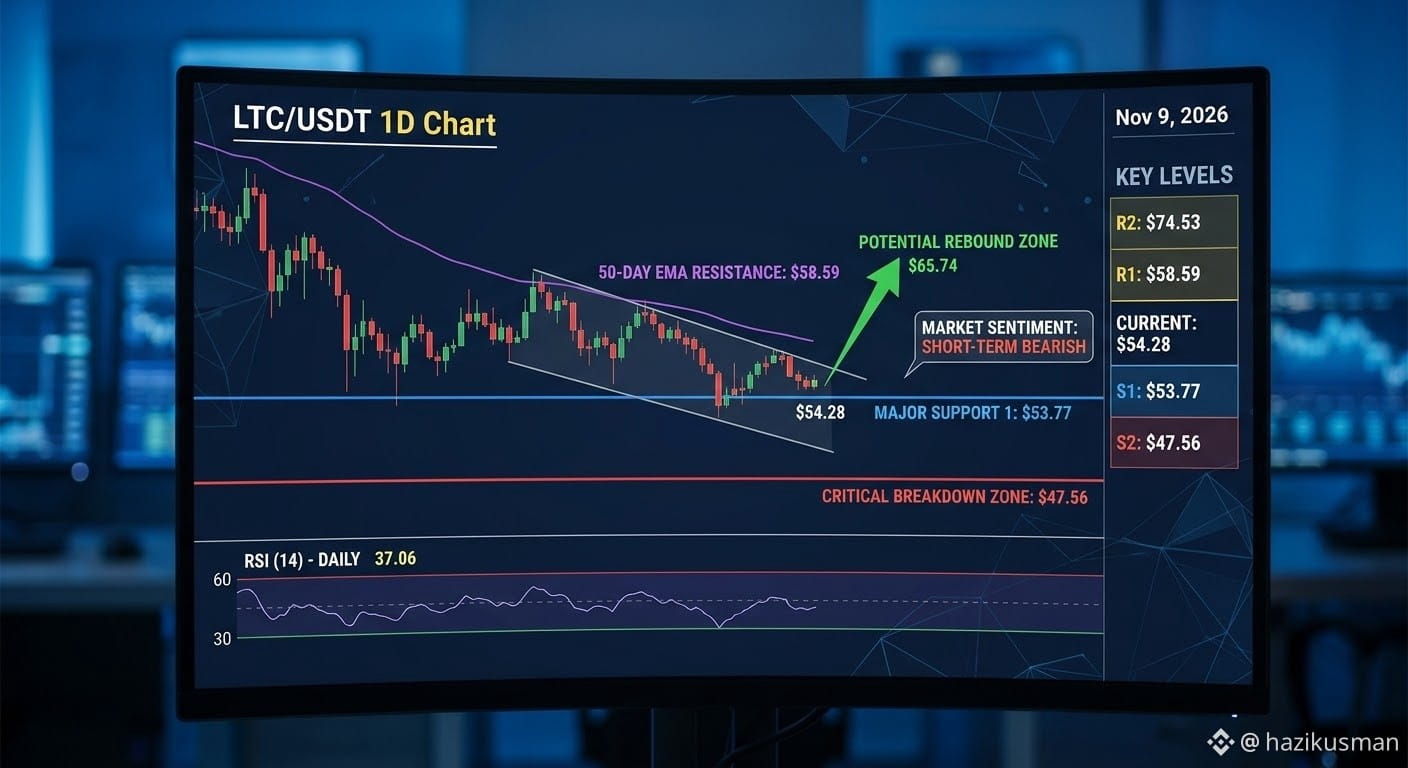
The infographic below captures the key technical dynamics discussed. It visualizes the current descending channel, highlighting how the price is testing the major demand zone at $53.77. It distinctly maps the primary barriers (50-EMA) and the multi-month support areas that frame the current market bias.
#AIChipSlumpNasdaq #earn_crypto #Earncommissions #LTCPricePrediction
$LTC is navigating a challenging technical landscape, characterized by a short-term bearish trend. After experiencing a significant correction through late summer and early autumn, the price is currently consolidated near a multi-month demand zone around $53.77.
Market Outlook: Sellers Retain Control
The immediate technical setup favors the bears, as LTC is trading strictly below its flattening 50-day and 200-day Exponential Moving Averages (EMAs).
Crucial Defense Zone: A breakout below the $53.77 support line would invalidate the current base case and could trigger a liquidation event, targeting the next macro support around $47.56.
Bulls’ Roadblock: The $58.59 level (the current position of the downward-sloping 50-day EMA) serves as initial strong resistance. The trend will only pivot constructively on a decisive daily candle close above $65.74, which would reclaim key structural liquidity.
Neutral Momentum Indicators: While the primary trend is down, short-term indicators such as the daily Relative Strength Index (RSI) are hovering near 37.06, signaling neutral-to-bearish momentum. It is not yet oversold, indicating that further downside capacity remains
The infographic below captures the key technical dynamics discussed. It visualizes the current descending channel, highlighting how the price is testing the major demand zone at $53.77. It distinctly maps the primary barriers (50-EMA) and the multi-month support areas that frame the current market bias.
#AIChipSlumpNasdaq #earn_crypto #Earncommissions #LTCPricePrediction
Market Outlook: Sellers Retain Control
The immediate technical setup favors the bears, as LTC is trading strictly below its flattening 50-day and 200-day Exponential Moving Averages (EMAs).
Crucial Defense Zone: A breakout below the $53.77 support line would invalidate the current base case and could trigger a liquidation event, targeting the next macro support around $47.56.
Bulls’ Roadblock: The $58.59 level (the current position of the downward-sloping 50-day EMA) serves as initial strong resistance. The trend will only pivot constructively on a decisive daily candle close above $65.74, which would reclaim key structural liquidity.
Neutral Momentum Indicators: While the primary trend is down, short-term indicators such as the daily Relative Strength Index (RSI) are hovering near 37.06, signaling neutral-to-bearish momentum. It is not yet oversold, indicating that further downside capacity remains
The infographic below captures the key technical dynamics discussed. It visualizes the current descending channel, highlighting how the price is testing the major demand zone at $53.77. It distinctly maps the primary barriers (50-EMA) and the multi-month support areas that frame the current market bias.
#AIChipSlumpNasdaq #earn_crypto #Earncommissions #LTCPricePrediction
1
52

·
--

Article
LTC on the rise - Litecoin today, November 4, 2026Price now: $54.60 - $55.79, up +0.75% to +2.95% depending on the platform
Down -5.5% in 7 days, -23% in 30 days, and -36% in a year
Down -87% from its ATH of $410
📊 Technical analysis - mixed:
Daily RSI: 37.9, near oversold - weak
1h RSI: 55.5 - short-term improvement
ADX: 34.9 - strong downtrend
Above EMA50 but below EMA200 - mixed picture
Overall rating: 68/100, short-term bullish, daily bearish
LTC on the rise - Litecoin today, November 4, 2026
Price now: $54.60 - $55.79, up +0.75% to +2.95% depending on the platform
Down -5.5% in 7 days, -23% in 30 days, and -36% in a year
Down -87% from its ATH of $410
📊 Technical analysis - mixed:
Daily RSI: 37.9, near oversold - weak
1h RSI: 55.5 - short-term improvement
ADX: 34.9 - strong downtrend
Above EMA50 but below EMA200 - mixed picture
Overall rating: 68/100, short-term bullish, daily bearish
Down -5.5% in 7 days, -23% in 30 days, and -36% in a year
Down -87% from its ATH of $410
📊 Technical analysis - mixed:
Daily RSI: 37.9, near oversold - weak
1h RSI: 55.5 - short-term improvement
ADX: 34.9 - strong downtrend
Above EMA50 but below EMA200 - mixed picture
Overall rating: 68/100, short-term bullish, daily bearish
1
180

Article
LTC/USD Analysis — November 4, 2026$LTC /USD Analysis — November 4, 2026
Market: Litecoin ($LTC ) / US Dollar (USD)
{spot}(LTCUSDT)

### $54.67
+0.75% daily
Latest reported market price OHLCX Markets +1
### 1\. Market overview
Litecoin is showing a short-term recovery attempt, but the broader daily trend remains weak. Technical indicators are giving mixed signals: shorter-term momentum has improved, while the daily trend still favors sellers. OHLCX Markets +1
* Short-term trend: Mildly bullish recovery
* Daily trend: Bearish
* Momentum: Mixed, with a possible relief bounce
* Trading risk: Elevated volatility
### 2\. Key support and resistance levels
Based on the latest available technical readings around the $54–$55 area: OHLCX Markets +1
| Level | Price (USD) | Significance |
| ------------ | ----------- | -------------------------- |
| Resistance 3 | $55.82 | Higher breakout zone |
| Resistance 2 | $55.48 | Bullish continuation level |
| Resistance 1 | $55.14 | First resistance |
| Support 1 | $54.46 | Near-term support |
| Support 2 | $54.12 | Important downside level |
| Support 3 | $53.78 | Further bearish target |
These are reference levels, not guaranteed turning points.
### 3\. Technical indicators
RSI (14)
### 57.1
Bullish momentum
MACD
### Positive signal
Short-term
Moving averages
Mixed to bearish
Daily trend
Bearish
The indicator readings vary by exchange and update time. Daily technical summaries remain weak, even though some shorter-term indicators suggest recovery potential. OHLCX Markets +1
### 4\. Possible trading scenarios
Bullish scenario
If LTC breaks above $55.14 and holds, the next areas to watch are $55.48 and $55.82. A sustained breakout with strong volume would improve the short-term outlook.
Bearish scenario
If LTC falls below $54.46, watch $54.12 and $53.78. A decisive break below $53.78 could indicate additional downside pressure.
Sideways scenario
If price remains between approximately $54.46 and $55.14, LTC may consolidate before choosing its next direction.
### 5\. Final outlook
Cautious — bearish daily trend
* Short-term: A recovery is possible if buying momentum continues.
* Daily timeframe: Sellers retain an advantage until resistance is broken convincingly.
* Trade approach: Wait for confirmation rather than entering solely on a small price bounce.
* Risk management: Use a predefined stop-loss and avoid excessive leverage.
This is technical market analysis, not a guaranteed prediction or financial advice. Crypto prices can change rapidly, a
nd the levels above should be verified against your exchange's live chart before trading.
#LTC📈 #LTCPricePrediction #LTC/USD #viralpost
LTC/USD Analysis — November 4, 2026
$LTC /USD Analysis — November 4, 2026
Market: Litecoin ($LTC ) / US Dollar (USD)

### $54.67
+0.75% daily
Latest reported market price OHLCX Markets +1
### 1\. Market overview
Litecoin is showing a short-term recovery attempt, but the broader daily trend remains weak. Technical indicators are giving mixed signals: shorter-term momentum has improved, while the daily trend still favors sellers. OHLCX Markets +1
* Short-term trend: Mildly bullish recovery
* Daily trend: Bearish
* Momentum: Mixed, with a possible relief bounce
* Trading risk: Elevated volatility
### 2\. Key support and resistance levels
Based on the latest available technical readings around the $54–$55 area: OHLCX Markets +1
| Level | Price (USD) | Significance |
| ------------ | ----------- | -------------------------- |
| Resistance 3 | $55.82 | Higher breakout zone |
| Resistance 2 | $55.48 | Bullish continuation level |
| Resistance 1 | $55.14 | First resistance |
| Support 1 | $54.46 | Near-term support |
| Support 2 | $54.12 | Important downside level |
| Support 3 | $53.78 | Further bearish target |
These are reference levels, not guaranteed turning points.
### 3\. Technical indicators
RSI (14)
### 57.1
Bullish momentum
MACD
### Positive signal
Short-term
Moving averages
Mixed to bearish
Daily trend
Bearish
The indicator readings vary by exchange and update time. Daily technical summaries remain weak, even though some shorter-term indicators suggest recovery potential. OHLCX Markets +1
### 4\. Possible trading scenarios
Bullish scenario
If LTC breaks above $55.14 and holds, the next areas to watch are $55.48 and $55.82. A sustained breakout with strong volume would improve the short-term outlook.
Bearish scenario
If LTC falls below $54.46, watch $54.12 and $53.78. A decisive break below $53.78 could indicate additional downside pressure.
Sideways scenario
If price remains between approximately $54.46 and $55.14, LTC may consolidate before choosing its next direction.
### 5\. Final outlook
Cautious — bearish daily trend
* Short-term: A recovery is possible if buying momentum continues.
* Daily timeframe: Sellers retain an advantage until resistance is broken convincingly.
* Trade approach: Wait for confirmation rather than entering solely on a small price bounce.
* Risk management: Use a predefined stop-loss and avoid excessive leverage.
This is technical market analysis, not a guaranteed prediction or financial advice. Crypto prices can change rapidly, a
nd the levels above should be verified against your exchange's live chart before trading.
#LTC📈 #LTCPricePrediction #LTC/USD #viralpost
Market: Litecoin ($LTC ) / US Dollar (USD)

### $54.67
+0.75% daily
Latest reported market price OHLCX Markets +1
### 1\. Market overview
Litecoin is showing a short-term recovery attempt, but the broader daily trend remains weak. Technical indicators are giving mixed signals: shorter-term momentum has improved, while the daily trend still favors sellers. OHLCX Markets +1
* Short-term trend: Mildly bullish recovery
* Daily trend: Bearish
* Momentum: Mixed, with a possible relief bounce
* Trading risk: Elevated volatility
### 2\. Key support and resistance levels
Based on the latest available technical readings around the $54–$55 area: OHLCX Markets +1
| Level | Price (USD) | Significance |
| ------------ | ----------- | -------------------------- |
| Resistance 3 | $55.82 | Higher breakout zone |
| Resistance 2 | $55.48 | Bullish continuation level |
| Resistance 1 | $55.14 | First resistance |
| Support 1 | $54.46 | Near-term support |
| Support 2 | $54.12 | Important downside level |
| Support 3 | $53.78 | Further bearish target |
These are reference levels, not guaranteed turning points.
### 3\. Technical indicators
RSI (14)
### 57.1
Bullish momentum
MACD
### Positive signal
Short-term
Moving averages
Mixed to bearish
Daily trend
Bearish
The indicator readings vary by exchange and update time. Daily technical summaries remain weak, even though some shorter-term indicators suggest recovery potential. OHLCX Markets +1
### 4\. Possible trading scenarios
Bullish scenario
If LTC breaks above $55.14 and holds, the next areas to watch are $55.48 and $55.82. A sustained breakout with strong volume would improve the short-term outlook.
Bearish scenario
If LTC falls below $54.46, watch $54.12 and $53.78. A decisive break below $53.78 could indicate additional downside pressure.
Sideways scenario
If price remains between approximately $54.46 and $55.14, LTC may consolidate before choosing its next direction.
### 5\. Final outlook
Cautious — bearish daily trend
* Short-term: A recovery is possible if buying momentum continues.
* Daily timeframe: Sellers retain an advantage until resistance is broken convincingly.
* Trade approach: Wait for confirmation rather than entering solely on a small price bounce.
* Risk management: Use a predefined stop-loss and avoid excessive leverage.
This is technical market analysis, not a guaranteed prediction or financial advice. Crypto prices can change rapidly, a
nd the levels above should be verified against your exchange's live chart before trading.
#LTC📈 #LTCPricePrediction #LTC/USD #viralpost
97
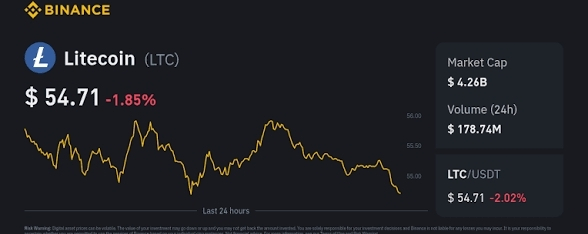
Article
LTC/USD Technical Analysis — November 1, 2026$LTC /USD Technical Analysis — November 1, 2026
{spot}(LTCUSDT)
Litecoin ($LTC ) vs US Dollar (USD) · Short-term trading outlook

### $55.90–$56.05
Approximate reference price from recent market data
Bearish bias
Litecoin is showing a weak short-term and medium-term trend, although a small intraday rebound is possible. Recent technical readings show daily RSI around 40, with price below important moving averages and momentum indicators still relatively weak. OHLCX Markets +2
### 1\. Key support and resistance levels
| Level | Price (USD) | Importance |
| ----------------- | ------------- | -------------------- |
| Resistance 3 | $59.30 | Stronger resistance |
| Resistance 2 | $57.63 | Upside target |
| Resistance 1 | $56.59–$56.96 | Immediate resistance |
| Current reference | $55.90–$56.05 | Price zone |
| Support 1 | $54.99–$55.05 | Immediate support |
| Support 2 | $53.07–$53.68 | Lower support |
| Support 3 | $51.66 | Bearish target |
These are approximate technical levels from November 1 market data and may vary by exchange. Borearis +1
### 2\. Trading scenarios
Bearish scenario — SELL setup
If LTC breaks below $54.99 and confirms the breakdown, the next potential levels are:
* Target 1: $53.70
* Target 2: $53.05
* Target 3: $51.66
Bullish scenario — BUY setup
If LTC breaks above $56.60–$56.96 and holds that zone:
* Target 1: $57.63
* Target 2: $58.00
* Target 3: $59.30
### 3\. Technical indicators
* RSI: Around 40 — weak momentum, but not deeply oversold.
* MACD: Bearish on the daily chart.
* Trend: Short-term bearish; a recovery is possible if resistance breaks.
* Overall bias: Bearish until price shows a convincing breakout. OHLCX Markets +1
### 4\. My trading view
Preferred bias: SELL on confirmed weakness
Watch for a break below $54.99 rather than entering blindly.
Bullish invalidation of the short-term view
A sustained move above $56.96 would improve the recovery outlook.
Risk management: Wait for candle confirmation, use a stop-loss, and avoid excessive leverage. These are technical scenarios, not guaranteed predictions.
Would you like a more specific trading setup?
Choose your chart timeframe
5-minute scalping
15-minute trading
1-hour trading
4-hour swing trading
Daily analysis
Trade direction
BUY only
SELL only
BUY and SELL setups
Get detailed LTC/USD setup.
#LTC📈 #LTC/USD #LTCPricePrediction
LTC/USD Technical Analysis — November 1, 2026
$LTC /USD Technical Analysis — November 1, 2026
Litecoin ($LTC ) vs US Dollar (USD) · Short-term trading outlook

### $55.90–$56.05
Approximate reference price from recent market data
Bearish bias
Litecoin is showing a weak short-term and medium-term trend, although a small intraday rebound is possible. Recent technical readings show daily RSI around 40, with price below important moving averages and momentum indicators still relatively weak. OHLCX Markets +2
### 1\. Key support and resistance levels
| Level | Price (USD) | Importance |
| ----------------- | ------------- | -------------------- |
| Resistance 3 | $59.30 | Stronger resistance |
| Resistance 2 | $57.63 | Upside target |
| Resistance 1 | $56.59–$56.96 | Immediate resistance |
| Current reference | $55.90–$56.05 | Price zone |
| Support 1 | $54.99–$55.05 | Immediate support |
| Support 2 | $53.07–$53.68 | Lower support |
| Support 3 | $51.66 | Bearish target |
These are approximate technical levels from November 1 market data and may vary by exchange. Borearis +1
### 2\. Trading scenarios
Bearish scenario — SELL setup
If LTC breaks below $54.99 and confirms the breakdown, the next potential levels are:
* Target 1: $53.70
* Target 2: $53.05
* Target 3: $51.66
Bullish scenario — BUY setup
If LTC breaks above $56.60–$56.96 and holds that zone:
* Target 1: $57.63
* Target 2: $58.00
* Target 3: $59.30
### 3\. Technical indicators
* RSI: Around 40 — weak momentum, but not deeply oversold.
* MACD: Bearish on the daily chart.
* Trend: Short-term bearish; a recovery is possible if resistance breaks.
* Overall bias: Bearish until price shows a convincing breakout. OHLCX Markets +1
### 4\. My trading view
Preferred bias: SELL on confirmed weakness
Watch for a break below $54.99 rather than entering blindly.
Bullish invalidation of the short-term view
A sustained move above $56.96 would improve the recovery outlook.
Risk management: Wait for candle confirmation, use a stop-loss, and avoid excessive leverage. These are technical scenarios, not guaranteed predictions.
Would you like a more specific trading setup?
Choose your chart timeframe
5-minute scalping
15-minute trading
1-hour trading
4-hour swing trading
Daily analysis
Trade direction
BUY only
SELL only
BUY and SELL setups
Get detailed LTC/USD setup.
#LTC📈 #LTC/USD #LTCPricePrediction
Litecoin ($LTC ) vs US Dollar (USD) · Short-term trading outlook

### $55.90–$56.05
Approximate reference price from recent market data
Bearish bias
Litecoin is showing a weak short-term and medium-term trend, although a small intraday rebound is possible. Recent technical readings show daily RSI around 40, with price below important moving averages and momentum indicators still relatively weak. OHLCX Markets +2
### 1\. Key support and resistance levels
| Level | Price (USD) | Importance |
| ----------------- | ------------- | -------------------- |
| Resistance 3 | $59.30 | Stronger resistance |
| Resistance 2 | $57.63 | Upside target |
| Resistance 1 | $56.59–$56.96 | Immediate resistance |
| Current reference | $55.90–$56.05 | Price zone |
| Support 1 | $54.99–$55.05 | Immediate support |
| Support 2 | $53.07–$53.68 | Lower support |
| Support 3 | $51.66 | Bearish target |
These are approximate technical levels from November 1 market data and may vary by exchange. Borearis +1
### 2\. Trading scenarios
Bearish scenario — SELL setup
If LTC breaks below $54.99 and confirms the breakdown, the next potential levels are:
* Target 1: $53.70
* Target 2: $53.05
* Target 3: $51.66
Bullish scenario — BUY setup
If LTC breaks above $56.60–$56.96 and holds that zone:
* Target 1: $57.63
* Target 2: $58.00
* Target 3: $59.30
### 3\. Technical indicators
* RSI: Around 40 — weak momentum, but not deeply oversold.
* MACD: Bearish on the daily chart.
* Trend: Short-term bearish; a recovery is possible if resistance breaks.
* Overall bias: Bearish until price shows a convincing breakout. OHLCX Markets +1
### 4\. My trading view
Preferred bias: SELL on confirmed weakness
Watch for a break below $54.99 rather than entering blindly.
Bullish invalidation of the short-term view
A sustained move above $56.96 would improve the recovery outlook.
Risk management: Wait for candle confirmation, use a stop-loss, and avoid excessive leverage. These are technical scenarios, not guaranteed predictions.
Would you like a more specific trading setup?
Choose your chart timeframe
5-minute scalping
15-minute trading
1-hour trading
4-hour swing trading
Daily analysis
Trade direction
BUY only
SELL only
BUY and SELL setups
Get detailed LTC/USD setup.
#LTC📈 #LTC/USD #LTCPricePrediction
281

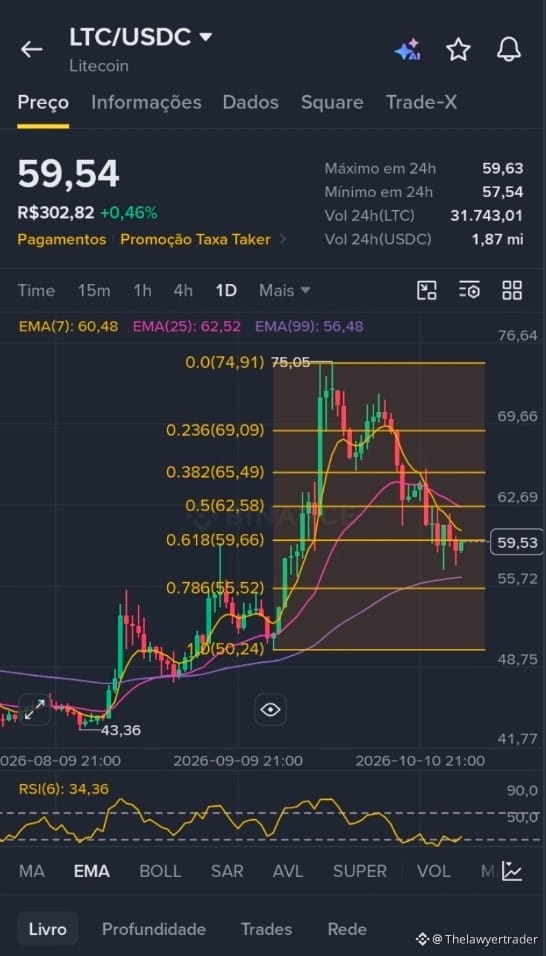
LTC/USDC — Litecoin at a decisive test on the daily chart (1D)
Litecoin is trading around 59.54 USDC, up slightly on the day, following a correction from the 75.05 high formed during the rally that began at 43.36. Price is testing the 0.618 Fibonacci level (59.66), known as the golden retracement zone, while the 6-period RSI reads 34.36, close to oversold territory.
Main support: the 55.50–56.50 area, where the 99-period EMA (56.48) and the 0.786 Fibonacci level (55.52) converge.
Main resistance: the 62.50–62.60 area, marked by the 25-period EMA (62.52) and the 0.5 Fibonacci level (62.58).
Chart pattern: a pullback (correction) within an uptrend, with price reacting in the 0.618 zone, supported by the 99-period EMA as dynamic support.
Historically, this confluence has a good chance of triggering a bounce when stabilization is confirmed, but no reversal candle has closed yet. If the 0.618 level is lost, the next downside target is the 0.786 level at 55.52. A recovery above 62.50 would indicate a resumption of the uptrend.
⚠️ This content is for informational purposes only and does not constitute investment advice.
#LTC #LTCPricePrediction $LTC
LTC/USDC — Litecoin at a decisive test on the daily chart (1D)
Litecoin is trading around 59.54 USDC, up slightly on the day, following a correction from the 75.05 high formed during the rally that began at 43.36. Price is testing the 0.618 Fibonacci level (59.66), known as the golden retracement zone, while the 6-period RSI reads 34.36, close to oversold territory.
Main support: the 55.50–56.50 area, where the 99-period EMA (56.48) and the 0.786 Fibonacci level (55.52) converge.
Main resistance: the 62.50–62.60 area, marked by the 25-period EMA (62.52) and the 0.5 Fibonacci level (62.58).
Chart pattern: a pullback (correction) within an uptrend, with price reacting in the 0.618 zone, supported by the 99-period EMA as dynamic support.
Historically, this confluence has a good chance of triggering a bounce when stabilization is confirmed, but no reversal candle has closed yet. If the 0.618 level is lost, the next downside target is the 0.786 level at 55.52. A recovery above 62.50 would indicate a resumption of the uptrend.
⚠️ This content is for informational purposes only and does not constitute investment advice.
#LTC #LTCPricePrediction $LTC
Litecoin is trading around 59.54 USDC, up slightly on the day, following a correction from the 75.05 high formed during the rally that began at 43.36. Price is testing the 0.618 Fibonacci level (59.66), known as the golden retracement zone, while the 6-period RSI reads 34.36, close to oversold territory.
Main support: the 55.50–56.50 area, where the 99-period EMA (56.48) and the 0.786 Fibonacci level (55.52) converge.
Main resistance: the 62.50–62.60 area, marked by the 25-period EMA (62.52) and the 0.5 Fibonacci level (62.58).
Chart pattern: a pullback (correction) within an uptrend, with price reacting in the 0.618 zone, supported by the 99-period EMA as dynamic support.
Historically, this confluence has a good chance of triggering a bounce when stabilization is confirmed, but no reversal candle has closed yet. If the 0.618 level is lost, the next downside target is the 0.786 level at 55.52. A recovery above 62.50 would indicate a resumption of the uptrend.
⚠️ This content is for informational purposes only and does not constitute investment advice.
#LTC #LTCPricePrediction $LTC

409

#LTCPricePrediction
This is an established and well-known cryptocurrency project. While its future does not necessarily appear to be coming to an end, a rise in its price is also not guaranteed. If you are considering purchasing LTC or engaging in long/short (buy/sell) futures trading, it is essential to separately evaluate its fundamental aspects and its price trends.
1. Future Strengths and Risks of LTC
Limited Supply: Litecoin has a maximum supply of 84 million coins.
Fast Payments: It was designed to facilitate relatively low-cost digital payments.
Established Network: It has been present in the cryptocurrency market for many years.
Competition: It may face pressure due to Bitcoin, stablecoins, and other payment networks.
{spot}(LTCUSDT)
#LTC.24小时交易策略
#LTCPricePrediction
This is an established and well-known cryptocurrency project. While its future does not necessarily appear to be coming to an end, a rise in its price is also not guaranteed. If you are considering purchasing LTC or engaging in long/short (buy/sell) futures trading, it is essential to separately evaluate its fundamental aspects and its price trends.
1. Future Strengths and Risks of LTC
Limited Supply: Litecoin has a maximum supply of 84 million coins.
Fast Payments: It was designed to facilitate relatively low-cost digital payments.
Established Network: It has been present in the cryptocurrency market for many years.
Competition: It may face pressure due to Bitcoin, stablecoins, and other payment networks.
#LTC.24小时交易策略
This is an established and well-known cryptocurrency project. While its future does not necessarily appear to be coming to an end, a rise in its price is also not guaranteed. If you are considering purchasing LTC or engaging in long/short (buy/sell) futures trading, it is essential to separately evaluate its fundamental aspects and its price trends.
1. Future Strengths and Risks of LTC
Limited Supply: Litecoin has a maximum supply of 84 million coins.
Fast Payments: It was designed to facilitate relatively low-cost digital payments.
Established Network: It has been present in the cryptocurrency market for many years.
Competition: It may face pressure due to Bitcoin, stablecoins, and other payment networks.
#LTC.24小时交易策略
2
154

·
--
Bullish
🚨 $LTC — Network Activity Surge & 4H Structure 📈
▪️ Order Flow Bias: Bullish 🟢 (Fundamental Strength)
▪️ Expected Mitigation Range: $46.00 – $46.50
▪️ Liquidity Target 1: $49.00 (Resistance)
▪️ Liquidity Target 2: $50.00 (Psychological)
▪️ Structural Invalidation: $45.00 (Break of support)
Institutional Macro & Market Analysis:
Litecoin's network activity has tripled in the past year, with Adjusted Economic Value (AEV) rising from 8.81M to 30.95M LTC. Holders have grown 2,483% in 24 hours to 8.86M, and institutional access is expanding (BancaStato integration). Price has broken out of a six-week consolidation range ($41-$45) and is targeting $50.
The 4H chart shows LTC trading below VWAP ($47.02) and EMA8 ($46.92) at $46.45, signaling a short-term pullback. The 9-day SMA crossing above the 21-day SMA supports the bullish structure. A reclaim of $47.00 targets $49.00 and $50.00. Failure to hold $45.00 would invalidate the breakout.
#RafeTrades #Litecoin #LTCPricePrediction
"CLICK HERE👇👇👇 TO TRACK THE LIVE CHART & TRADE"
$LTC $BTC
Disclaimer: Market structure tracking for informational purposes. Not financial advice. Always DYOR. 🛡️
🚨 $LTC — Network Activity Surge & 4H Structure 📈
▪️ Order Flow Bias: Bullish 🟢 (Fundamental Strength)
▪️ Expected Mitigation Range: $46.00 – $46.50
▪️ Liquidity Target 1: $49.00 (Resistance)
▪️ Liquidity Target 2: $50.00 (Psychological)
▪️ Structural Invalidation: $45.00 (Break of support)
Institutional Macro & Market Analysis:
Litecoin's network activity has tripled in the past year, with Adjusted Economic Value (AEV) rising from 8.81M to 30.95M LTC. Holders have grown 2,483% in 24 hours to 8.86M, and institutional access is expanding (BancaStato integration). Price has broken out of a six-week consolidation range ($41-$45) and is targeting $50.
The 4H chart shows LTC trading below VWAP ($47.02) and EMA8 ($46.92) at $46.45, signaling a short-term pullback. The 9-day SMA crossing above the 21-day SMA supports the bullish structure. A reclaim of $47.00 targets $49.00 and $50.00. Failure to hold $45.00 would invalidate the breakout.
#RafeTrades #Litecoin #LTCPricePrediction
"CLICK HERE👇👇👇 TO TRACK THE LIVE CHART & TRADE"
$LTC $BTC
Disclaimer: Market structure tracking for informational purposes. Not financial advice. Always DYOR. 🛡️
▪️ Order Flow Bias: Bullish 🟢 (Fundamental Strength)
▪️ Expected Mitigation Range: $46.00 – $46.50
▪️ Liquidity Target 1: $49.00 (Resistance)
▪️ Liquidity Target 2: $50.00 (Psychological)
▪️ Structural Invalidation: $45.00 (Break of support)
Institutional Macro & Market Analysis:
Litecoin's network activity has tripled in the past year, with Adjusted Economic Value (AEV) rising from 8.81M to 30.95M LTC. Holders have grown 2,483% in 24 hours to 8.86M, and institutional access is expanding (BancaStato integration). Price has broken out of a six-week consolidation range ($41-$45) and is targeting $50.
The 4H chart shows LTC trading below VWAP ($47.02) and EMA8 ($46.92) at $46.45, signaling a short-term pullback. The 9-day SMA crossing above the 21-day SMA supports the bullish structure. A reclaim of $47.00 targets $49.00 and $50.00. Failure to hold $45.00 would invalidate the breakout.
#RafeTrades #Litecoin #LTCPricePrediction
"CLICK HERE👇👇👇 TO TRACK THE LIVE CHART & TRADE"
$LTC $BTC
Disclaimer: Market structure tracking for informational purposes. Not financial advice. Always DYOR. 🛡️

40

$LTC ⚡ LTC — Short Analysis
🚀 Litecoin (LTC) remains a well-known crypto asset with strong market recognition and active trading interest.
📈 A breakout with rising volume could signal stronger momentum, while key support levels remain important.
🔥 Watch the volume + resistance breakout!
#LTC📈 #LTCPricePrediction
{future}(LTCUSDT)
$LTC ⚡ LTC — Short Analysis
🚀 Litecoin (LTC) remains a well-known crypto asset with strong market recognition and active trading interest.
📈 A breakout with rising volume could signal stronger momentum, while key support levels remain important.
🔥 Watch the volume + resistance breakout!
#LTC📈 #LTCPricePrediction
🚀 Litecoin (LTC) remains a well-known crypto asset with strong market recognition and active trading interest.
📈 A breakout with rising volume could signal stronger momentum, while key support levels remain important.
🔥 Watch the volume + resistance breakout!
#LTC📈 #LTCPricePrediction

73

·
--
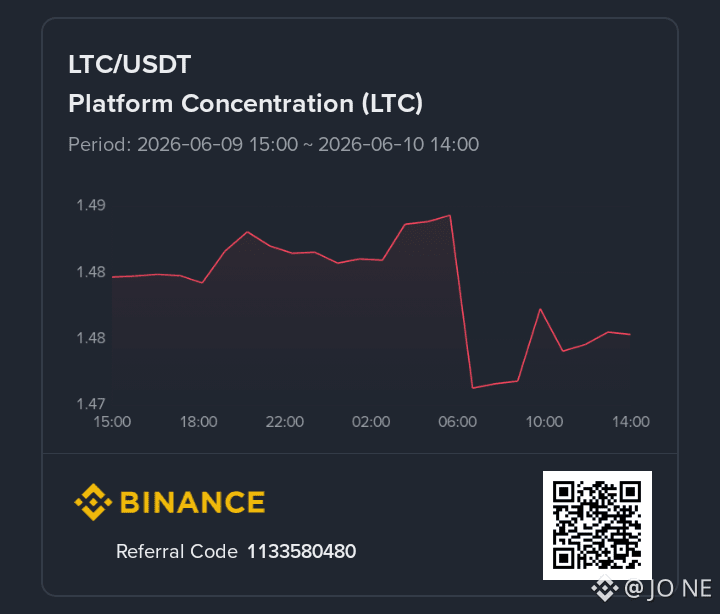
📰 Key Latest News / Updates $LTC
📊 Market pressure continues after LTC recently broke a long-term trendline, keeping $43.50 as a key resistance level.
🧠 Analysts say sentiment is still “fear-heavy” in the market, but not extreme panic.
⚡ Some positive development signals:
Ongoing ecosystem upgrades (like LitVM testnet activity) boosting developer interest
Institutional accumulation trends still being reported in small amounts#LTCPricePrediction
#LTC.24小时交易策略 #cryptooinsigts
📰 Key Latest News / Updates $LTC
📊 Market pressure continues after LTC recently broke a long-term trendline, keeping $43.50 as a key resistance level.
🧠 Analysts say sentiment is still “fear-heavy” in the market, but not extreme panic.
⚡ Some positive development signals:
Ongoing ecosystem upgrades (like LitVM testnet activity) boosting developer interest
Institutional accumulation trends still being reported in small amounts#LTCPricePrediction
#LTC.24小时交易策略 #cryptooinsigts
📊 Market pressure continues after LTC recently broke a long-term trendline, keeping $43.50 as a key resistance level.
🧠 Analysts say sentiment is still “fear-heavy” in the market, but not extreme panic.
⚡ Some positive development signals:
Ongoing ecosystem upgrades (like LitVM testnet activity) boosting developer interest
Institutional accumulation trends still being reported in small amounts#LTCPricePrediction
#LTC.24小时交易策略 #cryptooinsigts
157

·
--
$LTC at $52.9, an active ETF. Halving in July 2027. How much longer are you going to ignore it?🧐💯
{future}(LTCUSDT)
Today's data: $4.12 trillion market cap. $205 million in 24h volume. Canary Capital's spot ETF listed and trading.
The July 2027 halving cuts mining rewards from 6.25 to 3.125 LTC. Historically, $LTC pumps before the halving, not after.
ATH: $412. Today's price: $52.9, down 87%.
ETF with regulated access. Halving in 14 months. Price at the floor. I've been mining it for a good while, and despite the dips, it has managed to find a safe haven #LTCPricePrediction #CTRARK
$LTC at $52.9, an active ETF. Halving in July 2027. How much longer are you going to ignore it?🧐💯
Today's data: $4.12 trillion market cap. $205 million in 24h volume. Canary Capital's spot ETF listed and trading.
The July 2027 halving cuts mining rewards from 6.25 to 3.125 LTC. Historically, $LTC pumps before the halving, not after.
ATH: $412. Today's price: $52.9, down 87%.
ETF with regulated access. Halving in 14 months. Price at the floor. I've been mining it for a good while, and despite the dips, it has managed to find a safe haven #LTCPricePrediction #CTRARK
Today's data: $4.12 trillion market cap. $205 million in 24h volume. Canary Capital's spot ETF listed and trading.
The July 2027 halving cuts mining rewards from 6.25 to 3.125 LTC. Historically, $LTC pumps before the halving, not after.
ATH: $412. Today's price: $52.9, down 87%.
ETF with regulated access. Halving in 14 months. Price at the floor. I've been mining it for a good while, and despite the dips, it has managed to find a safe haven #LTCPricePrediction #CTRARK

2
3
1.6k

·
--
Bullish
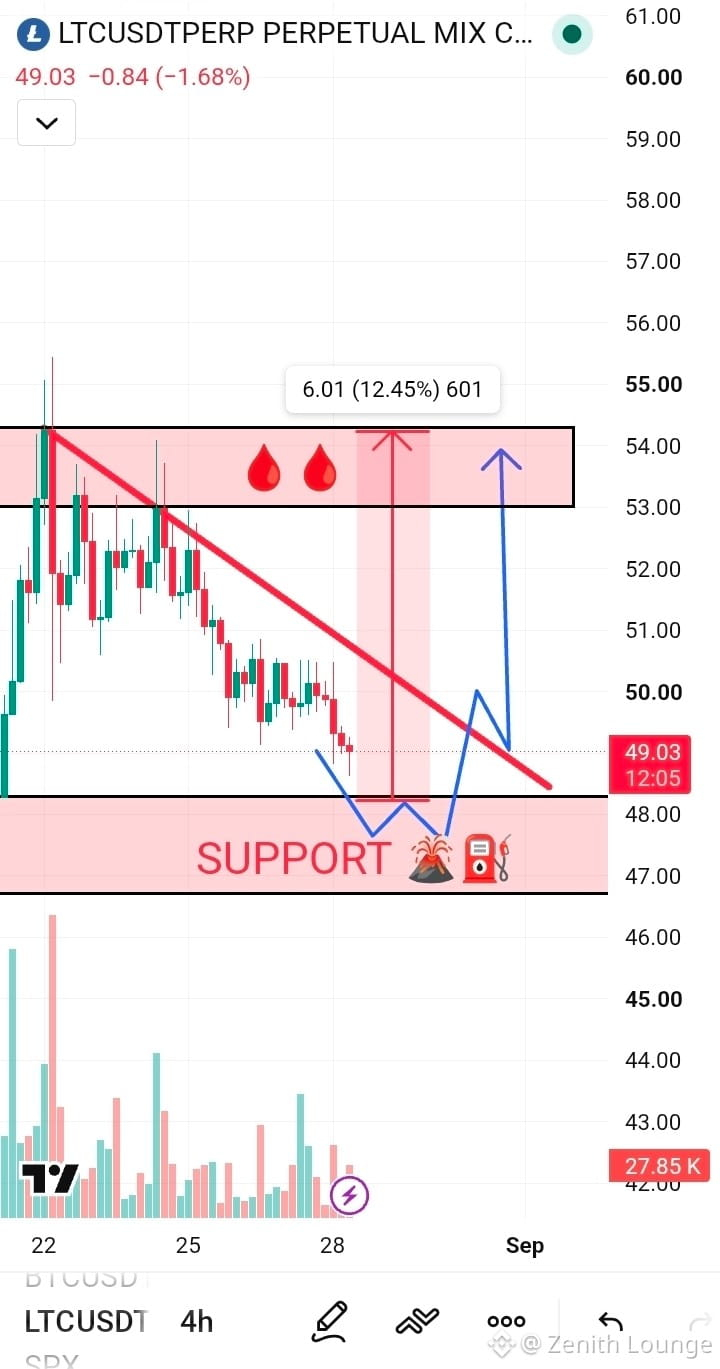
$LTC USDT🚨 Update
#LTCPricePrediction may move downside from here and test the $47–$48 support zone 📉
After touching support, we expect some consolidation. If LTC gets a 4H breakout, it could turn bullish 🚀
📌 Long Entry: After confirmed breakout
🎯 Targets: $53–$54.5
Trade with proper risk management. ⚠️
{future}(LTCUSDT)
#CaliforniaBillWouldBarOfficialMemeCoins #TRONMainnetActivatesTVMPragueOsaka #GoldRisesAbout14%InAugust
$LTC USDT🚨 Update
#LTCPricePrediction may move downside from here and test the $47–$48 support zone 📉
After touching support, we expect some consolidation. If LTC gets a 4H breakout, it could turn bullish 🚀
📌 Long Entry: After confirmed breakout
🎯 Targets: $53–$54.5
Trade with proper risk management. ⚠️
#CaliforniaBillWouldBarOfficialMemeCoins #TRONMainnetActivatesTVMPragueOsaka #GoldRisesAbout14%InAugust
#LTCPricePrediction may move downside from here and test the $47–$48 support zone 📉
After touching support, we expect some consolidation. If LTC gets a 4H breakout, it could turn bullish 🚀
📌 Long Entry: After confirmed breakout
🎯 Targets: $53–$54.5
Trade with proper risk management. ⚠️
#CaliforniaBillWouldBarOfficialMemeCoins #TRONMainnetActivatesTVMPragueOsaka #GoldRisesAbout14%InAugust
2
1
107

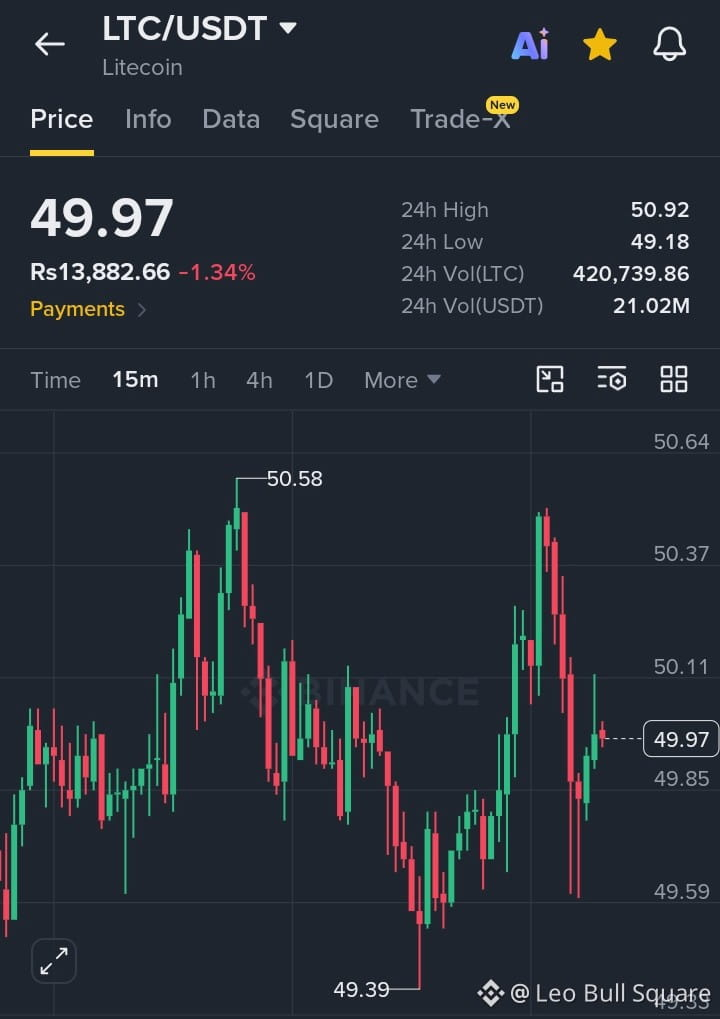
🔥 $LTC /USDT LONG TRADE ALERT – Bulls Fighting Back at Key Support 🚀
LTC/USDT is showing a potential short-term recovery setup after bouncing from the $49.18 support zone. Currently trading near $49.97, Litecoin is attempting to regain momentum after a rejection from the $50.92 resistance area. The 15M structure shows buyers stepping in with recovery candles, but bulls must reclaim higher levels with strong volume to confirm continuation.
📌 Trade Setup:
• Entry Zone: $49.80 – $50.00
• TP1: $50.30
• TP2: $50.60
• TP3: $50.90 (major resistance breakout target)
• Stop Loss: Below $49.40
⚡ Key Technical Points:
LTC is holding above the psychological $49.50 support, while buyers are defending lower levels after the recent dip. A clean breakout above $50.30 could trigger fresh bullish momentum toward $50.90+. Watch volume expansion and confirmation candles before entering aggressively.
Market Bias: Slightly Bullish 📈 | Breakout Confirmation Needed
#LTCPricePrediction
{spot}(LTCUSDT)
🔥 $LTC /USDT LONG TRADE ALERT – Bulls Fighting Back at Key Support 🚀
LTC/USDT is showing a potential short-term recovery setup after bouncing from the $49.18 support zone. Currently trading near $49.97, Litecoin is attempting to regain momentum after a rejection from the $50.92 resistance area. The 15M structure shows buyers stepping in with recovery candles, but bulls must reclaim higher levels with strong volume to confirm continuation.
📌 Trade Setup:
• Entry Zone: $49.80 – $50.00
• TP1: $50.30
• TP2: $50.60
• TP3: $50.90 (major resistance breakout target)
• Stop Loss: Below $49.40
⚡ Key Technical Points:
LTC is holding above the psychological $49.50 support, while buyers are defending lower levels after the recent dip. A clean breakout above $50.30 could trigger fresh bullish momentum toward $50.90+. Watch volume expansion and confirmation candles before entering aggressively.
Market Bias: Slightly Bullish 📈 | Breakout Confirmation Needed
#LTCPricePrediction
LTC/USDT is showing a potential short-term recovery setup after bouncing from the $49.18 support zone. Currently trading near $49.97, Litecoin is attempting to regain momentum after a rejection from the $50.92 resistance area. The 15M structure shows buyers stepping in with recovery candles, but bulls must reclaim higher levels with strong volume to confirm continuation.
📌 Trade Setup:
• Entry Zone: $49.80 – $50.00
• TP1: $50.30
• TP2: $50.60
• TP3: $50.90 (major resistance breakout target)
• Stop Loss: Below $49.40
⚡ Key Technical Points:
LTC is holding above the psychological $49.50 support, while buyers are defending lower levels after the recent dip. A clean breakout above $50.30 could trigger fresh bullish momentum toward $50.90+. Watch volume expansion and confirmation candles before entering aggressively.
Market Bias: Slightly Bullish 📈 | Breakout Confirmation Needed
#LTCPricePrediction
1
58

·
--
Bullish
#LTCPricePrediction $LTC
{spot}(LTCUSDT)
Volume Anomaly Alert on £ $LTC #LTCUSDT
BULLISH VOLUME SPIKE
Current Volume: 6.01M
Average Volume: 1.85M
Volume Spike: 3.2x average
Price Change (1h): +2.10%
Price Change (24h): +4.22%
Current Price: 45.200000
→Unusual trading activity detected. Strong buying pressure!
Get real-time alerts for free:
finorabot.com
? Accumulation or FOMO? What's your read?
Share on comments
LTC
0.04%
#LTCPricePrediction $LTC
Volume Anomaly Alert on £ $LTC #LTCUSDT
BULLISH VOLUME SPIKE
Current Volume: 6.01M
Average Volume: 1.85M
Volume Spike: 3.2x average
Price Change (1h): +2.10%
Price Change (24h): +4.22%
Current Price: 45.200000
→Unusual trading activity detected. Strong buying pressure!
Get real-time alerts for free:
finorabot.com
? Accumulation or FOMO? What's your read?
Share on comments
LTC
0.04%
Volume Anomaly Alert on £ $LTC #LTCUSDT
BULLISH VOLUME SPIKE
Current Volume: 6.01M
Average Volume: 1.85M
Volume Spike: 3.2x average
Price Change (1h): +2.10%
Price Change (24h): +4.22%
Current Price: 45.200000
→Unusual trading activity detected. Strong buying pressure!
Get real-time alerts for free:
finorabot.com
? Accumulation or FOMO? What's your read?
Share on comments
LTC
0.04%
163
·
--
Bullish
#LTCPricePrediction $LTC
{spot}(LTCUSDT)
$LTC has been trading below both EMA20 and EMA50 on the 4-hour, with ADX showing sellers in control and price rejected at VWAP - 3 of 4 trend indicators point the same way.
If the weakness continues, 41.0415 is the first level I'm watching, then 39.9551. A reclaim of 44.4781 would invalidate this read for me.
Not financial advice just sharing my process.
How are you positioned on LTC?
LTC 1.99%
#LTCPricePrediction $LTC
$LTC has been trading below both EMA20 and EMA50 on the 4-hour, with ADX showing sellers in control and price rejected at VWAP - 3 of 4 trend indicators point the same way.
If the weakness continues, 41.0415 is the first level I'm watching, then 39.9551. A reclaim of 44.4781 would invalidate this read for me.
Not financial advice just sharing my process.
How are you positioned on LTC?
LTC 1.99%
$LTC has been trading below both EMA20 and EMA50 on the 4-hour, with ADX showing sellers in control and price rejected at VWAP - 3 of 4 trend indicators point the same way.
If the weakness continues, 41.0415 is the first level I'm watching, then 39.9551. A reclaim of 44.4781 would invalidate this read for me.
Not financial advice just sharing my process.
How are you positioned on LTC?
LTC 1.99%
199

·
--
Estimates for the price of 1 Litecoin (LTC) in 2030 range significantly from around $50 to upwards of $1,000, depending on whether you look at conservative algorithmic models or more optimistic industry projections. #LTCPricePrediction
Estimates for the price of 1 Litecoin (LTC) in 2030 range significantly from around $50 to upwards of $1,000, depending on whether you look at conservative algorithmic models or more optimistic industry projections. #LTCPricePrediction
181

$LTC
LTC is trading at $45.06 right now, up about 0.36% over the last 24 hours.
24h range: $44.39 – $46.08. The 24h open was $44.90, so price action has been fairly tight with a slight bullish bias.
If you want the quick read: LTC looks relatively stable today rather than explosive — modest gains, decent trading activity, and no major breakout yet.
#LTC📈
#LTC
#LTCPricePrediction
{spot}(LTCUSDT)
$LTC
LTC is trading at $45.06 right now, up about 0.36% over the last 24 hours.
24h range: $44.39 – $46.08. The 24h open was $44.90, so price action has been fairly tight with a slight bullish bias.
If you want the quick read: LTC looks relatively stable today rather than explosive — modest gains, decent trading activity, and no major breakout yet.
#LTC📈
#LTC
#LTCPricePrediction
LTC is trading at $45.06 right now, up about 0.36% over the last 24 hours.
24h range: $44.39 – $46.08. The 24h open was $44.90, so price action has been fairly tight with a slight bullish bias.
If you want the quick read: LTC looks relatively stable today rather than explosive — modest gains, decent trading activity, and no major breakout yet.
#LTC📈
#LTC
#LTCPricePrediction
112

·
--
Bullish
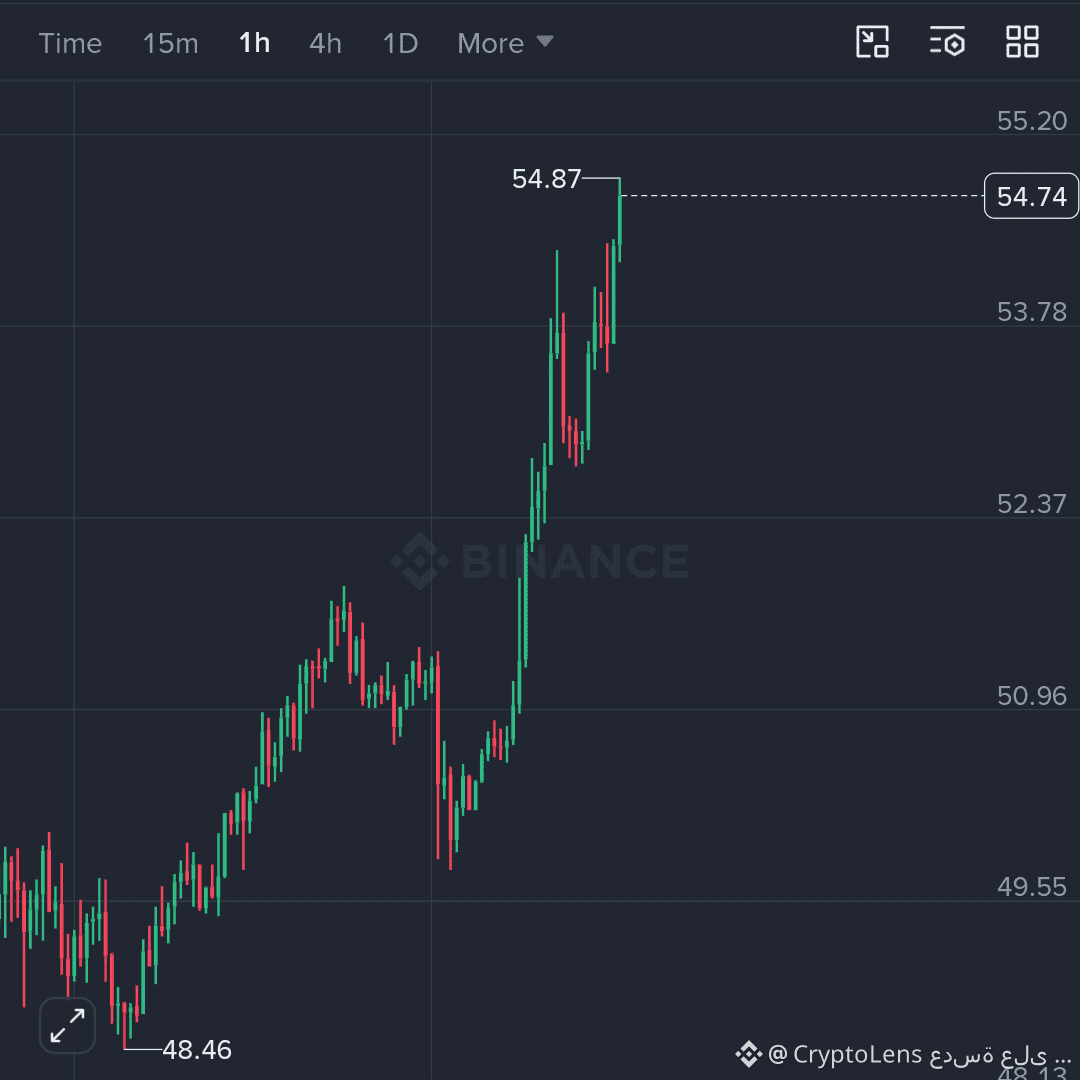
#LTC | Bullish Structure
The move from 48.46$ → 54.87$ maintained a clear bullish structure, with continued absorption of sell orders on pullbacks.
The price is currently testing 54.87–55.20$; this is the pivotal zone.
Price acceptance above 55.20$ would signal continued momentum and open the way for a new bullish extension.
So far, there is no confirmation of a structural reversal.
As long as higher highs and higher lows remain intact, the advantage stays with buyers.
$LTC #LTC #LTC/USD #LTCPricePrediction #USAugustAvgHourlyEarningsRise3.1%
#LTC | Bullish Structure
The move from 48.46$ → 54.87$ maintained a clear bullish structure, with continued absorption of sell orders on pullbacks.
The price is currently testing 54.87–55.20$; this is the pivotal zone.
Price acceptance above 55.20$ would signal continued momentum and open the way for a new bullish extension.
So far, there is no confirmation of a structural reversal.
As long as higher highs and higher lows remain intact, the advantage stays with buyers.
$LTC #LTC #LTC/USD #LTCPricePrediction #USAugustAvgHourlyEarningsRise3.1%
The move from 48.46$ → 54.87$ maintained a clear bullish structure, with continued absorption of sell orders on pullbacks.
The price is currently testing 54.87–55.20$; this is the pivotal zone.
Price acceptance above 55.20$ would signal continued momentum and open the way for a new bullish extension.
So far, there is no confirmation of a structural reversal.
As long as higher highs and higher lows remain intact, the advantage stays with buyers.
$LTC #LTC #LTC/USD #LTCPricePrediction #USAugustAvgHourlyEarningsRise3.1%
1
75

·
--
Bullish
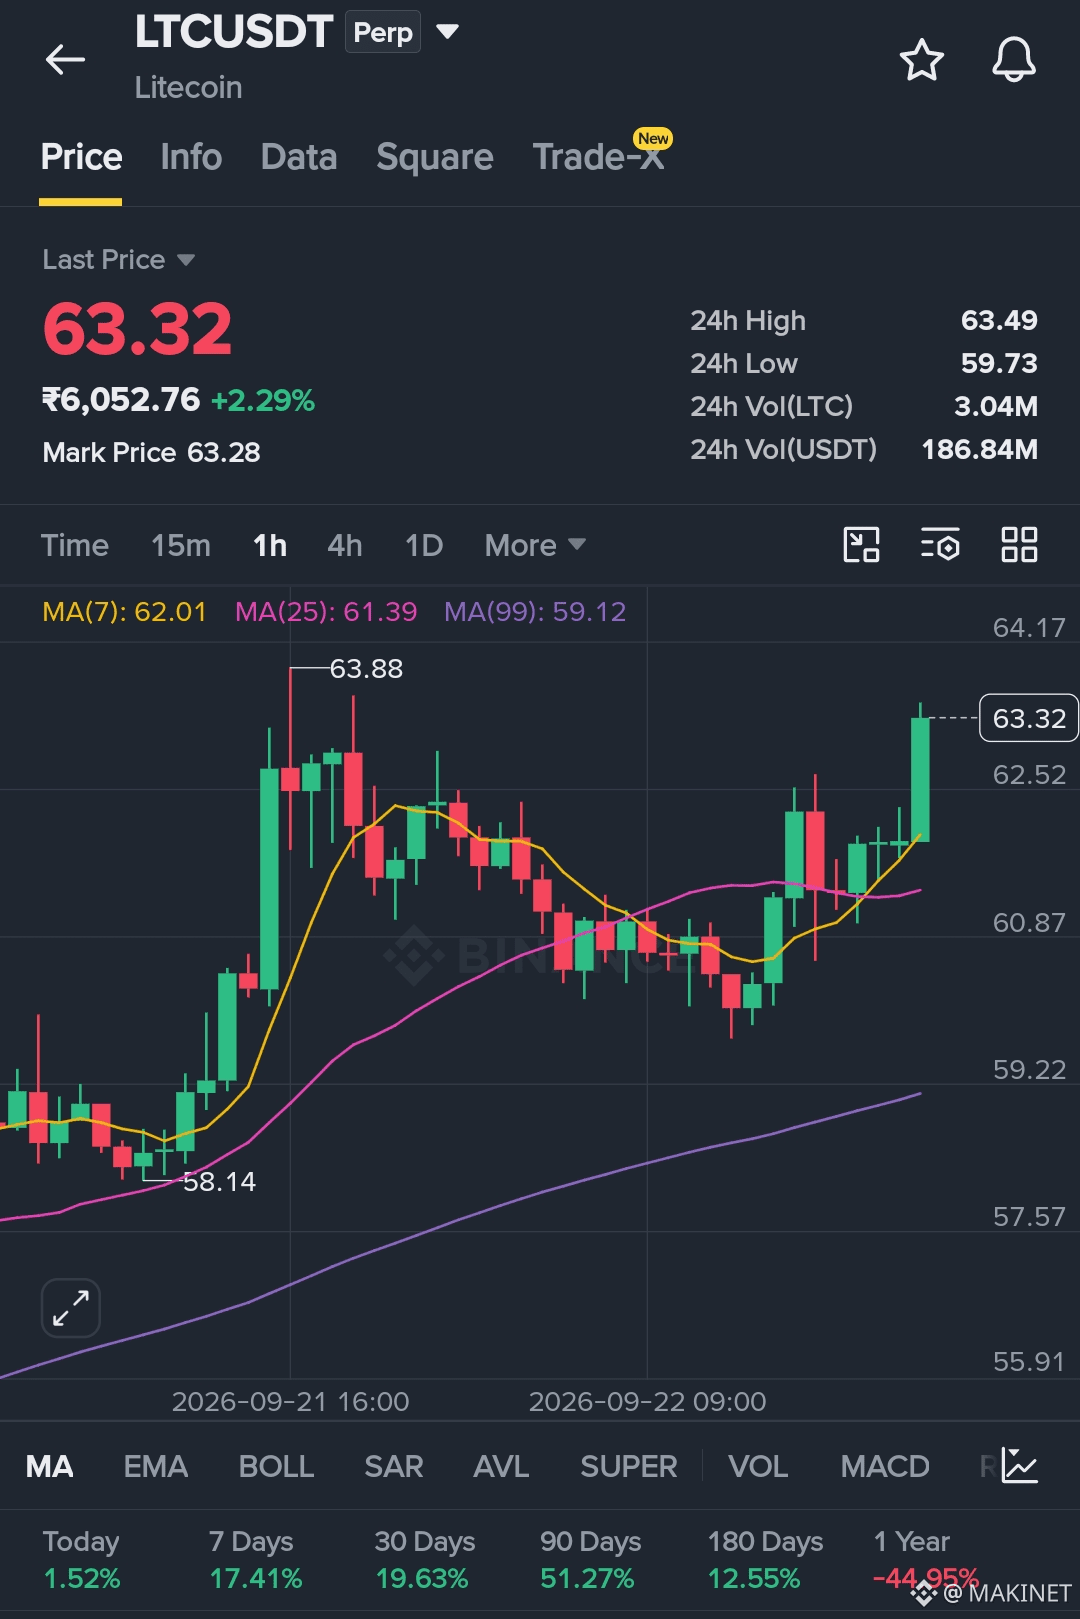
LONG $LTC
Entry: 62.69–62.97
Targets:
TP1: 65.03
TP2: 66.91
TP3: 69.11
Stop Loss: 59.58
Trade here 👇
{future}(LTCUSDT)
#AIStocksWhatNext #DogecoinRises15% #BNBMarketCapPassesBNYMellon #LTCPricePrediction #StrategyAdds950Bitcoin
LONG $LTC
Entry: 62.69–62.97
Targets:
TP1: 65.03
TP2: 66.91
TP3: 69.11
Stop Loss: 59.58
Trade here 👇
#AIStocksWhatNext #DogecoinRises15% #BNBMarketCapPassesBNYMellon #LTCPricePrediction #StrategyAdds950Bitcoin
Entry: 62.69–62.97
Targets:
TP1: 65.03
TP2: 66.91
TP3: 69.11
Stop Loss: 59.58
Trade here 👇
#AIStocksWhatNext #DogecoinRises15% #BNBMarketCapPassesBNYMellon #LTCPricePrediction #StrategyAdds950Bitcoin
66

·
--
Bullish
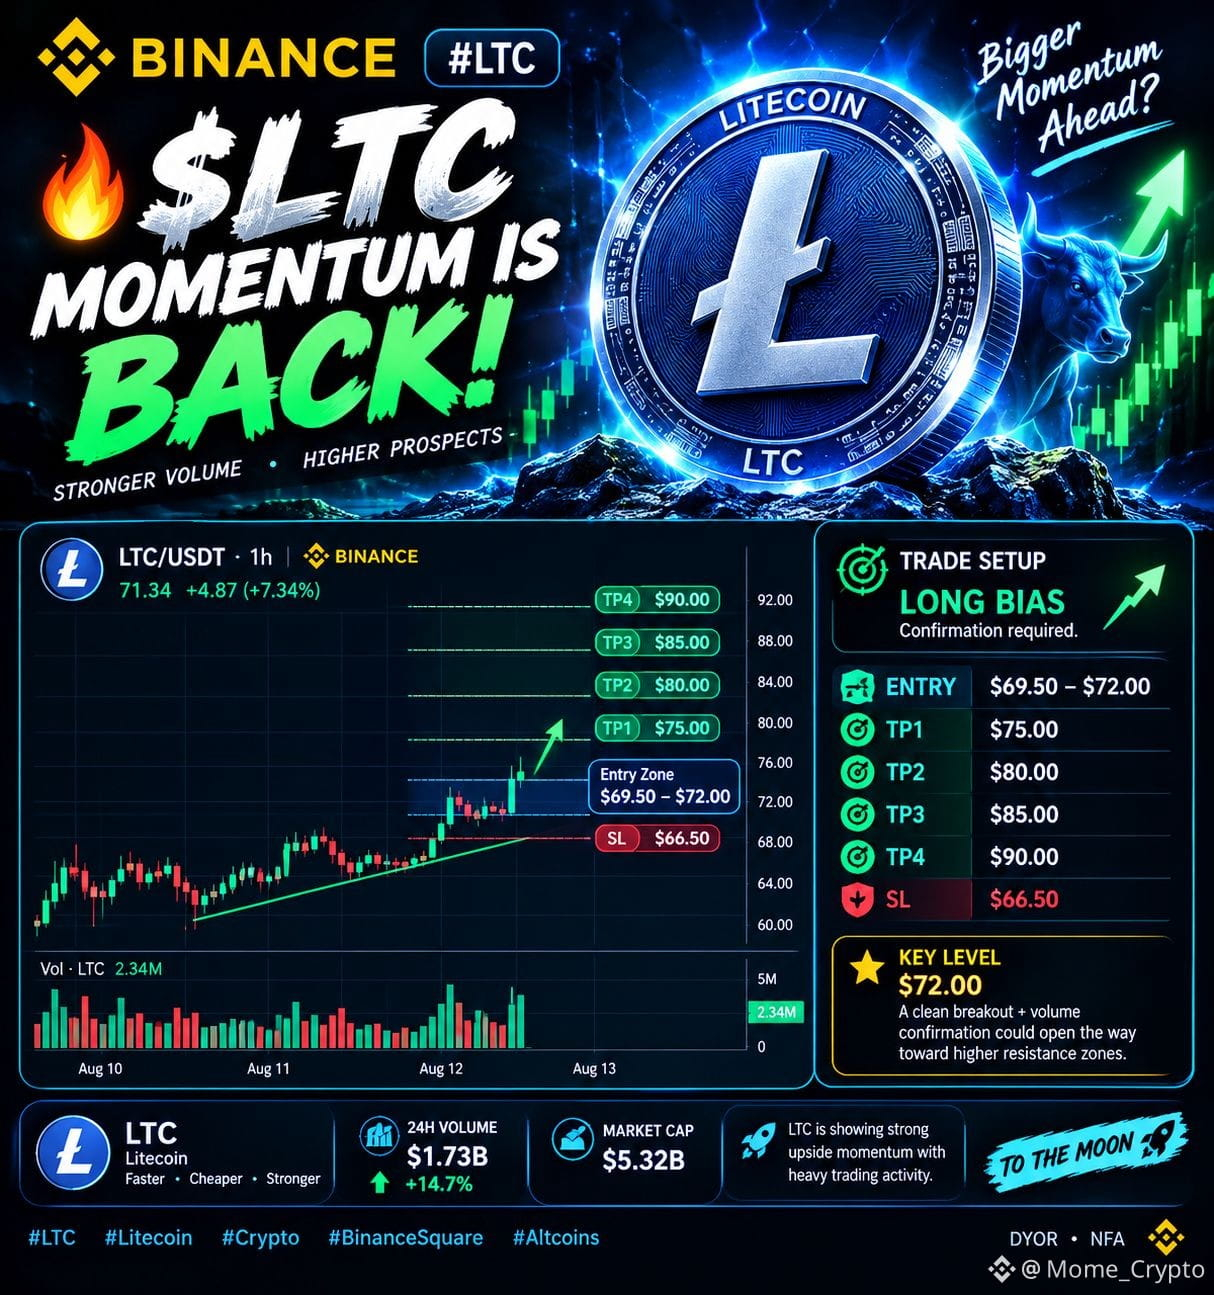
🔥 $LTC — MOMENTUM IS BACK!
LTC is showing strong upside momentum with heavy trading activity.
🟢 ENTRY: $69.50 – $72.00
🎯 TP1: $75
🎯 TP2: $80
🎯 TP3: $85
🎯 TP4: $90
🛑 SL: $66.50
Key level: $72
A clean breakout + volume confirmation could open the way toward higher resistance zones.
📊 Setup: LONG BIAS — confirmation required.
#LTC #Litecoin #Crypto #BinanceSquare #LTCPricePrediction
{future}(LTCUSDT)
🔥 $LTC — MOMENTUM IS BACK!
LTC is showing strong upside momentum with heavy trading activity.
🟢 ENTRY: $69.50 – $72.00
🎯 TP1: $75
🎯 TP2: $80
🎯 TP3: $85
🎯 TP4: $90
🛑 SL: $66.50
Key level: $72
A clean breakout + volume confirmation could open the way toward higher resistance zones.
📊 Setup: LONG BIAS — confirmation required.
#LTC #Litecoin #Crypto #BinanceSquare #LTCPricePrediction
LTC is showing strong upside momentum with heavy trading activity.
🟢 ENTRY: $69.50 – $72.00
🎯 TP1: $75
🎯 TP2: $80
🎯 TP3: $85
🎯 TP4: $90
🛑 SL: $66.50
Key level: $72
A clean breakout + volume confirmation could open the way toward higher resistance zones.
📊 Setup: LONG BIAS — confirmation required.
#LTC #Litecoin #Crypto #BinanceSquare #LTCPricePrediction
87
Log in to explore more content
Join global crypto users on Binance Square
⚡️ Get latest and useful information about crypto.
💬 Trusted by the world’s largest crypto exchange.
👍 Discover real insights from verified creators.
Email / Phone number
Trending Topics
1
#BTCRemainsUnderPressureAfterHawkishFOMCMinutes
39,038 views
543 Discussing
2
#AnthropicToDebutAfter$83IPOPricing
10,642 views
62 Discussing
3
#NvidiaBoardReportedlySplitOverHuang’sReturn
12,743 views
204 Discussing
4
#CanGTA6'sLaunchLiftTTWOShares?
6,700 views
142 Discussing
5
#FOMCMinutesHighlightAIDebtRisks
13,848 views
191 Discussing
6
#SouthKoreaPlansToLet3500ListedFirmsBuyBitcoin
14,828 views
240 Discussing
7
#AnthropicGrayMarketSharesPointTo22%To26%Gains
859 views
29 Discussing
8
#BitcoinSpotETFsSee$306MNetOutflows
0 views
1 Discussing
9
#TrumpAdministrationLaunchesProjectToCombatCybercrime
15 views
5 Discussing
10
#FedMinutesShowAlmostAllOfficialsExpectMoreHikes
3,956 views
56 Discussing