

#73k
73k
444 views
6 Discussing
Hot
Latest

·
--
Bullish
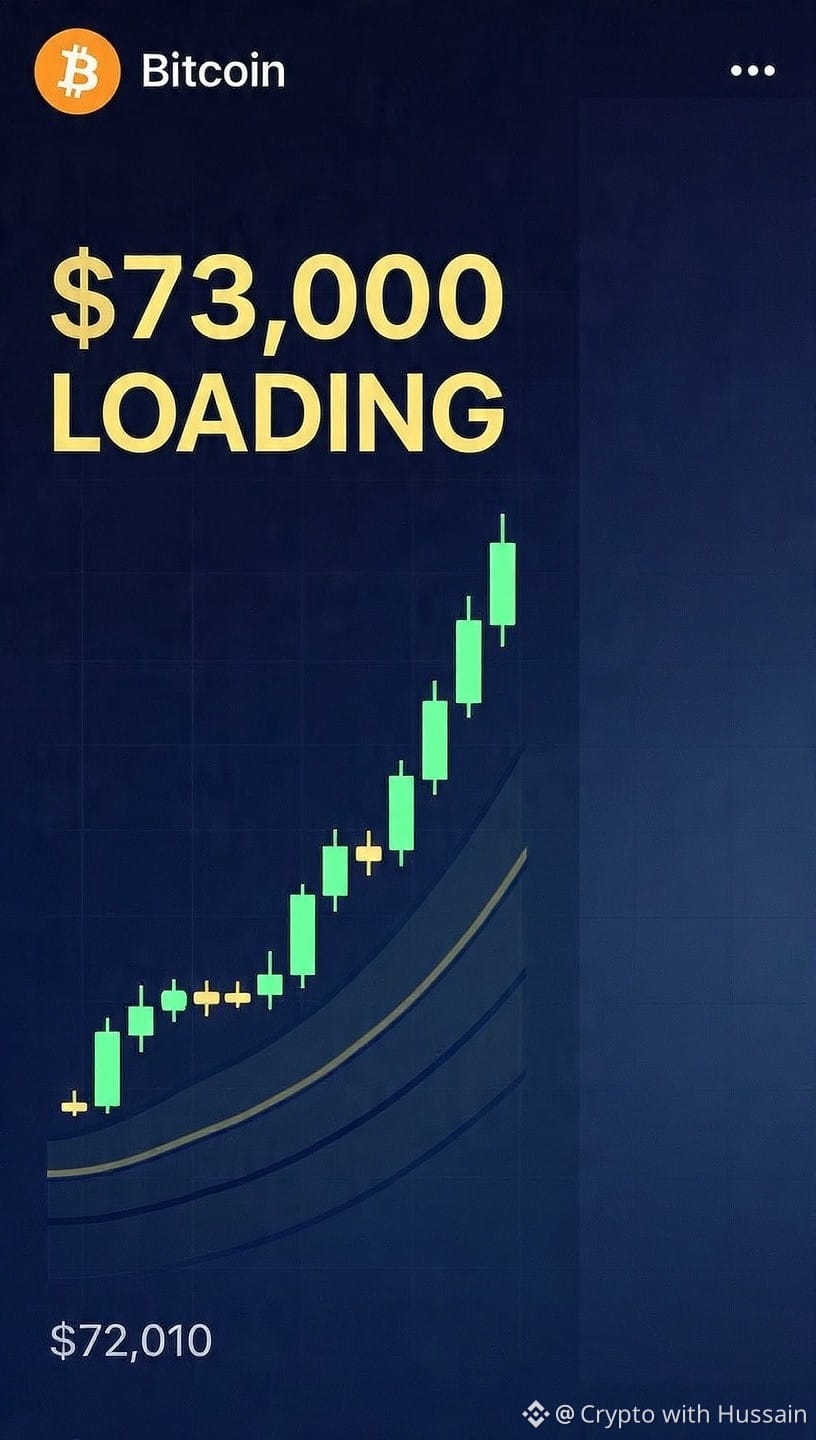
$BTC $73,000 is NEXT 🎯
Data doesn't lie:
Price: $72,010 | +10.79% on the day
24h High: $72,490 - we are just $510 away from $73K
Volume: 3.21B USDT - Massive buying pressure
All MAs aligned bullish:
MA7: $65,661 | MA25: $64,451 | MA99: $66,079
Price is well above all moving averages.
The dotted line on chart already shows $73,000.75 as next resistance.
If we break and hold $72,500, $73K touch is imminent.
Not financial advice. Manage risk.
#BTC #Bitcoin #73K #Crypto #BinanceSquare $BTC
90

·
--
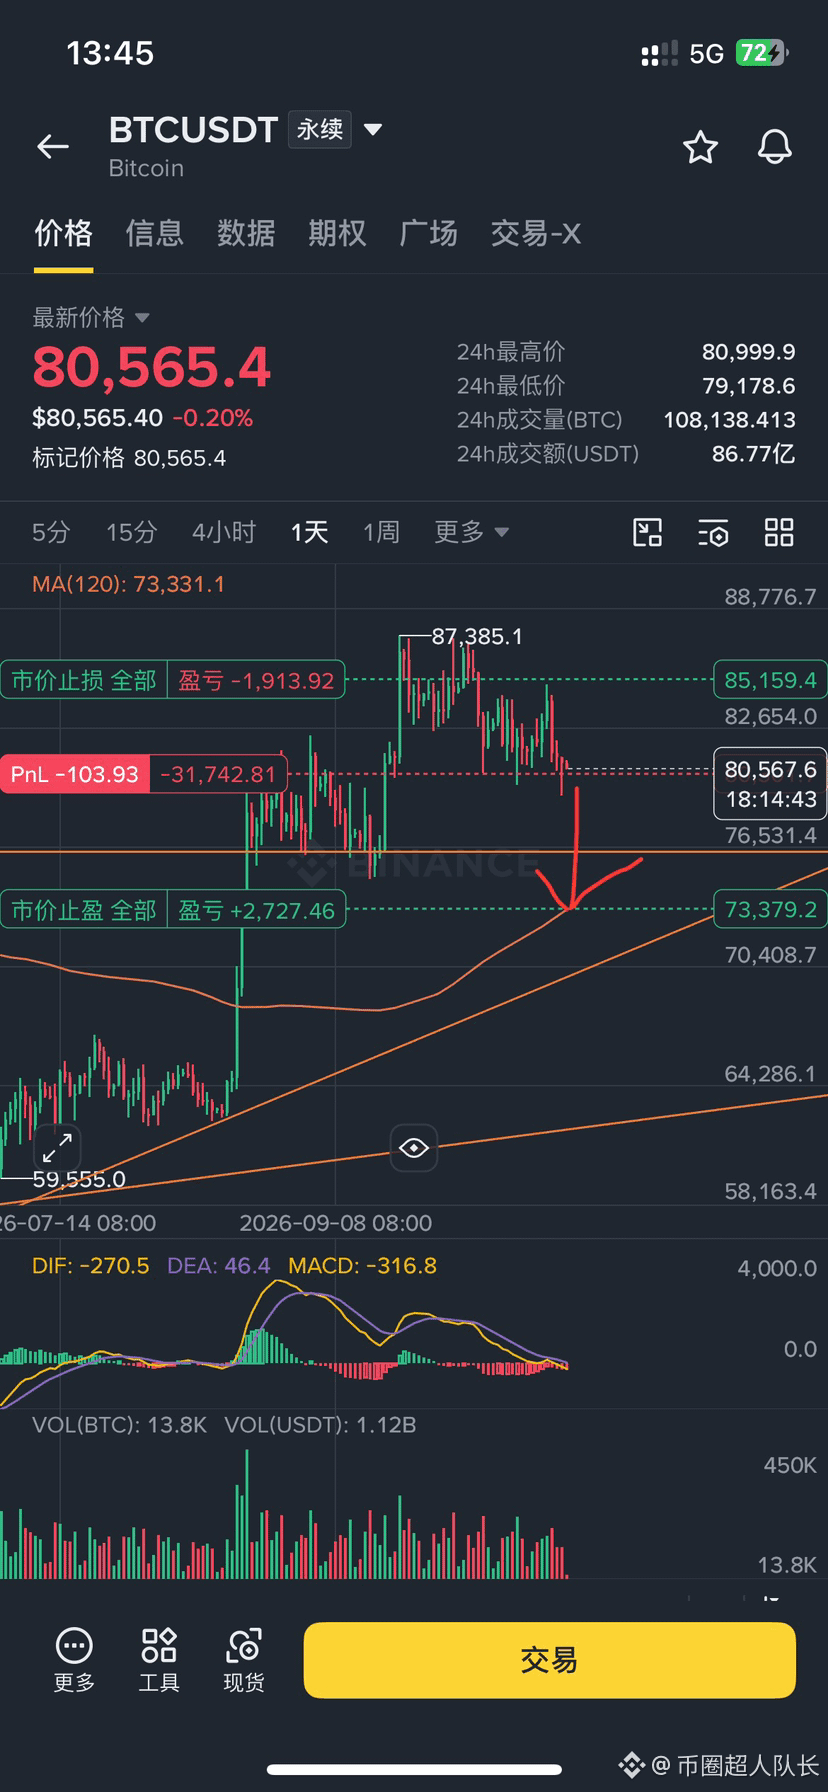
💥 BTC Midterm Election Playbook: Which Comes First, 73,000 or 85,000?
With the November 3 midterm elections approaching, market sentiment is starting to feel uneasy. Analyst Ali Charts dug up data from the past four cycles: 2010: -72%, 2014: -65%, 2018: -52%, 2022: -27%. Bitcoin has seen a significant pullback during every midterm election window, without exception.
Even more concerning is Q4 seasonality: in three of the past four midterm election years, the fourth quarter posted negative returns (2014: -16.7%, 2018: -42.16%, 2022: -14.75%). The only exception was 2010, when BTC was still in its very early days.
My take: This isn’t the time to bet on a direction. 73,000 is the line in the sand between bulls and bears: if it breaks and can’t reclaim that level, downside opens up; if it holds and we see signs of selling pressure drying up, that’s the time to build a position on the right side of the move. Ali Charts is waiting for a signal too—not trying to catch a falling knife ahead of time.
Do you think “history repeats itself” and BTC drops to 73,000, or is “this time different” and the correction is over above 80,000? Call your direction in the comments 👇
$BTC $ETH $SOL #BinanceSquare #比特币 #中期选举 #73k #BullsVsBears
深邃-:
你应该止损的,你还是太急躁了
7
1
496
Log in to explore more content
Join global crypto users on Binance Square
⚡️ Get latest and useful information about crypto.
💬 Trusted by the world’s largest crypto exchange.
👍 Discover real insights from verified creators.
Email / Phone number
Trending Topics
1
#BinancePick
2.9M views
151,338 Discussing
2
#EarningsSeason
5.2M views
25,748 Discussing
3
#AnthropicTTMRevenueGrewAbout1200%
16,221 views
315 Discussing
4
#AnthropicS1ExpectedToday
18,537 views
286 Discussing
5
#SouthKoreaReportedlyWeighsFourthCryptoTaxDelay
24,144 views
409 Discussing
6
#FranklinTempletonFilesForTwoDividendToBitcoinETFs
31,785 views
504 Discussing
7
#StrategyMSTRSurpassesNasdaqInMarketCap
24,548 views
366 Discussing
8
#CanadaProposesStablecoinRedemptionWithin3BusinessDays
1,134 views
34 Discussing
9
#ElectrumWalletBugLetRogueServersStealFunds
26,549 views
443 Discussing
10
#ArgentineCourtDismissesLIBRACaseAgainstMilei
40,447 views
550 Discussing