
#62
62
4,552 views
27 Discussing
Hot
Latest

$BTR Today’s dump and sell-off—I think it’s worth talking about properly.
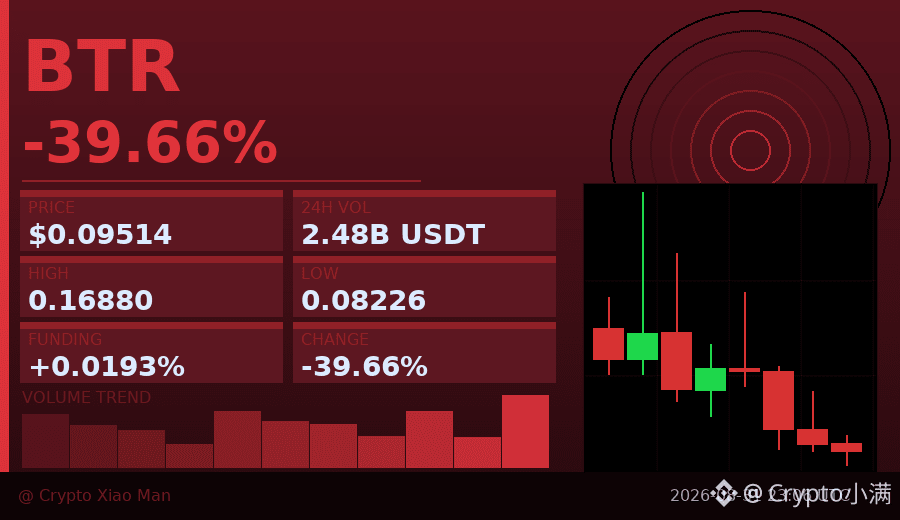
In 24 hours, it fell from 0.1688 to 0.08226, a drop of nearly -40%. This isn’t a normal pullback; it’s almost a halving.
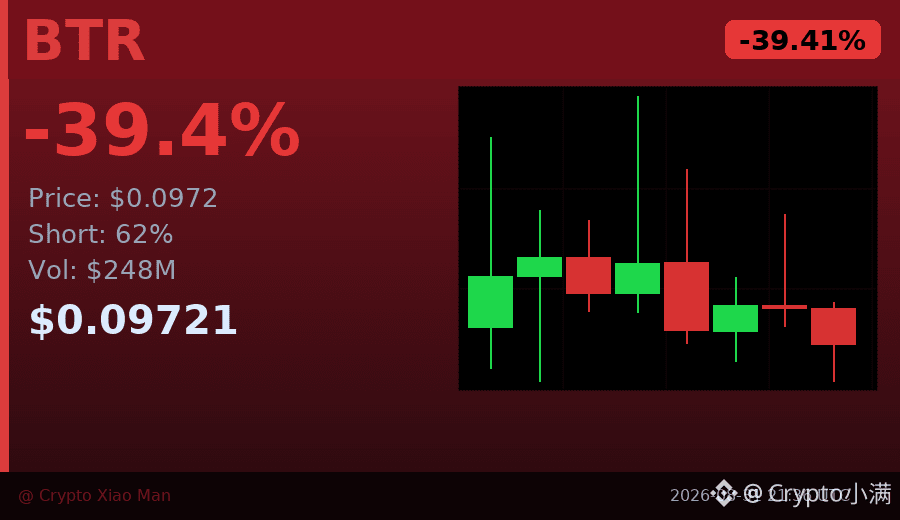
What’s interesting is this: currently, 62% of people in the market are holding no position (betting on the decline), while only 38% are holding long positions. This means most people have already taken the short side.
When bets are lopsided like that, price is actually more likely to move in the opposite direction—because the more short positions there are, once there’s even a modest rebound, many short traders are forced to stop out and add margin, which further pushes the price up. This phenomenon is called a “short squeeze.” It may or may not happen, but the probability can’t be ignored.
Also, the trading volume is 248 million USDT. For a small coin priced around 0.09, that’s a very large turnover. It indicates that a lot of capital is moving in and out at this level—not a quiet, empty dump, but rather that someone is stepping in to buy.
Recently, the K-line has been printing consecutive bearish candles, and the near-term momentum is indeed weak. But I’ll watch two things: first, whether support around 0.082 can hold (today’s low); second, whether the volume starts shrinking from a low level—volume contraction is what truly suggests selling pressure is decreasing.
If you don’t have a position, I don’t recommend chasing shorts. After all, 62% of people are already ahead of you on the short side.
$BTR #空头拥挤 #62%空仓
Click the small card below to quickly view the market👇
In 24 hours, it fell from 0.1688 to 0.08226, a drop of nearly -40%. This isn’t a normal pullback; it’s almost a halving.
What’s interesting is this: currently, 62% of people in the market are holding no position (betting on the decline), while only 38% are holding long positions. This means most people have already taken the short side.
When bets are lopsided like that, price is actually more likely to move in the opposite direction—because the more short positions there are, once there’s even a modest rebound, many short traders are forced to stop out and add margin, which further pushes the price up. This phenomenon is called a “short squeeze.” It may or may not happen, but the probability can’t be ignored.
Also, the trading volume is 248 million USDT. For a small coin priced around 0.09, that’s a very large turnover. It indicates that a lot of capital is moving in and out at this level—not a quiet, empty dump, but rather that someone is stepping in to buy.
Recently, the K-line has been printing consecutive bearish candles, and the near-term momentum is indeed weak. But I’ll watch two things: first, whether support around 0.082 can hold (today’s low); second, whether the volume starts shrinking from a low level—volume contraction is what truly suggests selling pressure is decreasing.
If you don’t have a position, I don’t recommend chasing shorts. After all, 62% of people are already ahead of you on the short side.
$BTR #空头拥挤 #62%空仓
Click the small card below to quickly view the market👇
$BTR Today’s drop—I've looked through the data, and there’s a detail worth mentioning.
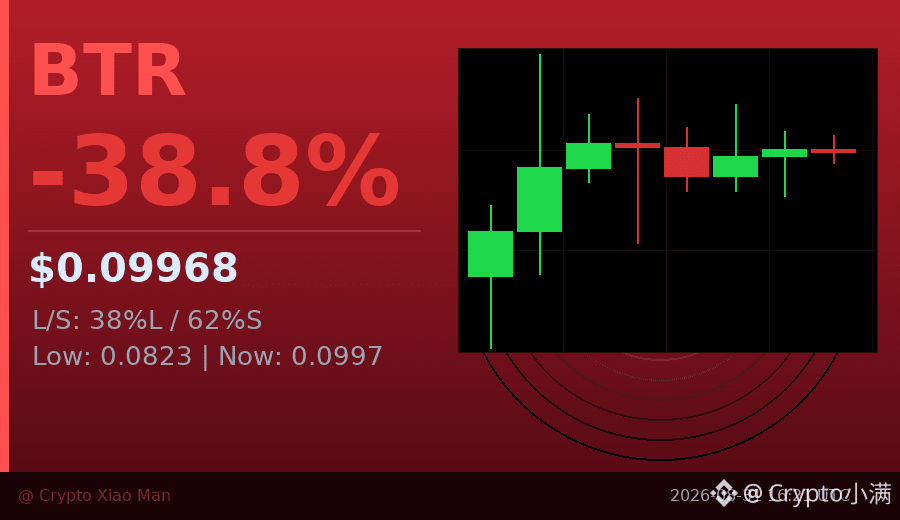
Within 24 hours, it fell from the high of 0.1688 to the low of 0.0823, dropping nearly 40%.
This isn’t unusual in itself; small-cap coins tend to be highly volatile.
But the interesting part is this—those betting on this coin to fall now account for 62%.
That means more than 60% of contract positions are shorting, while fewer than 40% are still holding long positions.
In this situation, there are two possible paths:
One is that the shorts remain in control and the price gradually grinds lower.
The other is that once the price rebounds even briefly, a large number of short positions—unable to withstand the pressure—get forced to close,
and this process reversely pushes the price up, creating a rapid “short squeeze” move.
Right now, the K-line candles are consecutively closing lower, and there’s no clear sign of a bottom yet.
If you hold this coin, for now I would focus on whether the low at 0.082 can hold.
Only if the trading volume clearly contracts and the price stabilizes at low levels would it be worth seriously reassessing.
At this point, the disagreement between longs and shorts is too big, so it’s not suitable to lightly guess the direction.
$BTR #空头挤压风险 #62% short
Click the small card below to quickly check the行情👇
Within 24 hours, it fell from the high of 0.1688 to the low of 0.0823, dropping nearly 40%.
This isn’t unusual in itself; small-cap coins tend to be highly volatile.
But the interesting part is this—those betting on this coin to fall now account for 62%.
That means more than 60% of contract positions are shorting, while fewer than 40% are still holding long positions.
In this situation, there are two possible paths:
One is that the shorts remain in control and the price gradually grinds lower.
The other is that once the price rebounds even briefly, a large number of short positions—unable to withstand the pressure—get forced to close,
and this process reversely pushes the price up, creating a rapid “short squeeze” move.
Right now, the K-line candles are consecutively closing lower, and there’s no clear sign of a bottom yet.
If you hold this coin, for now I would focus on whether the low at 0.082 can hold.
Only if the trading volume clearly contracts and the price stabilizes at low levels would it be worth seriously reassessing.
At this point, the disagreement between longs and shorts is too big, so it’s not suitable to lightly guess the direction.
$BTR #空头挤压风险 #62% short
Click the small card below to quickly check the行情👇
To be honest, today’s trend for $BTR is kind of interesting—it’s down by nearly 40%, but over the past 8 hours it has actually been moving back.
First, let’s talk about what happened: in the past 24 hours, $BTR was dumped from the high point of 0.1688 all the way down to 0.0823—a drop on the order of a halving. Trading volume of 25.6 billion (in shares/turnover) was pushed out, and it’s pretty clear that someone is aggressively distributing.
But pay attention to the current long/short positioning: 62% of people are betting on further downside, while only 38% are going long.
This situation is a bit like a “slingshot” move—when almost everyone is standing on the same side betting that it will keep falling, and the price doesn’t cooperate by continuing to drop, the reversal can trigger a chain reaction of “forced surrender.” Those who bet on the fall have to close their positions by buying back, which in turn helps push the price higher.
More subtly, the candlestick structure over the recent 8 hours has already been strengthening: the lows are getting higher, which suggests the selling pressure from the dump is weakening, and bargain hunters are starting to enter.
This doesn’t mean a rebound is guaranteed, but the combination of “after a big sell-off, short positioning is crowded + short-term strength” has often historically led to a quick short-squeeze—i.e., forcing shorts to give up and driving the price up rapidly in the short term.
As of now, if it can hold steady around 0.1, short-side pressure will keep growing. Conversely, if it breaks 0.082 again, then the shorts are right—and this rebound will be a fake.
I’ll be watching the key integer level at 0.10 to see who breaks first between longs and shorts.
$BTR #轧空行情 #62% shorts
Click the small card below to quickly view the quote 👇
First, let’s talk about what happened: in the past 24 hours, $BTR was dumped from the high point of 0.1688 all the way down to 0.0823—a drop on the order of a halving. Trading volume of 25.6 billion (in shares/turnover) was pushed out, and it’s pretty clear that someone is aggressively distributing.
But pay attention to the current long/short positioning: 62% of people are betting on further downside, while only 38% are going long.
This situation is a bit like a “slingshot” move—when almost everyone is standing on the same side betting that it will keep falling, and the price doesn’t cooperate by continuing to drop, the reversal can trigger a chain reaction of “forced surrender.” Those who bet on the fall have to close their positions by buying back, which in turn helps push the price higher.
More subtly, the candlestick structure over the recent 8 hours has already been strengthening: the lows are getting higher, which suggests the selling pressure from the dump is weakening, and bargain hunters are starting to enter.
This doesn’t mean a rebound is guaranteed, but the combination of “after a big sell-off, short positioning is crowded + short-term strength” has often historically led to a quick short-squeeze—i.e., forcing shorts to give up and driving the price up rapidly in the short term.
As of now, if it can hold steady around 0.1, short-side pressure will keep growing. Conversely, if it breaks 0.082 again, then the shorts are right—and this rebound will be a fake.
I’ll be watching the key integer level at 0.10 to see who breaks first between longs and shorts.
$BTR #轧空行情 #62% shorts
Click the small card below to quickly view the quote 👇
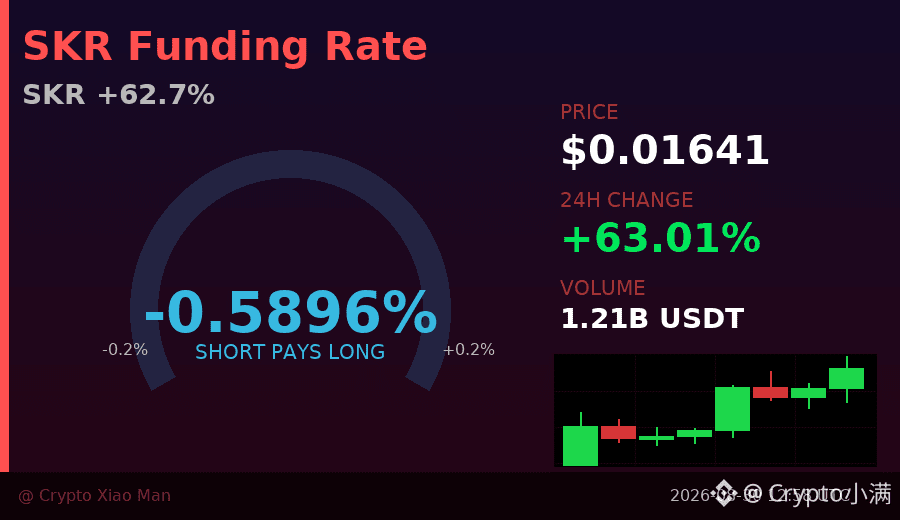
Negative funding rate + price surges 62%—this setup is a bit unusual.
Today SKR is up 62.7%, but the funding rate is -0.59%. Normally, during a breakout rally, longs should be paying shorts. But the opposite is happening, which suggests that shorts opened a lot of positions during this pump—and got trapped.
Now longs are 59% and shorts 41%. It looks like longs are in control, but shorts are still not a small share. If the price holds up, these shorts will eventually stop-loss, and then it can flip into buy pressure pushing the price higher.
Trading volume is also astonishing—today saw 120 million U. Combined with the low of 0.0097 and the high of 0.0169, that’s roughly a 75% intraday swing. Volatility is extremely high.
In terms of candlesticks: three consecutive hourly bullish candles. Short-term momentum is still there, but the price has pulled back from 0.0169 to around 0.0163—someone is de-risking at the highs.
In a rally driven by a negative funding rate, the risk is: if shorts refuse to give up, the tug-of-war could become intense; if shorts get liquidated in a concentrated wave, there could be another sharp spike upward. Either direction is possible—position management matters more than trying to predict the direction.
For retail investors, take note: after a 62% surge, chasing in can be dangerous. A modest pullback could easily mean a 20–30% drop. Losses can come faster than gains.
$SKR #资金费率异常 #62% surge
Click the small card below to quickly check the行情👇
Today SKR is up 62.7%, but the funding rate is -0.59%. Normally, during a breakout rally, longs should be paying shorts. But the opposite is happening, which suggests that shorts opened a lot of positions during this pump—and got trapped.
Now longs are 59% and shorts 41%. It looks like longs are in control, but shorts are still not a small share. If the price holds up, these shorts will eventually stop-loss, and then it can flip into buy pressure pushing the price higher.
Trading volume is also astonishing—today saw 120 million U. Combined with the low of 0.0097 and the high of 0.0169, that’s roughly a 75% intraday swing. Volatility is extremely high.
In terms of candlesticks: three consecutive hourly bullish candles. Short-term momentum is still there, but the price has pulled back from 0.0169 to around 0.0163—someone is de-risking at the highs.
In a rally driven by a negative funding rate, the risk is: if shorts refuse to give up, the tug-of-war could become intense; if shorts get liquidated in a concentrated wave, there could be another sharp spike upward. Either direction is possible—position management matters more than trying to predict the direction.
For retail investors, take note: after a 62% surge, chasing in can be dangerous. A modest pullback could easily mean a 20–30% drop. Losses can come faster than gains.
$SKR #资金费率异常 #62% surge
Click the small card below to quickly check the行情👇
27% up vs 72% empty——that number made me pause.
BTR is up more than 62% today, but in the position distribution, the number of people shorting is nearly 3 times those going long.
This is textbook “short squeeze”: most people bet on it going down, and then the price flips upward by a factor of one. Shorts are forced to close and chase the rally, pushing the price higher and higher.
Looking at the candlesticks, the high nearly doubled—from today’s low of 0.077 up to 0.1796. Trading volume surged to $1.17 billion, and turnover is extremely active.
The current funding rate is 0.026%, which is mildly bullish, suggesting longs haven’t reached an extremely euphoric state yet—but three consecutive hourly bearish candles in a row mean short-term momentum is cooling.
The question now is: has the short side already been pretty much flushed out? Or is there still a batch of shorts holding on at higher levels?
This kind of market isn’t suitable for chasing, but it’s great for observing—it’s showing how market sentiment can switch from one extreme to another in a blink.
$BTR #空头挤压 #62% surge
Click the small card below to quickly view the行情👇
BTR is up more than 62% today, but in the position distribution, the number of people shorting is nearly 3 times those going long.
This is textbook “short squeeze”: most people bet on it going down, and then the price flips upward by a factor of one. Shorts are forced to close and chase the rally, pushing the price higher and higher.
Looking at the candlesticks, the high nearly doubled—from today’s low of 0.077 up to 0.1796. Trading volume surged to $1.17 billion, and turnover is extremely active.
The current funding rate is 0.026%, which is mildly bullish, suggesting longs haven’t reached an extremely euphoric state yet—but three consecutive hourly bearish candles in a row mean short-term momentum is cooling.
The question now is: has the short side already been pretty much flushed out? Or is there still a batch of shorts holding on at higher levels?
This kind of market isn’t suitable for chasing, but it’s great for observing—it’s showing how market sentiment can switch from one extreme to another in a blink.
$BTR #空头挤压 #62% surge
Click the small card below to quickly view the行情👇
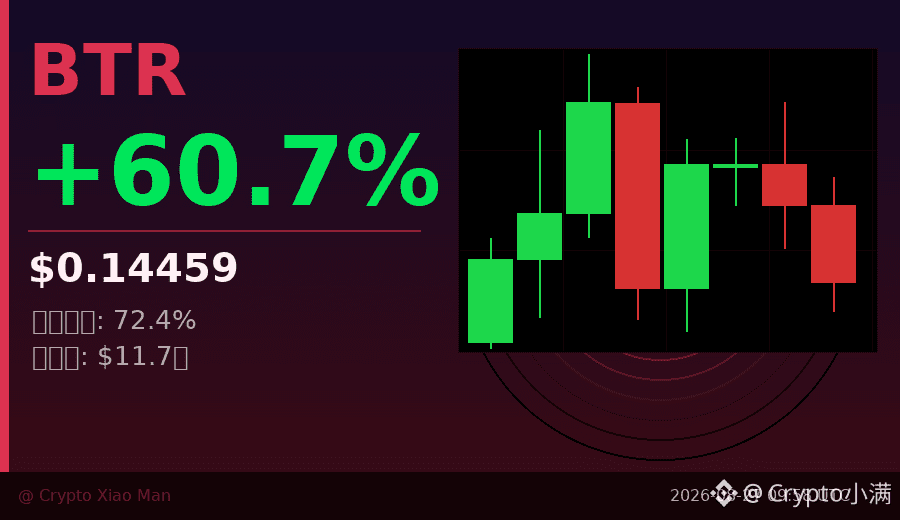

🚨 Trade Setup | PEPE
Direction: Bullish (Long)
📊 Why this trade:
- 24h breakout +14.9% off a month-long flat base (30d only +1.6%)
- Volume surge: Vol/MCap 24.9% — real capital, not thin liquidity
- Sentiment 63.6% positive, top meme liquidity ($1.25B MCap, rank #62)
🔥 Key insight:
This is NOT a slow move — momentum phase just started.
🎯 Trade Plan:
Entry: $0.00000297 (current zone)
Target: $0.00000318 (+7%)
Stop: $0.00000288 (-3%)
⚖️ Risk/Reward: ~2.33:1
⚠️ Risk: Medium
If price loses $0.00000288, momentum likely invalidated.
(Not financial advice)
Direction: Bullish (Long)
📊 Why this trade:
- 24h breakout +14.9% off a month-long flat base (30d only +1.6%)
- Volume surge: Vol/MCap 24.9% — real capital, not thin liquidity
- Sentiment 63.6% positive, top meme liquidity ($1.25B MCap, rank #62)
🔥 Key insight:
This is NOT a slow move — momentum phase just started.
🎯 Trade Plan:
Entry: $0.00000297 (current zone)
Target: $0.00000318 (+7%)
Stop: $0.00000288 (-3%)
⚖️ Risk/Reward: ~2.33:1
⚠️ Risk: Medium
If price loses $0.00000288, momentum likely invalidated.
(Not financial advice)

Seeing $PEPE 24 hours +11.91%, it’s easy to treat it as a meme season spark again. But if you flatten the timeline, this price is exactly the same as a month ago—the 30-day performance is still -1.16%. This latest rise looks more like a pulse after a period of sideways consolidation with shrinking volume; it’s hardly a breakout.
The volume that truly supported this move also shows something unusual within the 30-day window: in mid-August, trading volume shrank to around 50–60M, then suddenly jumped to 220M on August 20. It’s true that market participation has rebounded from a low point—but a one-day volume spike and steady “feeding” over time are two different things. For holders, what this level really tests is patience: don’t chase for fear of missing the move; if you do chase, fear it may just be an oversold bounce. The current market cap of $PEPE is 1.21B, ranked #62, still -89.71% away from ATH, and down more than 70% over the past year. At this level, every rebound has to face the realization pressure from trapped longs. I won’t declare a trend reversal just because of a single big bullish day; what really needs confirmation is whether the following volume can keep up.
So, whether you’re bullish or bearish, the recommendation is to watch the same data: over the next 3 days, can $PEPE ’s 24-hour trading volume stay consistently above 200M? Bulls will say this is the first step of capital returning; bears will argue that as long as it slips back below 100M, this rebound is just noise. This disagreement doesn’t need emotion—within the next three days, the chart will give you the answer. Which one is your call?
The volume that truly supported this move also shows something unusual within the 30-day window: in mid-August, trading volume shrank to around 50–60M, then suddenly jumped to 220M on August 20. It’s true that market participation has rebounded from a low point—but a one-day volume spike and steady “feeding” over time are two different things. For holders, what this level really tests is patience: don’t chase for fear of missing the move; if you do chase, fear it may just be an oversold bounce. The current market cap of $PEPE is 1.21B, ranked #62, still -89.71% away from ATH, and down more than 70% over the past year. At this level, every rebound has to face the realization pressure from trapped longs. I won’t declare a trend reversal just because of a single big bullish day; what really needs confirmation is whether the following volume can keep up.
So, whether you’re bullish or bearish, the recommendation is to watch the same data: over the next 3 days, can $PEPE ’s 24-hour trading volume stay consistently above 200M? Bulls will say this is the first step of capital returning; bears will argue that as long as it slips back below 100M, this rebound is just noise. This disagreement doesn’t need emotion—within the next three days, the chart will give you the answer. Which one is your call?

🔥 Trending Today
Top searched coins on CoinGecko right now:
$BTW (Bitway) — rank #45.
$PUMP (Pump.fun) — rank #62.
$SOL (Solana) — rank #7.
Trending ≠ recommendation. Always DYOR. #Crypto
Top searched coins on CoinGecko right now:
$BTW (Bitway) — rank #45.
$PUMP (Pump.fun) — rank #62.
$SOL (Solana) — rank #7.
Trending ≠ recommendation. Always DYOR. #Crypto
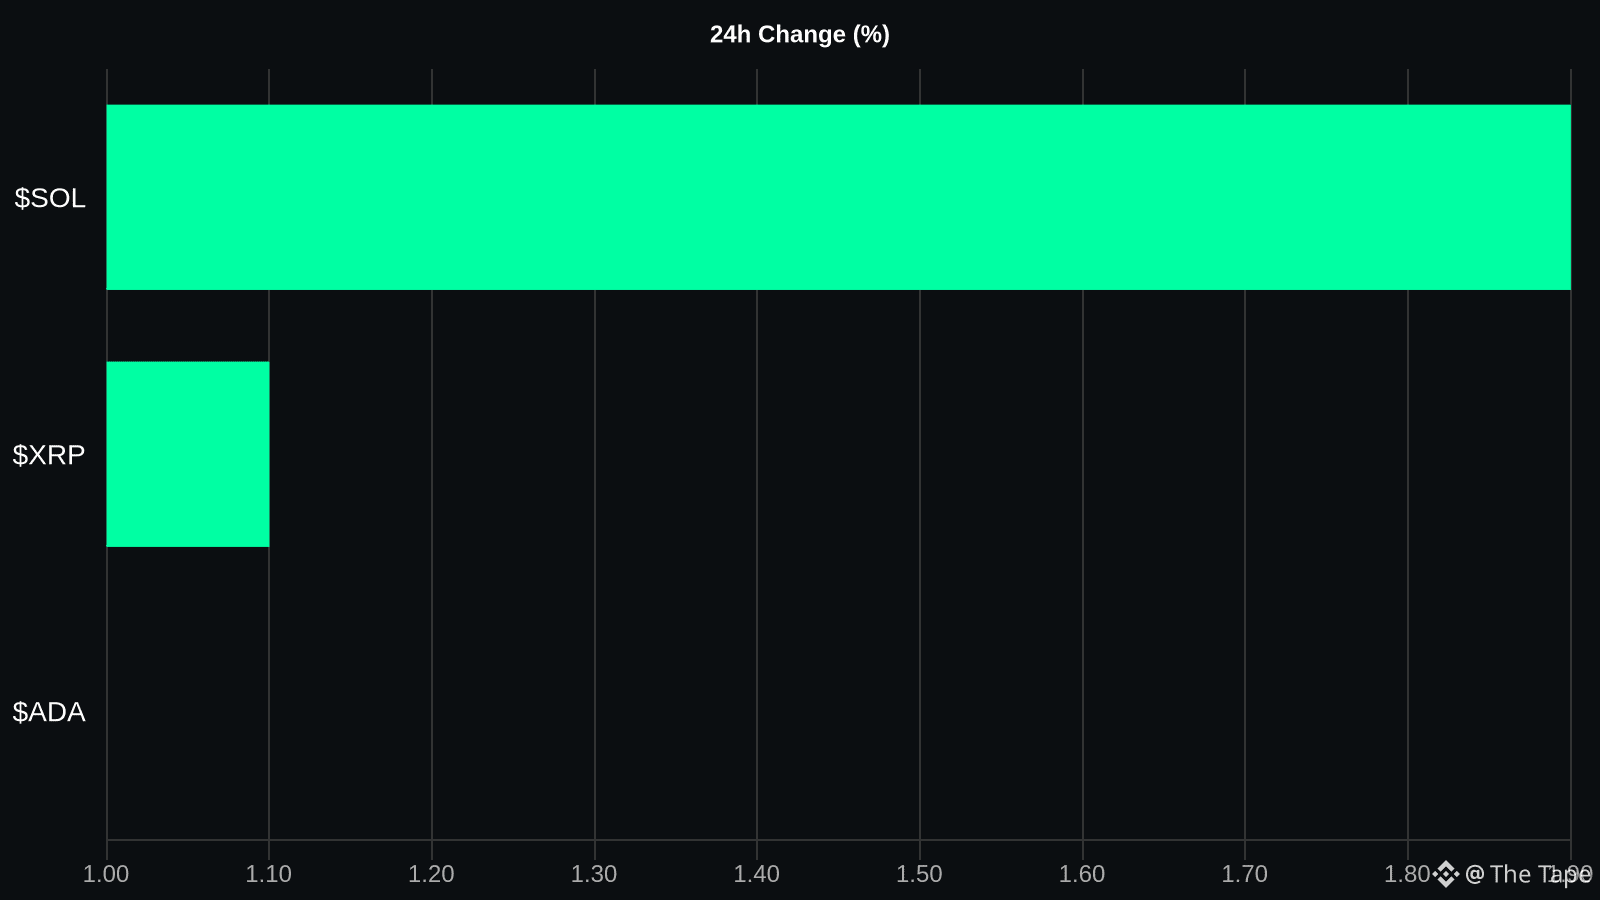


I’ve been watching CoinGecko’s trending board and the top movers grabbed my attention. 🚀 Hyperliquid (HYPE) surged +14%, Solana (SOL) climbed +9%, and Bitcoin (BTC) added +2% today.
Next on my list, Pump.fun (PUMP) jumped +11% while Bitway (BTW) rallied +8%, and Venice Token (VVV) nudged +5% after a fresh partnership announcement. 📈 Their market‑cap ranks—#62, #51, and #88—prove that mid‑tier projects can still spark rapid interest.
I’m also eyeing GALA (GALA), down –3% but still a #324 player, and I expect a bounce soon. 🔥 I’ll rebalance my watchlist this week to catch both growth spikes and corrections. 📊
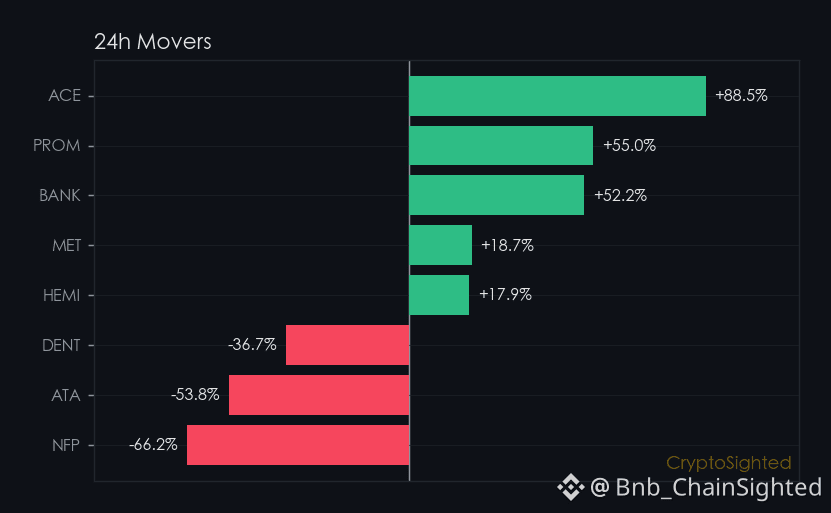
$ACE , $HEMI , $ACE
Next on my list, Pump.fun (PUMP) jumped +11% while Bitway (BTW) rallied +8%, and Venice Token (VVV) nudged +5% after a fresh partnership announcement. 📈 Their market‑cap ranks—#62, #51, and #88—prove that mid‑tier projects can still spark rapid interest.
I’m also eyeing GALA (GALA), down –3% but still a #324 player, and I expect a bounce soon. 🔥 I’ll rebalance my watchlist this week to catch both growth spikes and corrections. 📊
$ACE , $HEMI , $ACE
In a 30-day (plus 574%) scale, this 24-hour gain of +34% suddenly becomes far less story-worthy. $BTW what really makes people stop and think isn’t how much it’s up today, but that it was still at $0.3987 yesterday and by today it has already touched $0.4152—just 2.1% away from ATH. A market cap of $1.1B and rank #62: this size is no longer at the stage of being "discovered"; it’s at the stage of being "priced in".
Coming from 0.063 on July 19, it has turned sixfold in 30 days. The 51M-spike volume candle on August 13 basically announced the slope of the main upswing. In recent days, volume has stayed within the 24M–51M range without shrinking—which is a good sign. But what I care about more is another issue: above 0.4, the chip distribution has no historically trapped supply, which means there are no reference coordinates to anchor expectations. Moving upward is pure exploration; looking down, any support can only be found once it forms by itself.
Where is the risk hiding? In the slope. The steepness of a +574% move over 30 days means that any down candle on shrinking volume could be interpreted as a pause in the trend—not a normal pullback. If volume later breaks below 20M and the price closes below 0.35, then the short-term thesis will have to be rewritten.
So I want to ask you: on $BTW , are you taking a day-trade stance or a swing-trade stance? Day traders watch for hour-level volume/price alignment; swing traders care whether the 0.35 line can become a pullback confirmation zone. These two answers correspond to completely different trade execution and patience.
Coming from 0.063 on July 19, it has turned sixfold in 30 days. The 51M-spike volume candle on August 13 basically announced the slope of the main upswing. In recent days, volume has stayed within the 24M–51M range without shrinking—which is a good sign. But what I care about more is another issue: above 0.4, the chip distribution has no historically trapped supply, which means there are no reference coordinates to anchor expectations. Moving upward is pure exploration; looking down, any support can only be found once it forms by itself.
Where is the risk hiding? In the slope. The steepness of a +574% move over 30 days means that any down candle on shrinking volume could be interpreted as a pause in the trend—not a normal pullback. If volume later breaks below 20M and the price closes below 0.35, then the short-term thesis will have to be rewritten.
So I want to ask you: on $BTW , are you taking a day-trade stance or a swing-trade stance? Day traders watch for hour-level volume/price alignment; swing traders care whether the 0.35 line can become a pullback confirmation zone. These two answers correspond to completely different trade execution and patience.
Staring at the price $PEPE for too long, people can develop a kind of illusion: it seems like it can’t go down anymore. But what really worries people are those who missed the move—if they don’t jump in now, they fear that one day it will suddenly spike on heavy volume and they’ll have to watch others profit. If they do jump in now, and it keeps grinding lower, then they don’t know how long this money will be locked up. Chasing it or not chasing it each comes with its own cost—you have to weigh it yourself.
The chart is actually quite straightforward. Over the past month, the price has stayed right around $0.000003. Meanwhile, trading volume has steadily shrunk—from $313M on July 27 to around $50M in the last couple of days. The price is moving sideways and liquidity is drying up; neither bulls nor bears want to be the first to make a move. But this is not a reason to claim “bottom confirmation.” $PEPE is still -90.70% away from its ATH, down -75.99% over the year, and its market cap remains at $1.10B, ranked #62. This level isn’t “cheap”—it used to be too expensive.
What I care about more is this: even after volume has contracted to this extent, there is still about $55M in daily trading turnover, which suggests the existing players haven’t all exited. Meme coins rely on sentiment and liquidity. Without fresh capital entering, any rebound is just noise. So what truly needs confirmation is trading volume—not the price. If $PEPE can next expand volume back to over $200M while not breaking below $0.000003, then it earns the right to discuss a reversal. If it continues to grind lower on shrinking volume, then this is only the middle of the mountainside.
Finally, a question about choice. Suppose over the next two weeks, $PEPE continues to trade flat at $0.000003, and the trading volume still shows no improvement—what would you do with your current position or plan? A. Wait for volume confirmation before considering entry; B. Test with a small position now, betting it’s the bottom; C. Completely give up and wait for it to develop a trend. My answer leans toward A, but it isn’t the only solution.
The chart is actually quite straightforward. Over the past month, the price has stayed right around $0.000003. Meanwhile, trading volume has steadily shrunk—from $313M on July 27 to around $50M in the last couple of days. The price is moving sideways and liquidity is drying up; neither bulls nor bears want to be the first to make a move. But this is not a reason to claim “bottom confirmation.” $PEPE is still -90.70% away from its ATH, down -75.99% over the year, and its market cap remains at $1.10B, ranked #62. This level isn’t “cheap”—it used to be too expensive.
What I care about more is this: even after volume has contracted to this extent, there is still about $55M in daily trading turnover, which suggests the existing players haven’t all exited. Meme coins rely on sentiment and liquidity. Without fresh capital entering, any rebound is just noise. So what truly needs confirmation is trading volume—not the price. If $PEPE can next expand volume back to over $200M while not breaking below $0.000003, then it earns the right to discuss a reversal. If it continues to grind lower on shrinking volume, then this is only the middle of the mountainside.
Finally, a question about choice. Suppose over the next two weeks, $PEPE continues to trade flat at $0.000003, and the trading volume still shows no improvement—what would you do with your current position or plan? A. Wait for volume confirmation before considering entry; B. Test with a small position now, betting it’s the bottom; C. Completely give up and wait for it to develop a trend. My answer leans toward A, but it isn’t the only solution.
Trending on CoinGecko: $HYPE (rank #9), $ONDO (rank #42), $PUMP (rank #62). These coins are getting attention, possibly due to their name recognition and market presence. Which one are you watching? NFA. Always DYOR. #Crypto
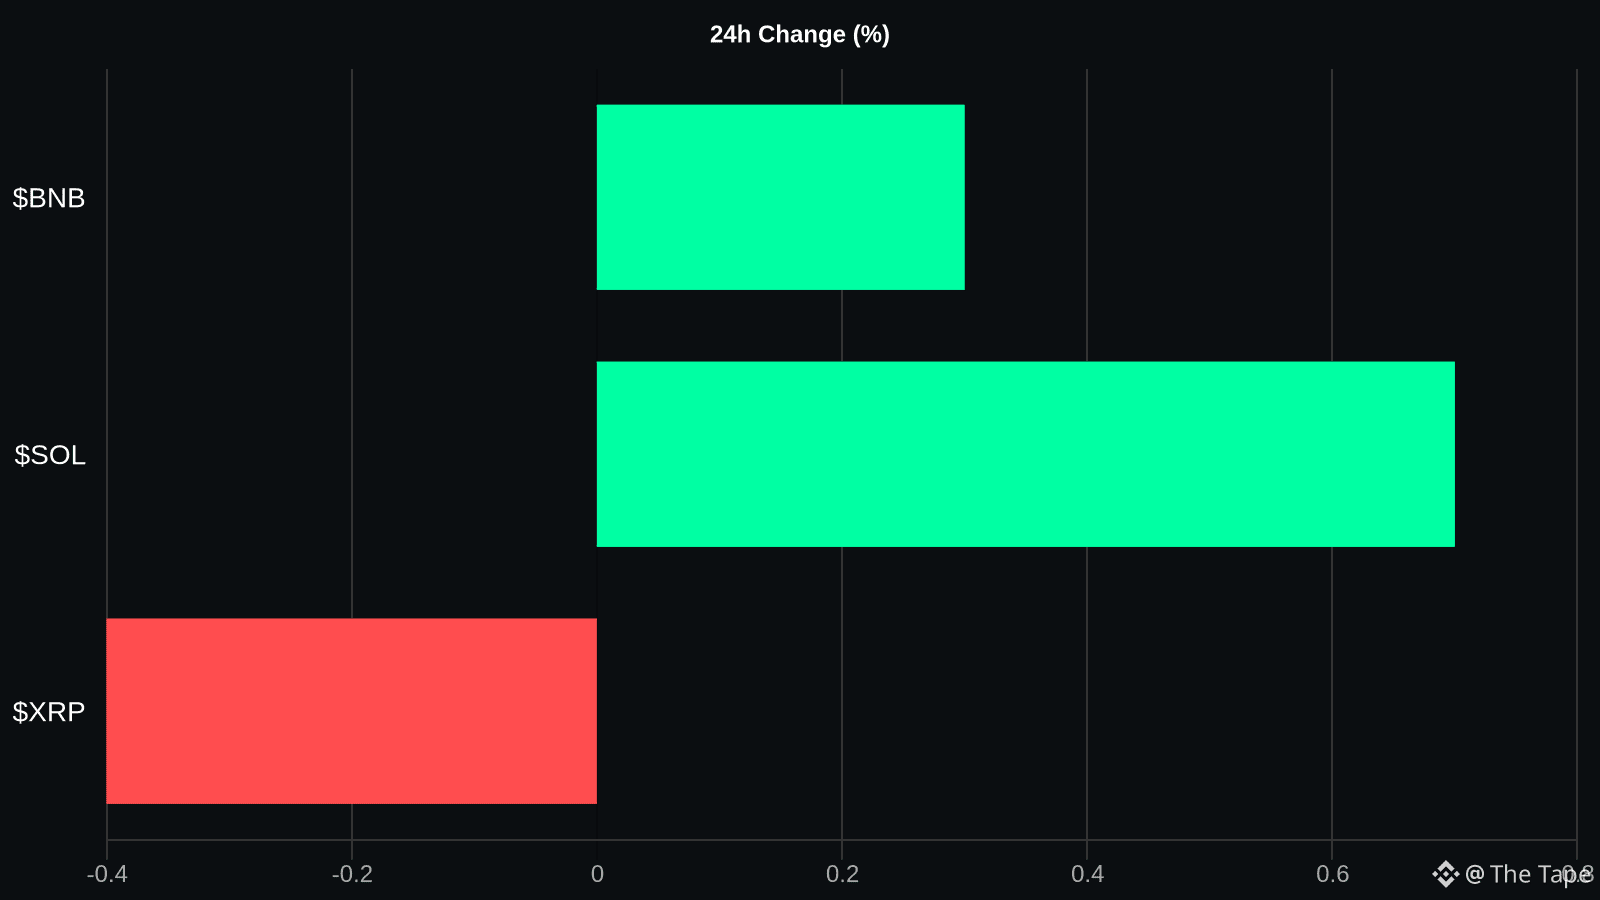

A $30M futures bet on $DOT sits at 0.01% funding rate - but 0.10% in cumulative cost over 21 periods. What’s the real story here?
DOT’s futures market is holding steady, with 35.8 million tokens locked in perpetual contracts - about $30 million at current prices. That’s a sizeable bet, but the funding rate is near zero. Still, the cost of leverage isn’t just a single point - it’s been adding up over 21 periods, hitting ↑0.10% in total. That’s not insignificant. It’s a sign that traders are paying for leverage, but not necessarily in a way that’s screaming bullish or bearish conviction.
And the funding rate? It’s currently at ↑0.01%, which is slightly above the 21-period average of ↑0.0047%. But it’s still low. That’s not a sign of panic, but it’s also not a sign of explosive demand. The balance is tight. Traders are paying for leverage, but not in a way that’s pushing the price sharply higher. It’s a quiet, measured bet - not a scream.
Checkpoint: If DOT’s 21-period funding rate stays above ↑0.0047% this week, the leverage cost story holds - but if it drops below, the balance shifts. That’s the condition to watch.
—
Not financial advice. Crypto assets are high-risk; do your own research.
📌 Market Narrative · #62 · #CryptoMarket #CryptoSighted $DOT
DOT’s futures market is holding steady, with 35.8 million tokens locked in perpetual contracts - about $30 million at current prices. That’s a sizeable bet, but the funding rate is near zero. Still, the cost of leverage isn’t just a single point - it’s been adding up over 21 periods, hitting ↑0.10% in total. That’s not insignificant. It’s a sign that traders are paying for leverage, but not necessarily in a way that’s screaming bullish or bearish conviction.
And the funding rate? It’s currently at ↑0.01%, which is slightly above the 21-period average of ↑0.0047%. But it’s still low. That’s not a sign of panic, but it’s also not a sign of explosive demand. The balance is tight. Traders are paying for leverage, but not in a way that’s pushing the price sharply higher. It’s a quiet, measured bet - not a scream.
Checkpoint: If DOT’s 21-period funding rate stays above ↑0.0047% this week, the leverage cost story holds - but if it drops below, the balance shifts. That’s the condition to watch.
—
Not financial advice. Crypto assets are high-risk; do your own research.
📌 Market Narrative · #62 · #CryptoMarket #CryptoSighted $DOT
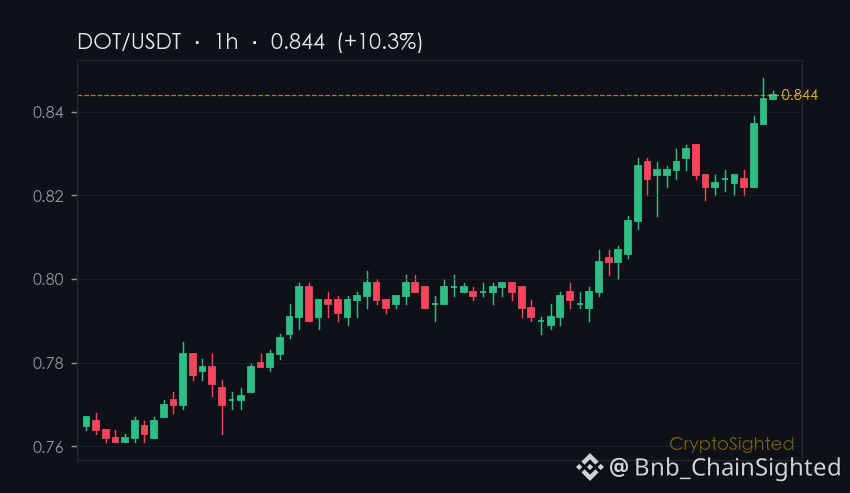
$NEAR ’s 3.2% gain in the last 24 hours is the quietest kind of contradiction.
It’s not a sharp move - it’s a slow, steady climb.
But here’s what’s interesting: the 7-day return is only ↑1.2%, and the 30-day return is ↓36.0%.
That’s a gap forming between longer-term pessimism and short-term optimism.
And the volume? It’s sitting at 12.8 million NEAR over the last 24 hours - not huge, but enough to keep the price moving.
That’s not a flood of capital, but it’s not a trickle either.
Checkpoint: NEAR’s 30-day return is ↓36.0% - if it holds below that baseline tomorrow, the long-term narrative is still in trouble; if it flips positive, this post’s divergence read is falsified.
—
Not financial advice. DYOR.
📌 Gainers Radar · #62 · #Gainers #CryptoSighted $NEAR
It’s not a sharp move - it’s a slow, steady climb.
But here’s what’s interesting: the 7-day return is only ↑1.2%, and the 30-day return is ↓36.0%.
That’s a gap forming between longer-term pessimism and short-term optimism.
And the volume? It’s sitting at 12.8 million NEAR over the last 24 hours - not huge, but enough to keep the price moving.
That’s not a flood of capital, but it’s not a trickle either.
Checkpoint: NEAR’s 30-day return is ↓36.0% - if it holds below that baseline tomorrow, the long-term narrative is still in trouble; if it flips positive, this post’s divergence read is falsified.
—
Not financial advice. DYOR.
📌 Gainers Radar · #62 · #Gainers #CryptoSighted $NEAR
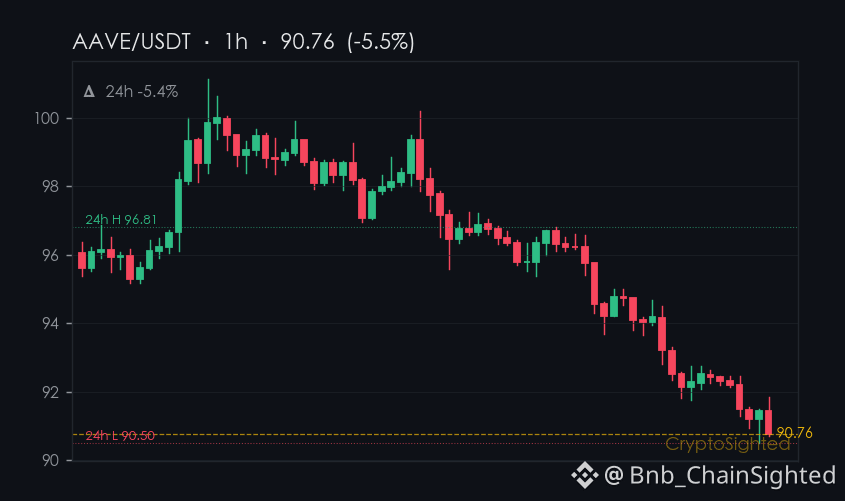
$90.99 now. That’s where $AAVE stands after a 5.39% drop in 24 hours.
But the bigger story isn’t the daily move - it’s the 7-day erosion.
AAVE’s price is down 5.1% over that stretch, and its open interest has fallen 8.7%.
That’s not just a short-term stumble. That’s a slow bleed.
Here’s the tension: AAVE is down sharply in the short term, but the funding rate isn’t showing panic.
The market isn’t screaming "sell" or "buy" - it’s just holding its breath.
That kind of neutrality in the face of a 7-day decline is telling.
It could mean the leverage is still in place, waiting for a trigger.
Or it could mean the crowd is running out of steam, but not yet ready to give up.
—
📊 13 directional calls in the last 30d, every one auto-settled against price. Direction only — no buy/sell calls.
Not financial advice. DYOR.
📌 Funding Pulse · #62 · #FundingRate #CryptoSighted $AAVE
But the bigger story isn’t the daily move - it’s the 7-day erosion.
AAVE’s price is down 5.1% over that stretch, and its open interest has fallen 8.7%.
That’s not just a short-term stumble. That’s a slow bleed.
Here’s the tension: AAVE is down sharply in the short term, but the funding rate isn’t showing panic.
The market isn’t screaming "sell" or "buy" - it’s just holding its breath.
That kind of neutrality in the face of a 7-day decline is telling.
It could mean the leverage is still in place, waiting for a trigger.
Or it could mean the crowd is running out of steam, but not yet ready to give up.
—
📊 13 directional calls in the last 30d, every one auto-settled against price. Direction only — no buy/sell calls.
Not financial advice. DYOR.
📌 Funding Pulse · #62 · #FundingRate #CryptoSighted $AAVE
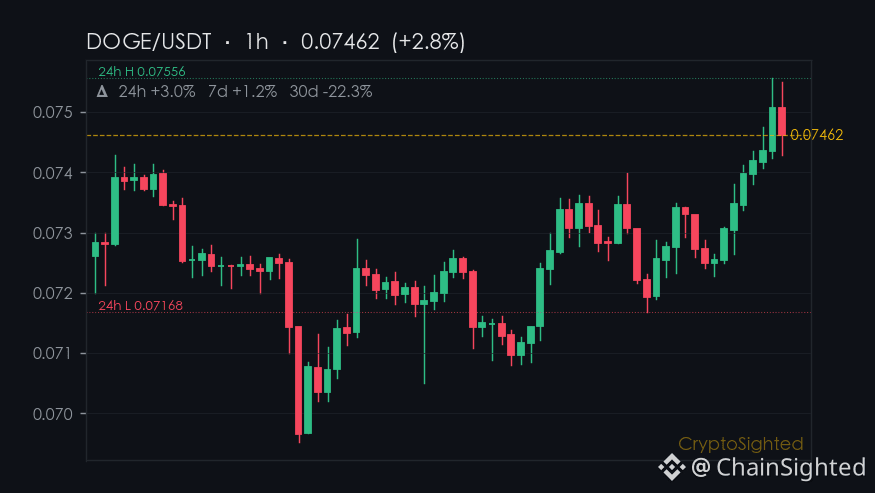
$DOGE ’s 2.70% gain in the last 24 hours sits in stark contrast to its 30-day decline of ↓22.3%. That’s a divergence worth noting — especially when compared to $BTC , which saw a 3.11% rise in the same period but only a ↓9.6% drop over 30 days.
—
Not financial advice. Crypto assets are high-risk; do your own research.
📌 Hotspot Watch · #62
#CryptoTrends #灼见观察
—
Not financial advice. Crypto assets are high-risk; do your own research.
📌 Hotspot Watch · #62
#CryptoTrends #灼见观察
Partly True
You’ve noticed the timing - Binance just rolled out a series of USDⓈ-margin perpetual contracts tied to TradFi assets, starting with SKHYUSDT and expanding to include bStocks tokenized securities.
The rollout began on July 10 and accelerated through July 16, with the addition of 10 bStocks pairs on July 15 and the launch of SPCXUSD1 on July 20.
The question is: does this mean institutional interest in crypto is starting to pivot toward more familiar, less volatile assets?
The data doesn’t yet say - but the timing suggests it’s not just about listing. It’s about alignment.
—
Not financial advice. DYOR.
📌 Announcements · #62 · #CryptoNews #CryptoSighted
The rollout began on July 10 and accelerated through July 16, with the addition of 10 bStocks pairs on July 15 and the launch of SPCXUSD1 on July 20.
The question is: does this mean institutional interest in crypto is starting to pivot toward more familiar, less volatile assets?
The data doesn’t yet say - but the timing suggests it’s not just about listing. It’s about alignment.
—
Not financial advice. DYOR.
📌 Announcements · #62 · #CryptoNews #CryptoSighted


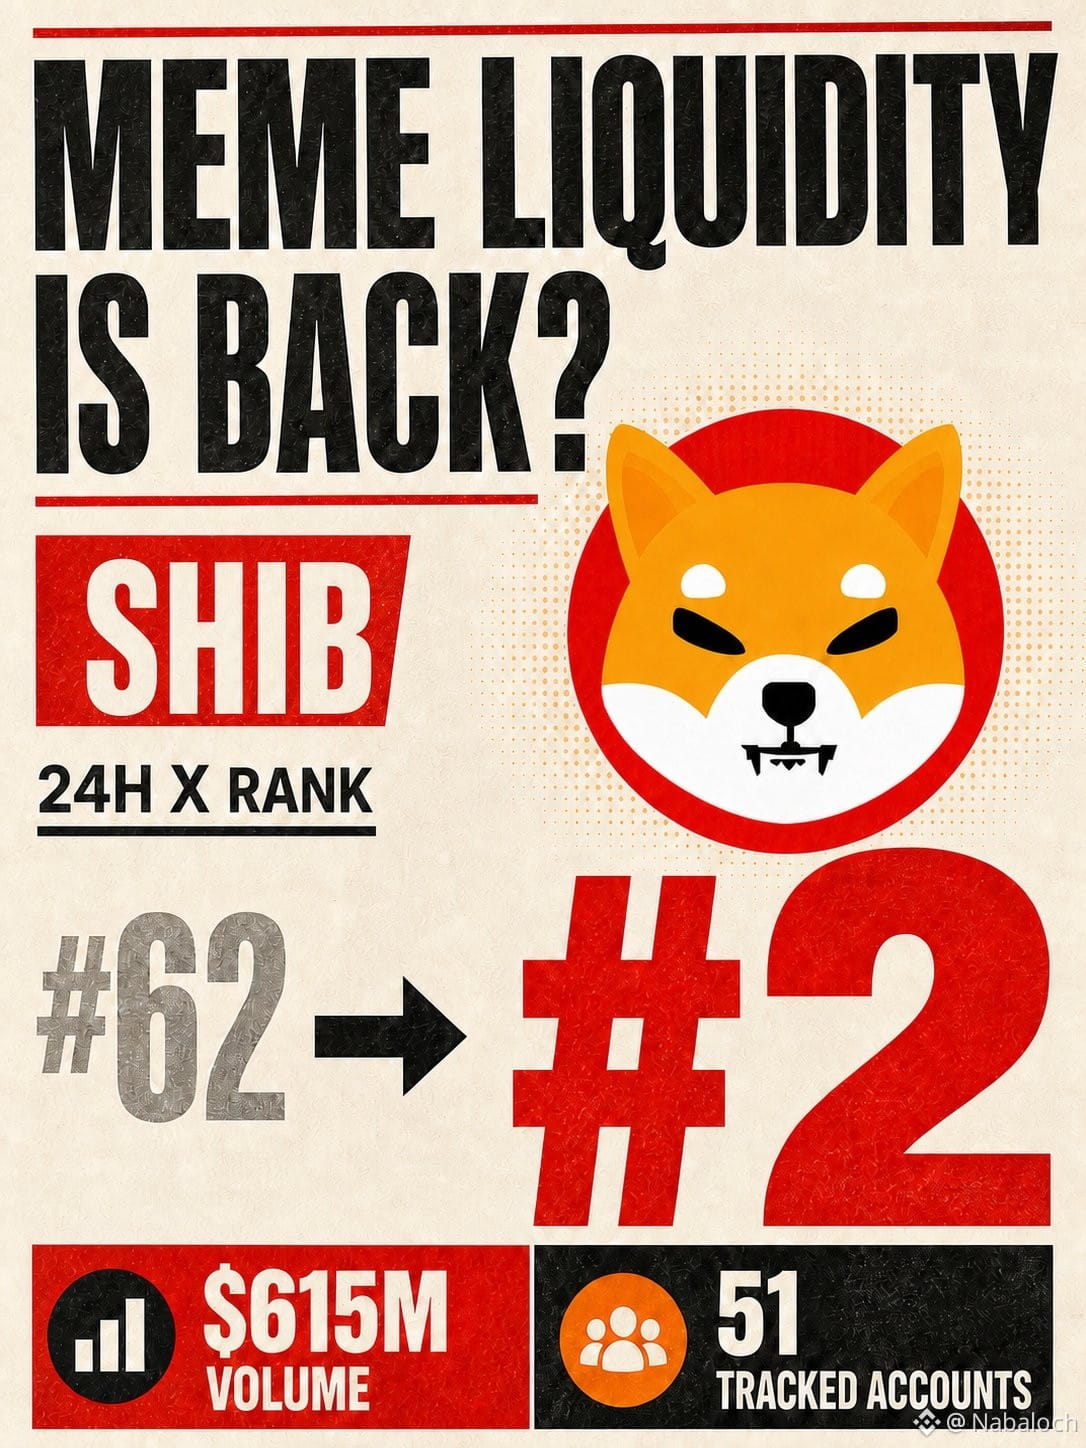
$SHIB climbed from #62 to #2 in 24H Crypto X activity among the accounts we track.
65 posts from 51 accounts, price +28%, $615M traded.
@MartiniGuyYT reported that South Korean exchanges appeared to be driving much of the move despite no major announcement. @rektober raised the broader question: is retail rotating back into established meme coins?
65 posts from 51 accounts, price +28%, $615M traded.
@MartiniGuyYT reported that South Korean exchanges appeared to be driving much of the move despite no major announcement. @rektober raised the broader question: is retail rotating back into established meme coins?
Log in to explore more content