
#trxupdate
trxupdate
238,687 views
388 Discussing
Hot
Latest

Article
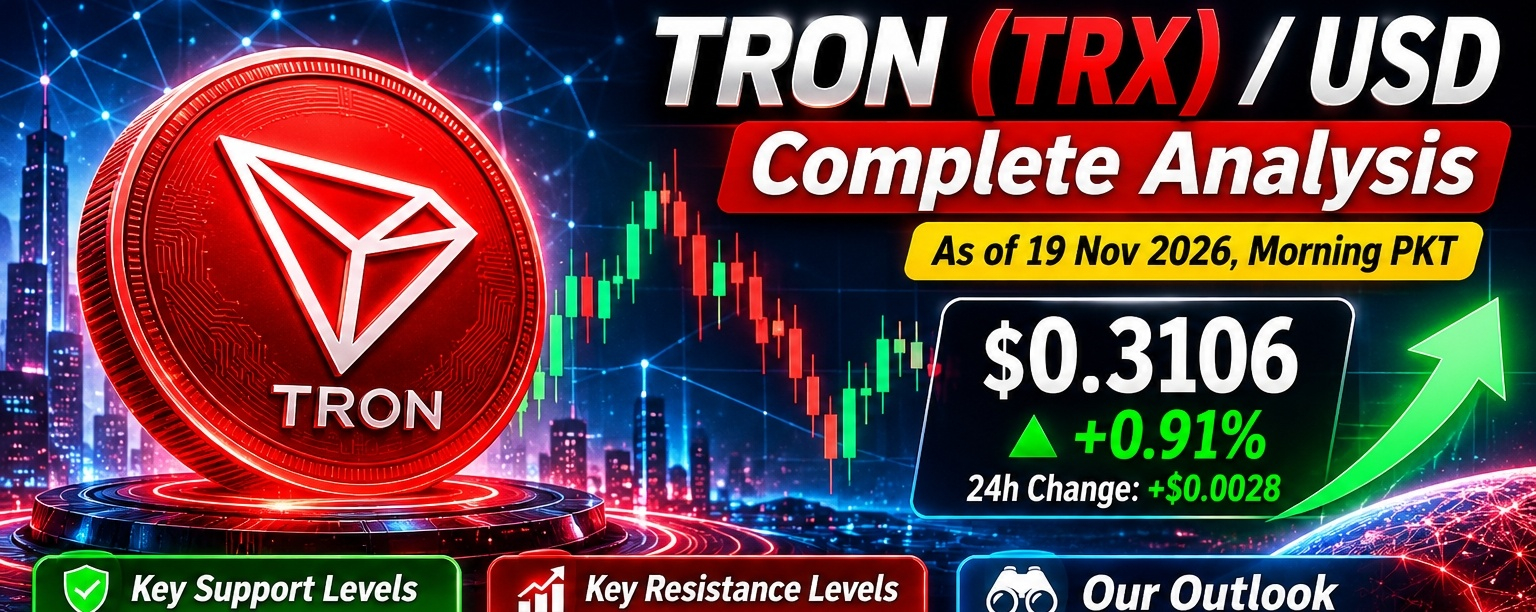
TRON (TRX) / USD - Complete Analysis 19 Nov 2026TRON ($TRX ) / USD - Complete Analysis 19 Nov 2026
1. Live Snapshot
Current Price: ~$0.3106
24h Range: $0.3074 - $0.3112
24h Change: +0.91% [+0.0028]
24h Volume: ∼$280.69M
Market Cap: $29.35B - Rank #8
Circulating Supply: ∼95.04B TRX
Previous Close: $0.3078
{spot}(TRXUSDT)
Recent Daily Closes:
| Date | Open | High | Low | Close |
| --- | --- | --- | --- | --- |
| 18 Nov 2026 | $0.3081 | $0.3105 | $0.3074 | $0.3099 |
| 17 Nov 2026 | $0.3052 | $0.3087 | $0.3048 | $0.3081 |
| 16 Nov 2026 | $0.3053 | $0.3074 | $0.3023 | $0.3052 |
Price is holding just above $0.31 after 3 days of small green closes, but still in a tight consolidation range.
2. Performance
5 Days: -0.74%
1 Month: -6.71%
6 Months: -13.05%
Year-to-Date: +7.94%
1 Year: +8.02%
7 Days: -3.08% in earlier session, now recovering
Interpretation: TRX is outperforming on a yearly basis but underperforming short-term. It has lost momentum in the last 1-6 months despite strong network usage. This is classic TRX behaviour - strong fundamentals, slow price.
3. Technical Analysis
Overall Signal: Bearish-to-Neutral / Consolidation
| Indicator | Value | Signal |
| --- | --- | --- |
| RSI (14) | 38.8 - 39.3 | Bearish / Weak, but NOT oversold |
| MACD (12,26,9) | -0.0055 / -0.01 | Bearish, below zero |
| 1H RSI | 61.9 | Short-term bounce / Long |
| Price vs MAs | Below 7, 30, 200-day MAs | Bearish |
| 20-day EMA | ~$0.3223 | Price below it = resistance |
| 50 & 200-day EMA | ~$0.3274 aligned | Major resistance cluster |
TRX is trading below all major moving averages. The daily trend is still down, but the 1-hour chart shows a short-term relief bounce. RSI near 39 means sellers are tired but buyers have not taken control yet.
4. Key Levels to Watch
Support:
S1 - Immediate: $0.3063 - $0.3074
S2 - Strong / Psychological: $0.3020 - $0.3030
S3 - Breakdown: $0.2935 - $0.2963
S4 - Major: $0.2840
Resistance:
R1 - Immediate: $0.3102 - $0.3112
R2 - Key Breakout: $0.3210 - $0.3249
R3 - EMA Cluster: $0.3274 - $0.3293
R4 - Major: $0.3390 - $0.3704
The battle is $0.302 vs $0.321. Hold $0.302 = consolidation continues. Break $0.321 with volume = trend reversal. Lose $0.302 = drop toward $0.293.
### 5. Fundamentals - Why TRX Is Still Strong
This is where $ADA separates from most altcoins:
#1 Stablecoin Network: TRON overtook Ethereum for average USDT supply in Q3 2026. Average stablecoin supply hit a record $92.25B, with USDT alone at $90.75B vs Ethereum's $87.73B.
Massive Settlement: $2.18T - $2.21T settled in Q3 2026, capturing 73% of all stablecoin volume. Cumulative transaction value now exceeds $30T.
Revenue Leader: TRON generated 93% of tracked L1 + L2 network revenue in Q3.
New Catalyst - ETF: First U.S. spot staked TRX ETF launched in Q3 2026.
New Catalyst - DeFi: On 17 Nov 2026, Aave App announced support for USDT (TRC-20) deposits on TRON.
Use Case: Fast, low-cost transfers, especially for USDT in Asia, Africa, and Latin America. USDT is 98.5% of TRON's stablecoin supply.
Risk: Heavy dependence on $ETH . If USDT dominance falls or regulators target TRON / Justin Sun, TRX is exposed. Also, network success is NOT translating into TRX price yet.
6. Market Sentiment
Fear & Greed Index: 11 - Extreme Fear (whole crypto market)
AI Signal: Neutral 66%
Technical Sentiment: Strong Sell on daily, but Long on 1H
Extreme fear + price holding support often marks accumulation zones, but it can also precede one more flush down.
7. Price Prediction / Scenarios
These are model estimates, not guarantees - forecasts vary widely:
| Source / Period | Low | Base / Average | High |
| --- | --- | --- | --- |
| Nov-Dec 2026 | $0.2950 | $0.3180 | $0.3300 |
| End 2026 | $0.28 | $0.34 - $0.366 | $0.40 - $0.439 |
| 2027 | $0.27 - $0.30 | $0.385 - $0.42 | $0.46 - $0.60 |
| 2030 | - | $0.35 - $0.51 | $0.55+ |
Most conservative models see TRX stuck in $0.29 - $0.35 until it breaks $0.33. More bullish models project $0.38-$0.42 in 2027 if Bitcoin recovers and stablecoin usage keeps growing.
8. Trading Plan - 3 Scenarios
A) Bullish - Breakout
Trigger: Daily close above $0.321 with volume
Target 1: $0.329
Target 2: $0.339
Invalidation: Fall back below $0.311
B) Neutral - Range (Most Likely Now)
Range: $0.302 - $0.321
Strategy: Buy near $0.303-$0.306, sell near $0.318-$0.321
Stop-loss below $0.299
C) Bearish - Breakdown
Trigger: Daily close below $0.302
Target 1: $0.296
Target 2: $0.284
Invalidation: Reclaim $0.311 quickly
9. Verdict
Short-term (Days-Weeks): NEUTRAL-BEARISH
Price is below all MAs, MACD negative, RSI weak. Expect chop between $0.302-$0.321.
Medium-term (Months): NEUTRAL
Fundamentals are excellent, but price needs Bitcoin market recovery + a break above $0.327 to turn bullish.
Long-term (1-3 Years): BULLISH on Utility
If TRON keeps 70%+ stablecoin settlement share, TRX has real utility value that most altcoins don't. The risk is not technology, it's price not following usage.
Not financial advice. Crypto is highly volatile. Only risk what you can afford to lose, and use a stop-loss if you trade short-term.
Want me to make you a TRX buy/sell alert plan with exact entry, stop-loss and targets for spot vs futures, or a 1-week daily forecast?
#TRX #TRXUpdate #trxanalysis #TRXUSDT #CryptoSignals #LongTrade #FuturesTrading #BinanceFeed #ScalpSetup #MomentumTrade #Leverage15x #CryptoTamil #BreakoutSetup
TRON (TRX) / USD - Complete Analysis 19 Nov 2026
TRON ($TRX ) / USD - Complete Analysis 19 Nov 2026
1. Live Snapshot
Current Price: ~$0.3106
24h Range: $0.3074 - $0.3112
24h Change: +0.91% [+0.0028]
24h Volume: ∼$280.69M
Market Cap: $29.35B - Rank #8
Circulating Supply: ∼95.04B TRX
Previous Close: $0.3078
Recent Daily Closes:
| Date | Open | High | Low | Close |
| --- | --- | --- | --- | --- |
| 18 Nov 2026 | $0.3081 | $0.3105 | $0.3074 | $0.3099 |
| 17 Nov 2026 | $0.3052 | $0.3087 | $0.3048 | $0.3081 |
| 16 Nov 2026 | $0.3053 | $0.3074 | $0.3023 | $0.3052 |
Price is holding just above $0.31 after 3 days of small green closes, but still in a tight consolidation range.
2. Performance
5 Days: -0.74%
1 Month: -6.71%
6 Months: -13.05%
Year-to-Date: +7.94%
1 Year: +8.02%
7 Days: -3.08% in earlier session, now recovering
Interpretation: TRX is outperforming on a yearly basis but underperforming short-term. It has lost momentum in the last 1-6 months despite strong network usage. This is classic TRX behaviour - strong fundamentals, slow price.
3. Technical Analysis
Overall Signal: Bearish-to-Neutral / Consolidation
| Indicator | Value | Signal |
| --- | --- | --- |
| RSI (14) | 38.8 - 39.3 | Bearish / Weak, but NOT oversold |
| MACD (12,26,9) | -0.0055 / -0.01 | Bearish, below zero |
| 1H RSI | 61.9 | Short-term bounce / Long |
| Price vs MAs | Below 7, 30, 200-day MAs | Bearish |
| 20-day EMA | ~$0.3223 | Price below it = resistance |
| 50 & 200-day EMA | ~$0.3274 aligned | Major resistance cluster |
TRX is trading below all major moving averages. The daily trend is still down, but the 1-hour chart shows a short-term relief bounce. RSI near 39 means sellers are tired but buyers have not taken control yet.
4. Key Levels to Watch
Support:
S1 - Immediate: $0.3063 - $0.3074
S2 - Strong / Psychological: $0.3020 - $0.3030
S3 - Breakdown: $0.2935 - $0.2963
S4 - Major: $0.2840
Resistance:
R1 - Immediate: $0.3102 - $0.3112
R2 - Key Breakout: $0.3210 - $0.3249
R3 - EMA Cluster: $0.3274 - $0.3293
R4 - Major: $0.3390 - $0.3704
The battle is $0.302 vs $0.321. Hold $0.302 = consolidation continues. Break $0.321 with volume = trend reversal. Lose $0.302 = drop toward $0.293.
### 5. Fundamentals - Why TRX Is Still Strong
This is where $ADA separates from most altcoins:
#1 Stablecoin Network: TRON overtook Ethereum for average USDT supply in Q3 2026. Average stablecoin supply hit a record $92.25B, with USDT alone at $90.75B vs Ethereum's $87.73B.
Massive Settlement: $2.18T - $2.21T settled in Q3 2026, capturing 73% of all stablecoin volume. Cumulative transaction value now exceeds $30T.
Revenue Leader: TRON generated 93% of tracked L1 + L2 network revenue in Q3.
New Catalyst - ETF: First U.S. spot staked TRX ETF launched in Q3 2026.
New Catalyst - DeFi: On 17 Nov 2026, Aave App announced support for USDT (TRC-20) deposits on TRON.
Use Case: Fast, low-cost transfers, especially for USDT in Asia, Africa, and Latin America. USDT is 98.5% of TRON's stablecoin supply.
Risk: Heavy dependence on $ETH . If USDT dominance falls or regulators target TRON / Justin Sun, TRX is exposed. Also, network success is NOT translating into TRX price yet.
6. Market Sentiment
Fear & Greed Index: 11 - Extreme Fear (whole crypto market)
AI Signal: Neutral 66%
Technical Sentiment: Strong Sell on daily, but Long on 1H
Extreme fear + price holding support often marks accumulation zones, but it can also precede one more flush down.
7. Price Prediction / Scenarios
These are model estimates, not guarantees - forecasts vary widely:
| Source / Period | Low | Base / Average | High |
| --- | --- | --- | --- |
| Nov-Dec 2026 | $0.2950 | $0.3180 | $0.3300 |
| End 2026 | $0.28 | $0.34 - $0.366 | $0.40 - $0.439 |
| 2027 | $0.27 - $0.30 | $0.385 - $0.42 | $0.46 - $0.60 |
| 2030 | - | $0.35 - $0.51 | $0.55+ |
Most conservative models see TRX stuck in $0.29 - $0.35 until it breaks $0.33. More bullish models project $0.38-$0.42 in 2027 if Bitcoin recovers and stablecoin usage keeps growing.
8. Trading Plan - 3 Scenarios
A) Bullish - Breakout
Trigger: Daily close above $0.321 with volume
Target 1: $0.329
Target 2: $0.339
Invalidation: Fall back below $0.311
B) Neutral - Range (Most Likely Now)
Range: $0.302 - $0.321
Strategy: Buy near $0.303-$0.306, sell near $0.318-$0.321
Stop-loss below $0.299
C) Bearish - Breakdown
Trigger: Daily close below $0.302
Target 1: $0.296
Target 2: $0.284
Invalidation: Reclaim $0.311 quickly
9. Verdict
Short-term (Days-Weeks): NEUTRAL-BEARISH
Price is below all MAs, MACD negative, RSI weak. Expect chop between $0.302-$0.321.
Medium-term (Months): NEUTRAL
Fundamentals are excellent, but price needs Bitcoin market recovery + a break above $0.327 to turn bullish.
Long-term (1-3 Years): BULLISH on Utility
If TRON keeps 70%+ stablecoin settlement share, TRX has real utility value that most altcoins don't. The risk is not technology, it's price not following usage.
Not financial advice. Crypto is highly volatile. Only risk what you can afford to lose, and use a stop-loss if you trade short-term.
Want me to make you a TRX buy/sell alert plan with exact entry, stop-loss and targets for spot vs futures, or a 1-week daily forecast?
#TRX #TRXUpdate #trxanalysis #TRXUSDT #CryptoSignals #LongTrade #FuturesTrading #BinanceFeed #ScalpSetup #MomentumTrade #Leverage15x #CryptoTamil #BreakoutSetup
1. Live Snapshot
Current Price: ~$0.3106
24h Range: $0.3074 - $0.3112
24h Change: +0.91% [+0.0028]
24h Volume: ∼$280.69M
Market Cap: $29.35B - Rank #8
Circulating Supply: ∼95.04B TRX
Previous Close: $0.3078
Recent Daily Closes:
| Date | Open | High | Low | Close |
| --- | --- | --- | --- | --- |
| 18 Nov 2026 | $0.3081 | $0.3105 | $0.3074 | $0.3099 |
| 17 Nov 2026 | $0.3052 | $0.3087 | $0.3048 | $0.3081 |
| 16 Nov 2026 | $0.3053 | $0.3074 | $0.3023 | $0.3052 |
Price is holding just above $0.31 after 3 days of small green closes, but still in a tight consolidation range.
2. Performance
5 Days: -0.74%
1 Month: -6.71%
6 Months: -13.05%
Year-to-Date: +7.94%
1 Year: +8.02%
7 Days: -3.08% in earlier session, now recovering
Interpretation: TRX is outperforming on a yearly basis but underperforming short-term. It has lost momentum in the last 1-6 months despite strong network usage. This is classic TRX behaviour - strong fundamentals, slow price.
3. Technical Analysis
Overall Signal: Bearish-to-Neutral / Consolidation
| Indicator | Value | Signal |
| --- | --- | --- |
| RSI (14) | 38.8 - 39.3 | Bearish / Weak, but NOT oversold |
| MACD (12,26,9) | -0.0055 / -0.01 | Bearish, below zero |
| 1H RSI | 61.9 | Short-term bounce / Long |
| Price vs MAs | Below 7, 30, 200-day MAs | Bearish |
| 20-day EMA | ~$0.3223 | Price below it = resistance |
| 50 & 200-day EMA | ~$0.3274 aligned | Major resistance cluster |
TRX is trading below all major moving averages. The daily trend is still down, but the 1-hour chart shows a short-term relief bounce. RSI near 39 means sellers are tired but buyers have not taken control yet.
4. Key Levels to Watch
Support:
S1 - Immediate: $0.3063 - $0.3074
S2 - Strong / Psychological: $0.3020 - $0.3030
S3 - Breakdown: $0.2935 - $0.2963
S4 - Major: $0.2840
Resistance:
R1 - Immediate: $0.3102 - $0.3112
R2 - Key Breakout: $0.3210 - $0.3249
R3 - EMA Cluster: $0.3274 - $0.3293
R4 - Major: $0.3390 - $0.3704
The battle is $0.302 vs $0.321. Hold $0.302 = consolidation continues. Break $0.321 with volume = trend reversal. Lose $0.302 = drop toward $0.293.
### 5. Fundamentals - Why TRX Is Still Strong
This is where $ADA separates from most altcoins:
#1 Stablecoin Network: TRON overtook Ethereum for average USDT supply in Q3 2026. Average stablecoin supply hit a record $92.25B, with USDT alone at $90.75B vs Ethereum's $87.73B.
Massive Settlement: $2.18T - $2.21T settled in Q3 2026, capturing 73% of all stablecoin volume. Cumulative transaction value now exceeds $30T.
Revenue Leader: TRON generated 93% of tracked L1 + L2 network revenue in Q3.
New Catalyst - ETF: First U.S. spot staked TRX ETF launched in Q3 2026.
New Catalyst - DeFi: On 17 Nov 2026, Aave App announced support for USDT (TRC-20) deposits on TRON.
Use Case: Fast, low-cost transfers, especially for USDT in Asia, Africa, and Latin America. USDT is 98.5% of TRON's stablecoin supply.
Risk: Heavy dependence on $ETH . If USDT dominance falls or regulators target TRON / Justin Sun, TRX is exposed. Also, network success is NOT translating into TRX price yet.
6. Market Sentiment
Fear & Greed Index: 11 - Extreme Fear (whole crypto market)
AI Signal: Neutral 66%
Technical Sentiment: Strong Sell on daily, but Long on 1H
Extreme fear + price holding support often marks accumulation zones, but it can also precede one more flush down.
7. Price Prediction / Scenarios
These are model estimates, not guarantees - forecasts vary widely:
| Source / Period | Low | Base / Average | High |
| --- | --- | --- | --- |
| Nov-Dec 2026 | $0.2950 | $0.3180 | $0.3300 |
| End 2026 | $0.28 | $0.34 - $0.366 | $0.40 - $0.439 |
| 2027 | $0.27 - $0.30 | $0.385 - $0.42 | $0.46 - $0.60 |
| 2030 | - | $0.35 - $0.51 | $0.55+ |
Most conservative models see TRX stuck in $0.29 - $0.35 until it breaks $0.33. More bullish models project $0.38-$0.42 in 2027 if Bitcoin recovers and stablecoin usage keeps growing.
8. Trading Plan - 3 Scenarios
A) Bullish - Breakout
Trigger: Daily close above $0.321 with volume
Target 1: $0.329
Target 2: $0.339
Invalidation: Fall back below $0.311
B) Neutral - Range (Most Likely Now)
Range: $0.302 - $0.321
Strategy: Buy near $0.303-$0.306, sell near $0.318-$0.321
Stop-loss below $0.299
C) Bearish - Breakdown
Trigger: Daily close below $0.302
Target 1: $0.296
Target 2: $0.284
Invalidation: Reclaim $0.311 quickly
9. Verdict
Short-term (Days-Weeks): NEUTRAL-BEARISH
Price is below all MAs, MACD negative, RSI weak. Expect chop between $0.302-$0.321.
Medium-term (Months): NEUTRAL
Fundamentals are excellent, but price needs Bitcoin market recovery + a break above $0.327 to turn bullish.
Long-term (1-3 Years): BULLISH on Utility
If TRON keeps 70%+ stablecoin settlement share, TRX has real utility value that most altcoins don't. The risk is not technology, it's price not following usage.
Not financial advice. Crypto is highly volatile. Only risk what you can afford to lose, and use a stop-loss if you trade short-term.
Want me to make you a TRX buy/sell alert plan with exact entry, stop-loss and targets for spot vs futures, or a 1-week daily forecast?
#TRX #TRXUpdate #trxanalysis #TRXUSDT #CryptoSignals #LongTrade #FuturesTrading #BinanceFeed #ScalpSetup #MomentumTrade #Leverage15x #CryptoTamil #BreakoutSetup
107

·
--
Bullish
$TRX
في وقت تستمر فيه أسواق العملات المشفرة في التأرجح بين طفرات السيولة الساخنة وعمليات جني الأرباح العنيفة، تواصل شبكة "ترون" (TRON) وعملتها الأساسية (TRX) تقديم نموذج مختلف تماماً. فبعيداً عن المضاربات المحمومة التي تميز قطاعات الذكاء الاصطناعي أو عملات الميم، تعتمد ترون على "المنفعة العضوية" الكثيفة، مما يمنحها مناعة استثنائية ضد التقلبات التي تعصف بباقي الأصول الرقمية.
الأداء السعري وديناميكيات السوق الحالية خلال تداولات اليوم، 16 نوفمبر 2026، تحافظ عملة (TRX) على ثباتها الملحوظ وتتداول بالقرب من مستويات 0.35 إلى 0.37 دولار أمريكي، مستمرة في ترسيخ مكانتها ضمن قائمة أكبر 10 عملات مشفرة من حيث القيمة السوقية.
على عكس العديد من العملات البديلة (Altcoins) التي سجلت تراجعات حادة أو تقلبات جنونية خلال الأسبوع الماضي، لم تشهد (TRX) سوى تحركات هادئة ضمن نطاق ضيق. يستمد هذا التماسك السعري قوته من التدفقات اليومية المستمرة؛ حيث يرى المتداولون والمؤسسات في الشبكة "بنية تحتية" أكثر من كونها أداة للمضاربة. ومع التوسع المستمر لقطاع التمويل اللامركزي (DeFi) على ترون، تستمر الشبكة في جذب سيولة ضخمة تبقي أحجام التداول اليومية للعملة في مستويات صحية ومستقرة.
$TRX #TRX #TRX✅ #TRX/USDT❤️ #TRXUpdate #TRX/USDT❤️
{future}(TRXUSDT)
{spot}(TRXUSDT)
$TRX
في وقت تستمر فيه أسواق العملات المشفرة في التأرجح بين طفرات السيولة الساخنة وعمليات جني الأرباح العنيفة، تواصل شبكة "ترون" (TRON) وعملتها الأساسية (TRX) تقديم نموذج مختلف تماماً. فبعيداً عن المضاربات المحمومة التي تميز قطاعات الذكاء الاصطناعي أو عملات الميم، تعتمد ترون على "المنفعة العضوية" الكثيفة، مما يمنحها مناعة استثنائية ضد التقلبات التي تعصف بباقي الأصول الرقمية.
الأداء السعري وديناميكيات السوق الحالية خلال تداولات اليوم، 16 نوفمبر 2026، تحافظ عملة (TRX) على ثباتها الملحوظ وتتداول بالقرب من مستويات 0.35 إلى 0.37 دولار أمريكي، مستمرة في ترسيخ مكانتها ضمن قائمة أكبر 10 عملات مشفرة من حيث القيمة السوقية.
على عكس العديد من العملات البديلة (Altcoins) التي سجلت تراجعات حادة أو تقلبات جنونية خلال الأسبوع الماضي، لم تشهد (TRX) سوى تحركات هادئة ضمن نطاق ضيق. يستمد هذا التماسك السعري قوته من التدفقات اليومية المستمرة؛ حيث يرى المتداولون والمؤسسات في الشبكة "بنية تحتية" أكثر من كونها أداة للمضاربة. ومع التوسع المستمر لقطاع التمويل اللامركزي (DeFi) على ترون، تستمر الشبكة في جذب سيولة ضخمة تبقي أحجام التداول اليومية للعملة في مستويات صحية ومستقرة.
$TRX #TRX #TRX✅ #TRX/USDT❤️ #TRXUpdate #TRX/USDT❤️
في وقت تستمر فيه أسواق العملات المشفرة في التأرجح بين طفرات السيولة الساخنة وعمليات جني الأرباح العنيفة، تواصل شبكة "ترون" (TRON) وعملتها الأساسية (TRX) تقديم نموذج مختلف تماماً. فبعيداً عن المضاربات المحمومة التي تميز قطاعات الذكاء الاصطناعي أو عملات الميم، تعتمد ترون على "المنفعة العضوية" الكثيفة، مما يمنحها مناعة استثنائية ضد التقلبات التي تعصف بباقي الأصول الرقمية.
الأداء السعري وديناميكيات السوق الحالية خلال تداولات اليوم، 16 نوفمبر 2026، تحافظ عملة (TRX) على ثباتها الملحوظ وتتداول بالقرب من مستويات 0.35 إلى 0.37 دولار أمريكي، مستمرة في ترسيخ مكانتها ضمن قائمة أكبر 10 عملات مشفرة من حيث القيمة السوقية.
على عكس العديد من العملات البديلة (Altcoins) التي سجلت تراجعات حادة أو تقلبات جنونية خلال الأسبوع الماضي، لم تشهد (TRX) سوى تحركات هادئة ضمن نطاق ضيق. يستمد هذا التماسك السعري قوته من التدفقات اليومية المستمرة؛ حيث يرى المتداولون والمؤسسات في الشبكة "بنية تحتية" أكثر من كونها أداة للمضاربة. ومع التوسع المستمر لقطاع التمويل اللامركزي (DeFi) على ترون، تستمر الشبكة في جذب سيولة ضخمة تبقي أحجام التداول اليومية للعملة في مستويات صحية ومستقرة.
$TRX #TRX #TRX✅ #TRX/USDT❤️ #TRXUpdate #TRX/USDT❤️

87

·
--
TRON Market Update: Time to Make a Move!{stock_us}(TRON.US)
$TRON.US (TRX) – What's Happening in the Market?
TRX is currently trading around $0.317, and its short-term trend looks a little weak.
The price is still below its major moving averages, so I'm keeping an eye on the next market move.
📉 Is TRX preparing for another drop, or could we see a recovery soon?
Personally, I think waiting for a clear trend confirmation is better than rushing into a decision.
What's your opinion? Is TRX ready to bounce back or still under pressure? 👇
$TRX
#TRON #TRXUpdate #CryptoMarketAlert #BinanceSquare
TRON Market Update: Time to Make a Move!
$TRON.US (TRX) – What's Happening in the Market?
TRX is currently trading around $0.317, and its short-term trend looks a little weak.
The price is still below its major moving averages, so I'm keeping an eye on the next market move.
📉 Is TRX preparing for another drop, or could we see a recovery soon?
Personally, I think waiting for a clear trend confirmation is better than rushing into a decision.
What's your opinion? Is TRX ready to bounce back or still under pressure? 👇
$TRX
#TRON #TRXUpdate #CryptoMarketAlert #BinanceSquare
TRX is currently trading around $0.317, and its short-term trend looks a little weak.
The price is still below its major moving averages, so I'm keeping an eye on the next market move.
📉 Is TRX preparing for another drop, or could we see a recovery soon?
Personally, I think waiting for a clear trend confirmation is better than rushing into a decision.
What's your opinion? Is TRX ready to bounce back or still under pressure? 👇
$TRX
#TRON #TRXUpdate #CryptoMarketAlert #BinanceSquare
1
249

·
--
Bullish
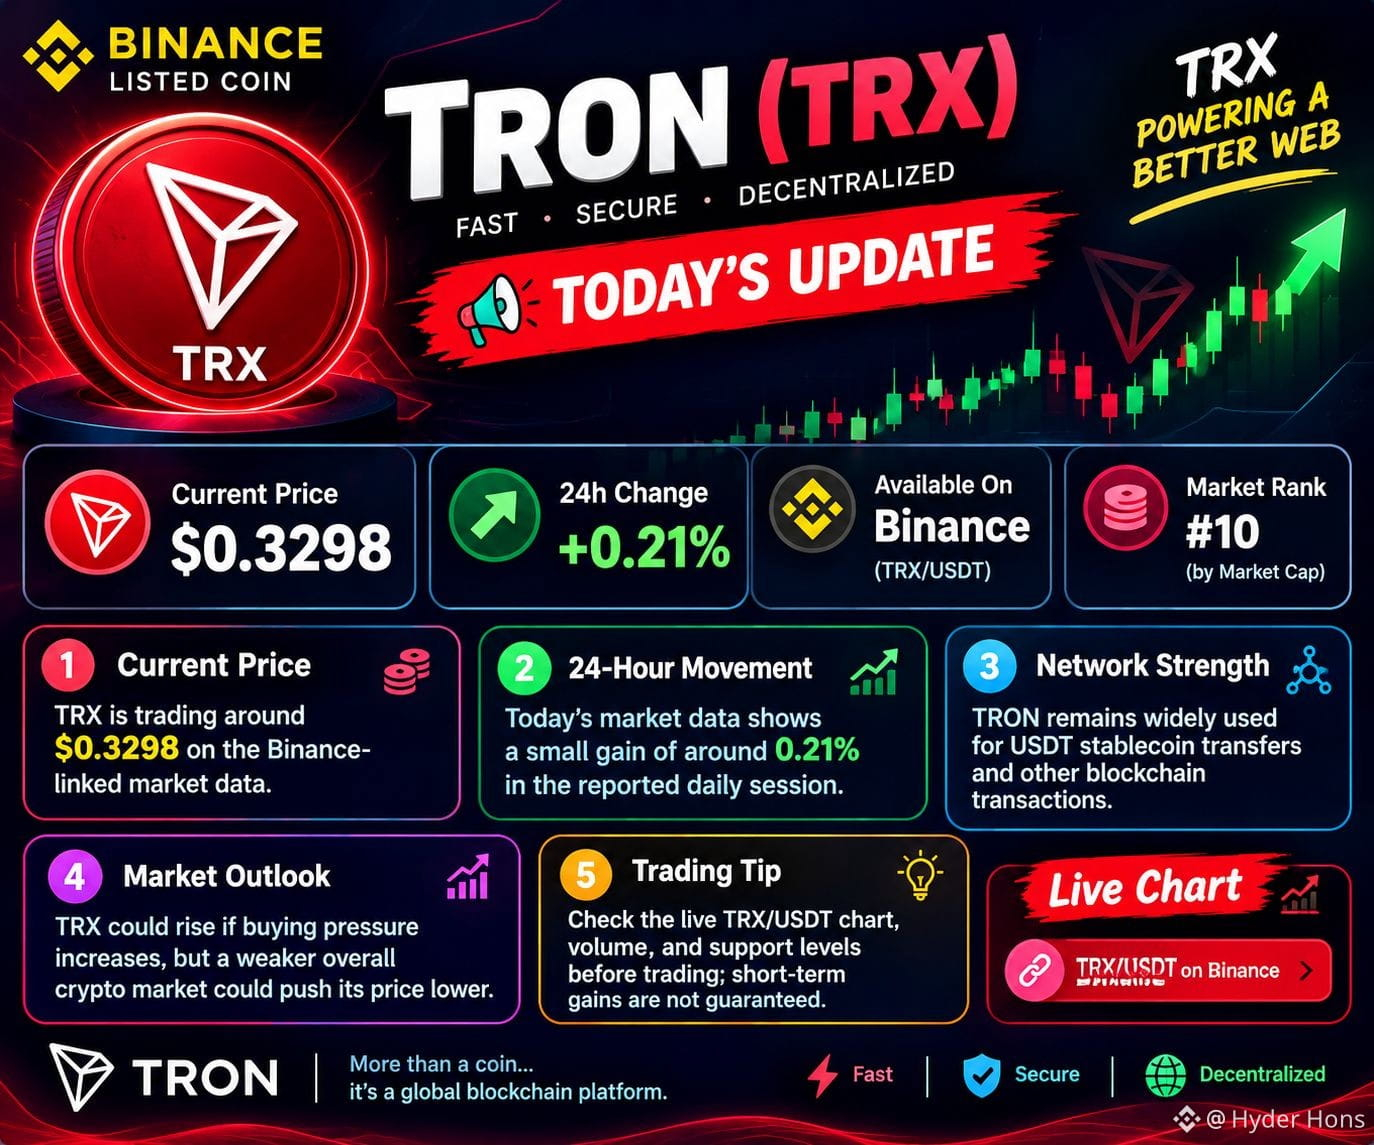
$TRX TRON (TRX) — Today's Update | October 13, 2026
Current price: TRX is trading around $0.3298 on the Binance-linked market data.
24-hour movement: Today's market data shows a small gain of around 0.21% in the reported daily session.
Network strength: TRON remains widely used for USDT stablecoin transfers and other blockchain transactions.
Market outlook: TRX could rise if buying pressure increases, but a weaker overall crypto market could push its price lower.
Trading tip: Check the live TRX/USDT chart, volume, and support levels before trading; short-term gains are not guaranteed.
#TRX✅ #TRXUpdate
{spot}(TRXUSDT)
$TRX TRON (TRX) — Today's Update | October 13, 2026
Current price: TRX is trading around $0.3298 on the Binance-linked market data.
24-hour movement: Today's market data shows a small gain of around 0.21% in the reported daily session.
Network strength: TRON remains widely used for USDT stablecoin transfers and other blockchain transactions.
Market outlook: TRX could rise if buying pressure increases, but a weaker overall crypto market could push its price lower.
Trading tip: Check the live TRX/USDT chart, volume, and support levels before trading; short-term gains are not guaranteed.
#TRX✅ #TRXUpdate
Current price: TRX is trading around $0.3298 on the Binance-linked market data.
24-hour movement: Today's market data shows a small gain of around 0.21% in the reported daily session.
Network strength: TRON remains widely used for USDT stablecoin transfers and other blockchain transactions.
Market outlook: TRX could rise if buying pressure increases, but a weaker overall crypto market could push its price lower.
Trading tip: Check the live TRX/USDT chart, volume, and support levels before trading; short-term gains are not guaranteed.
#TRX✅ #TRXUpdate
85

·
--
Bullish
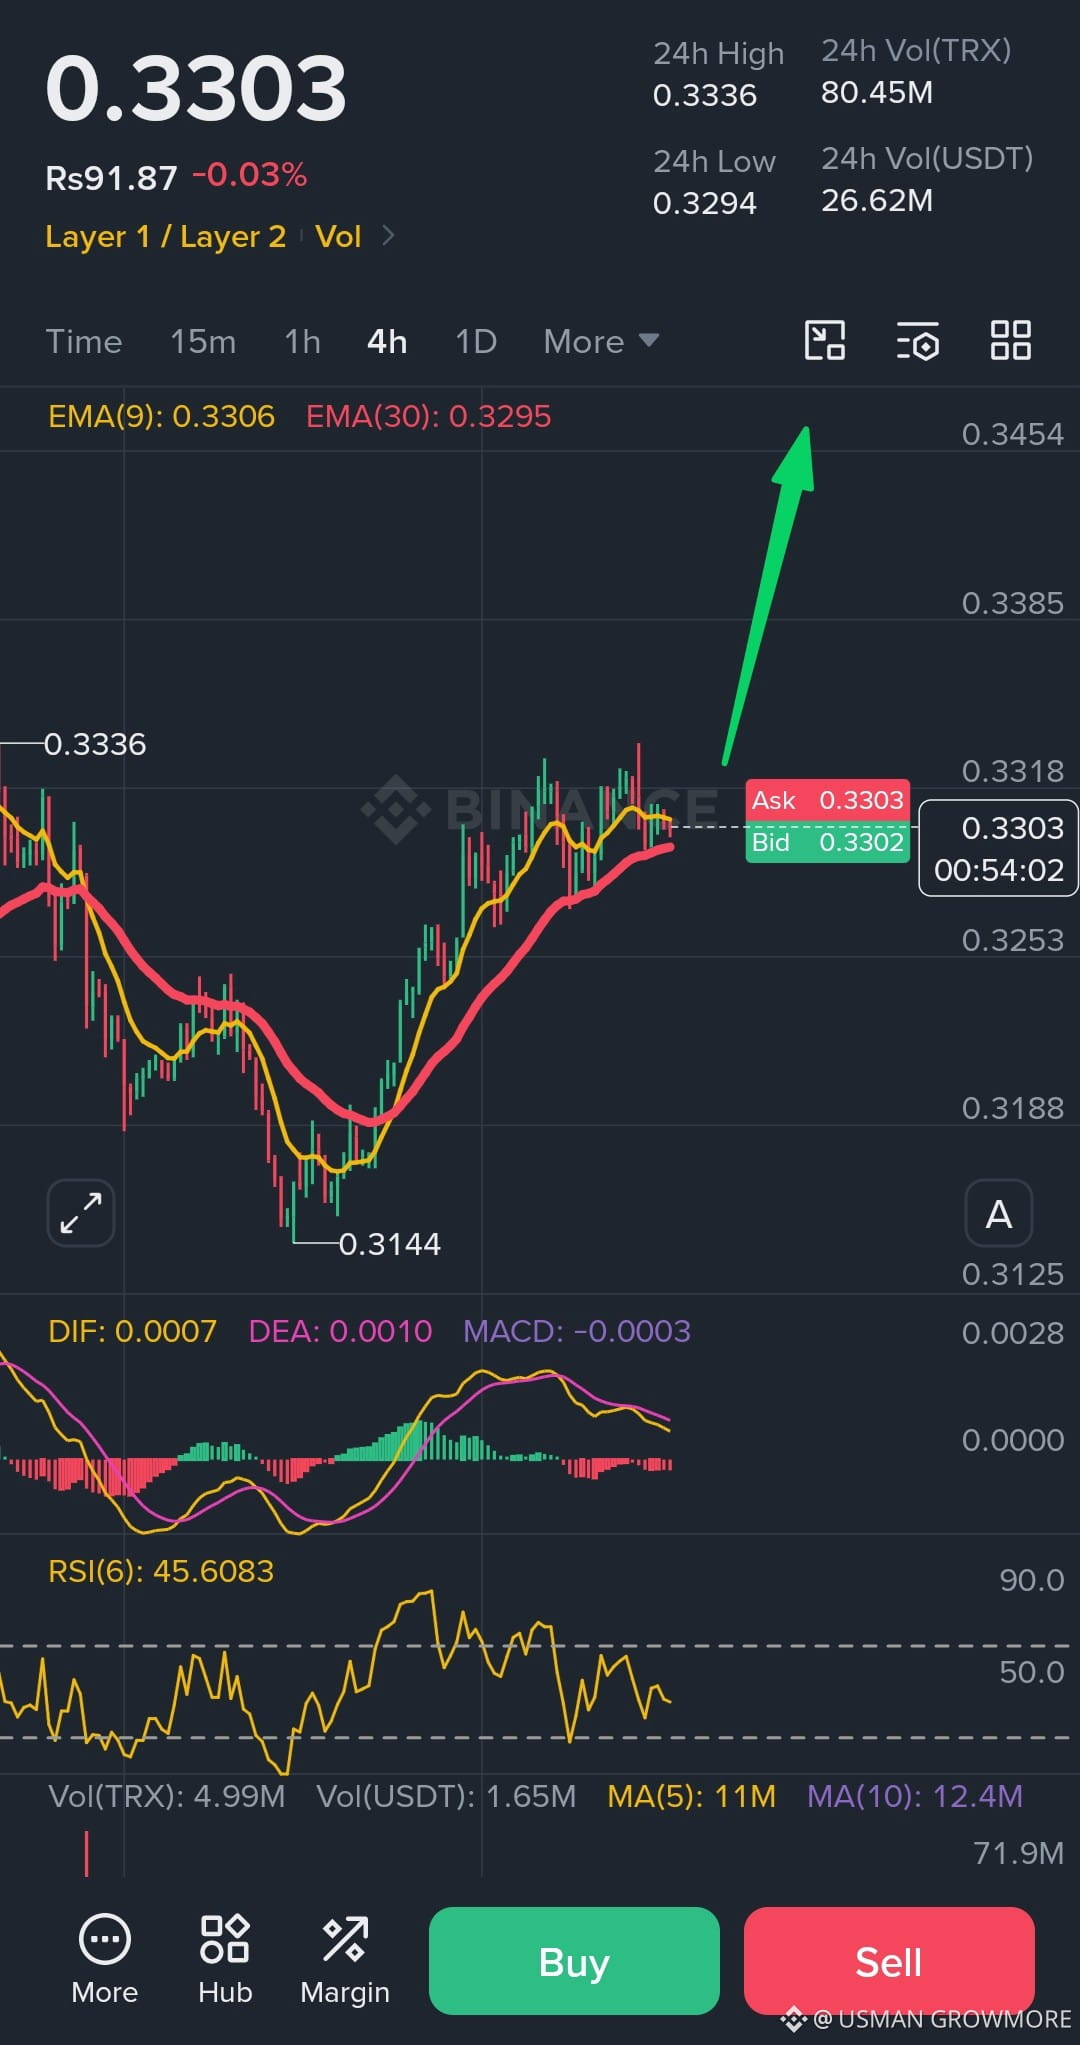
$TRX 🔥 Market is on fire! 🔥 Follow the instructions of plan , manage your risk, and stay disciplined to get profit. 🚀📈
🔰════════════════════🔰
⚖️ RISK MANAGEMENT PARAMETERS ⚖️
🔰════════════════════🔰
🚨 STOP LOSS (SL) 🛑
📉 🔴 **$0.3270**
🔹 Structural invalidation below the EMA(30) dynamic support and recent 4-hour local consolidation floor.
━━━━━━━━━━━━━━━━━━━━
🚀 TP1 • INITIAL TARGET 🎯
🟢 💲 **$0.3336**
🔹 Immediate retest of the 24-hour high and local resistance confluence.
━━━━━━━━━━━━━━━━━━━━
🏆 TP2 • PSYCHOLOGICAL WALL 💠
🟡 💲 **$0.3400**
🔹 Heavy limit order cluster resistance near the major psychological round number.
━━━━━━━━━━━━━━━━━━━━
🌊 TP3 • LIQUIDITY TARGET 👑
🔵 💲 **$0.3450**
🔹 Targeting the buy-side liquidity pool residing above the previous major structural swing high.
🔰════════════════════🔰
⚠️ 🧠 **DYOR** 🧠 ⚠️
📈 **Analysis Notice**
🔹 The analysis above is based on my personal research and market understanding.
🚫 **Disclaimer**
❗ This is **NOT** financial advice.
💸 **Trade Smart**
🛡️ Always manage your risk and never invest more than you can afford to lose.
🔍 **Do Your Own Research**
📚 Verify the information and make your own before investment decisions.🧠⚠️
═══════════════════════════
$TRX
#TRXTrading
#trxtrendingcoin
#TRXUpdate
{future}(TRXUSDT)
$TRX 🔥 Market is on fire! 🔥 Follow the instructions of plan , manage your risk, and stay disciplined to get profit. 🚀📈
🔰════════════════════🔰
⚖️ RISK MANAGEMENT PARAMETERS ⚖️
🔰════════════════════🔰
🚨 STOP LOSS (SL) 🛑
📉 🔴 **$0.3270**
🔹 Structural invalidation below the EMA(30) dynamic support and recent 4-hour local consolidation floor.
━━━━━━━━━━━━━━━━━━━━
🚀 TP1 • INITIAL TARGET 🎯
🟢 💲 **$0.3336**
🔹 Immediate retest of the 24-hour high and local resistance confluence.
━━━━━━━━━━━━━━━━━━━━
🏆 TP2 • PSYCHOLOGICAL WALL 💠
🟡 💲 **$0.3400**
🔹 Heavy limit order cluster resistance near the major psychological round number.
━━━━━━━━━━━━━━━━━━━━
🌊 TP3 • LIQUIDITY TARGET 👑
🔵 💲 **$0.3450**
🔹 Targeting the buy-side liquidity pool residing above the previous major structural swing high.
🔰════════════════════🔰
⚠️ 🧠 **DYOR** 🧠 ⚠️
📈 **Analysis Notice**
🔹 The analysis above is based on my personal research and market understanding.
🚫 **Disclaimer**
❗ This is **NOT** financial advice.
💸 **Trade Smart**
🛡️ Always manage your risk and never invest more than you can afford to lose.
🔍 **Do Your Own Research**
📚 Verify the information and make your own before investment decisions.🧠⚠️
═══════════════════════════
$TRX
#TRXTrading
#trxtrendingcoin
#TRXUpdate
🔰════════════════════🔰
⚖️ RISK MANAGEMENT PARAMETERS ⚖️
🔰════════════════════🔰
🚨 STOP LOSS (SL) 🛑
📉 🔴 **$0.3270**
🔹 Structural invalidation below the EMA(30) dynamic support and recent 4-hour local consolidation floor.
━━━━━━━━━━━━━━━━━━━━
🚀 TP1 • INITIAL TARGET 🎯
🟢 💲 **$0.3336**
🔹 Immediate retest of the 24-hour high and local resistance confluence.
━━━━━━━━━━━━━━━━━━━━
🏆 TP2 • PSYCHOLOGICAL WALL 💠
🟡 💲 **$0.3400**
🔹 Heavy limit order cluster resistance near the major psychological round number.
━━━━━━━━━━━━━━━━━━━━
🌊 TP3 • LIQUIDITY TARGET 👑
🔵 💲 **$0.3450**
🔹 Targeting the buy-side liquidity pool residing above the previous major structural swing high.
🔰════════════════════🔰
⚠️ 🧠 **DYOR** 🧠 ⚠️
📈 **Analysis Notice**
🔹 The analysis above is based on my personal research and market understanding.
🚫 **Disclaimer**
❗ This is **NOT** financial advice.
💸 **Trade Smart**
🛡️ Always manage your risk and never invest more than you can afford to lose.
🔍 **Do Your Own Research**
📚 Verify the information and make your own before investment decisions.🧠⚠️
═══════════════════════════
$TRX
#TRXTrading
#trxtrendingcoin
#TRXUpdate
14

·
--
نظرة عامة على الاتجاه: يتداول TRX حاليًا في اتجاه صعودي على المدى القصير، حيث يظهر السعر أعلى من متوسطات EMA قصيرة المدى ويخترق النطاق العلوي لـ Bollinger Bands.
JPG
مؤشرات الزخم: مؤشر القوة النسبية (RSI) عند 80.5، مما يشير إلى منطقة ذروة الشراء، بينما مؤشر (KDJ) (L) عند 99.78، مما يؤكد الزخم الصعودي القوي ولكنه يحذر من تصحيح محتمل.
JPG
مستويات الدعم: الدعم الفوري يقع عند 0.3425 (الحد الأوسط لـ Bollinger Bands) و0.3419 (EMA7).
JPG
مستويات المقاومة: المقاومة القوية تقع عند 0.3429 (الحد العلوي لـ Bollinger Bands) و0.3433 (مستوى نفسي).
JPG
{future}(TRXUSDT)
#TRXUpdate
نظرة عامة على الاتجاه: يتداول TRX حاليًا في اتجاه صعودي على المدى القصير، حيث يظهر السعر أعلى من متوسطات EMA قصيرة المدى ويخترق النطاق العلوي لـ Bollinger Bands.
JPG
مؤشرات الزخم: مؤشر القوة النسبية (RSI) عند 80.5، مما يشير إلى منطقة ذروة الشراء، بينما مؤشر (KDJ) (L) عند 99.78، مما يؤكد الزخم الصعودي القوي ولكنه يحذر من تصحيح محتمل.
JPG
مستويات الدعم: الدعم الفوري يقع عند 0.3425 (الحد الأوسط لـ Bollinger Bands) و0.3419 (EMA7).
JPG
مستويات المقاومة: المقاومة القوية تقع عند 0.3429 (الحد العلوي لـ Bollinger Bands) و0.3433 (مستوى نفسي).
JPG
#TRXUpdate
JPG
مؤشرات الزخم: مؤشر القوة النسبية (RSI) عند 80.5، مما يشير إلى منطقة ذروة الشراء، بينما مؤشر (KDJ) (L) عند 99.78، مما يؤكد الزخم الصعودي القوي ولكنه يحذر من تصحيح محتمل.
JPG
مستويات الدعم: الدعم الفوري يقع عند 0.3425 (الحد الأوسط لـ Bollinger Bands) و0.3419 (EMA7).
JPG
مستويات المقاومة: المقاومة القوية تقع عند 0.3429 (الحد العلوي لـ Bollinger Bands) و0.3433 (مستوى نفسي).
JPG
#TRXUpdate
80

·
--
Bearish
#TRXUpdate $TRX
{spot}(TRXUSDT)
$TRX HTF update:
TRON appears to be moving through a series of sub-cycles nested inside a much larger macro cycle. Each major advance and correction forms part of a broader long-term structure, with smaller zigzag patterns repeating throughout the trend.
Based on this cycle thesis, the current structure suggests that a deeper corrective phase is still ahead. This correction would not necessarily signal the end of the long-term trend, but rather a reset of the larger cycle, similar to how previous sub-cycles were reset before the next expansion began.
The bigger picture remains focused on cycle development, where short-term movements are only components of a much larger market structure. A significant reset could be required before the foundation for the next major long-term advance is established.
TRX 1.11%
#TRXUpdate $TRX
$TRX HTF update:
TRON appears to be moving through a series of sub-cycles nested inside a much larger macro cycle. Each major advance and correction forms part of a broader long-term structure, with smaller zigzag patterns repeating throughout the trend.
Based on this cycle thesis, the current structure suggests that a deeper corrective phase is still ahead. This correction would not necessarily signal the end of the long-term trend, but rather a reset of the larger cycle, similar to how previous sub-cycles were reset before the next expansion began.
The bigger picture remains focused on cycle development, where short-term movements are only components of a much larger market structure. A significant reset could be required before the foundation for the next major long-term advance is established.
TRX 1.11%
$TRX HTF update:
TRON appears to be moving through a series of sub-cycles nested inside a much larger macro cycle. Each major advance and correction forms part of a broader long-term structure, with smaller zigzag patterns repeating throughout the trend.
Based on this cycle thesis, the current structure suggests that a deeper corrective phase is still ahead. This correction would not necessarily signal the end of the long-term trend, but rather a reset of the larger cycle, similar to how previous sub-cycles were reset before the next expansion began.
The bigger picture remains focused on cycle development, where short-term movements are only components of a much larger market structure. A significant reset could be required before the foundation for the next major long-term advance is established.
TRX 1.11%
98

·
--
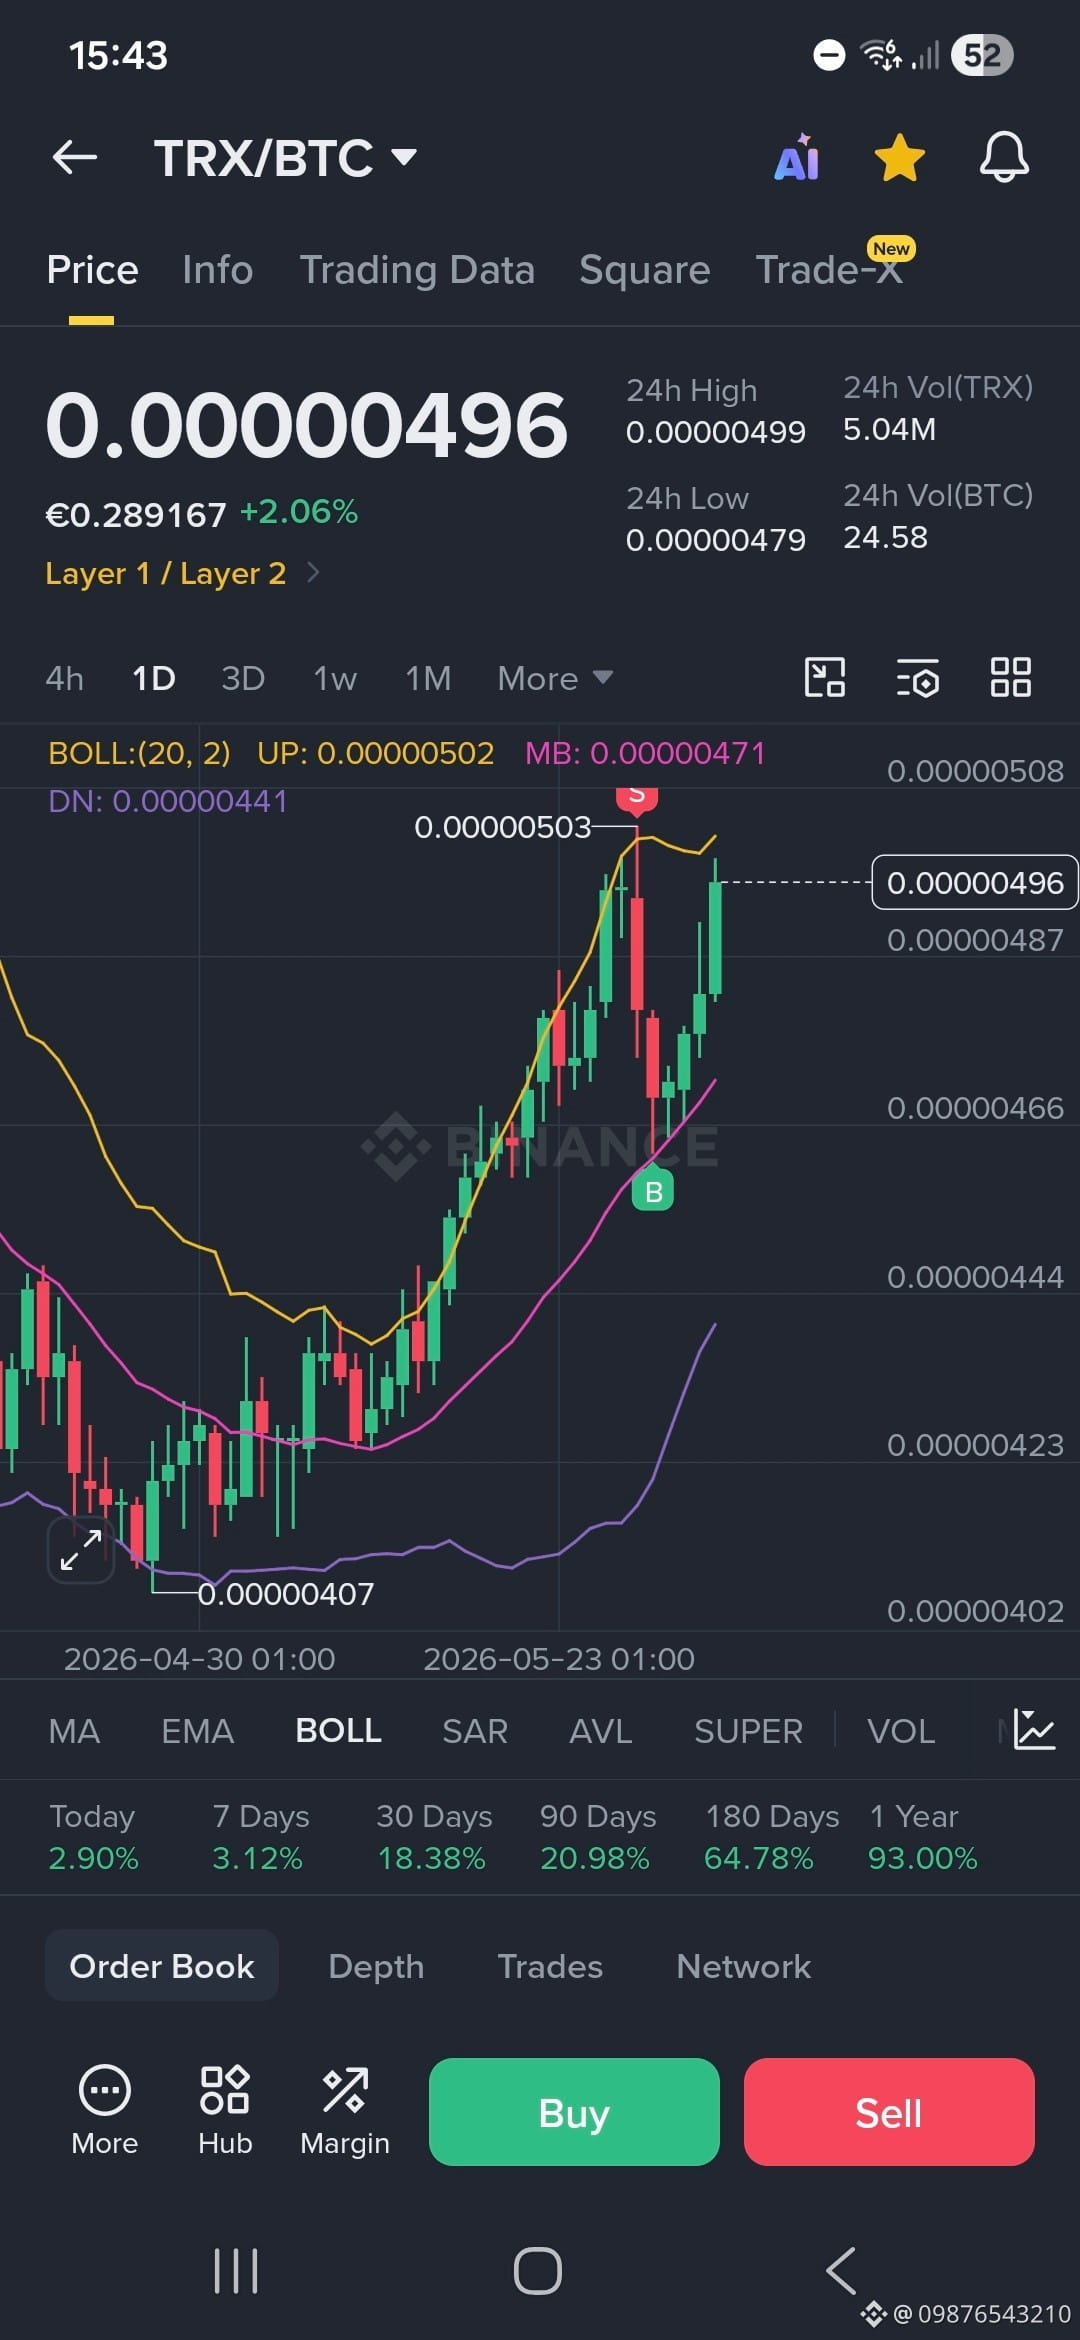
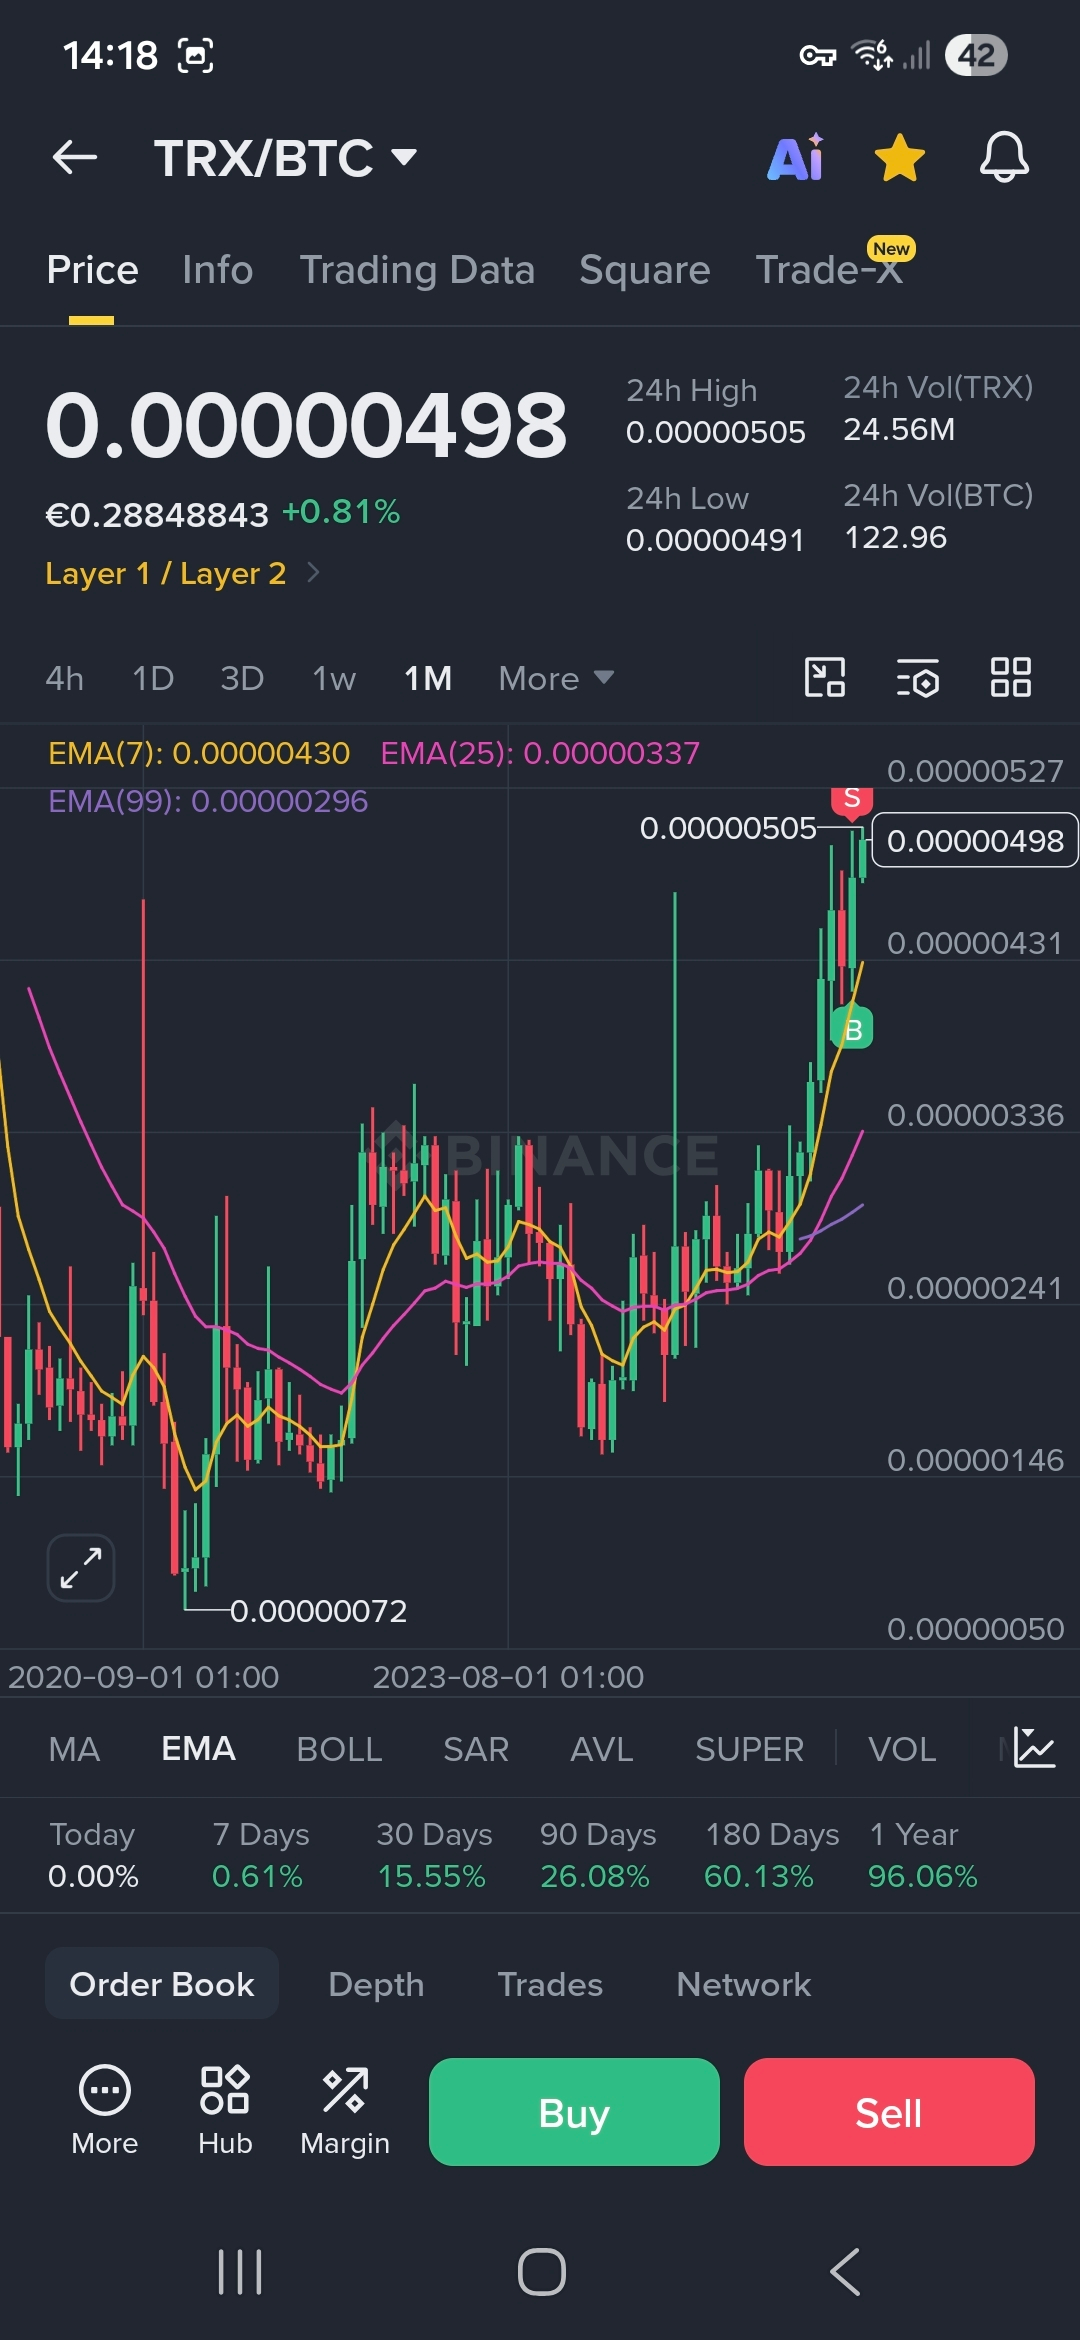
$TRX vrs $BTC will drop to around $55000 and trx will hold making more btc this happened before 5 or 6 years ago..hope #history repeats ??
#CryptoNewss #TRXUpdate #BTC🔥🔥🔥🔥🔥 #TRXCommunity
#newsdaily
$TRX vrs $BTC will drop to around $55000 and trx will hold making more btc this happened before 5 or 6 years ago..hope #history repeats ??
#CryptoNewss #TRXUpdate #BTC🔥🔥🔥🔥🔥 #TRXCommunity
#newsdaily
#CryptoNewss #TRXUpdate #BTC🔥🔥🔥🔥🔥 #TRXCommunity
#newsdaily
195

·
--
Bullish
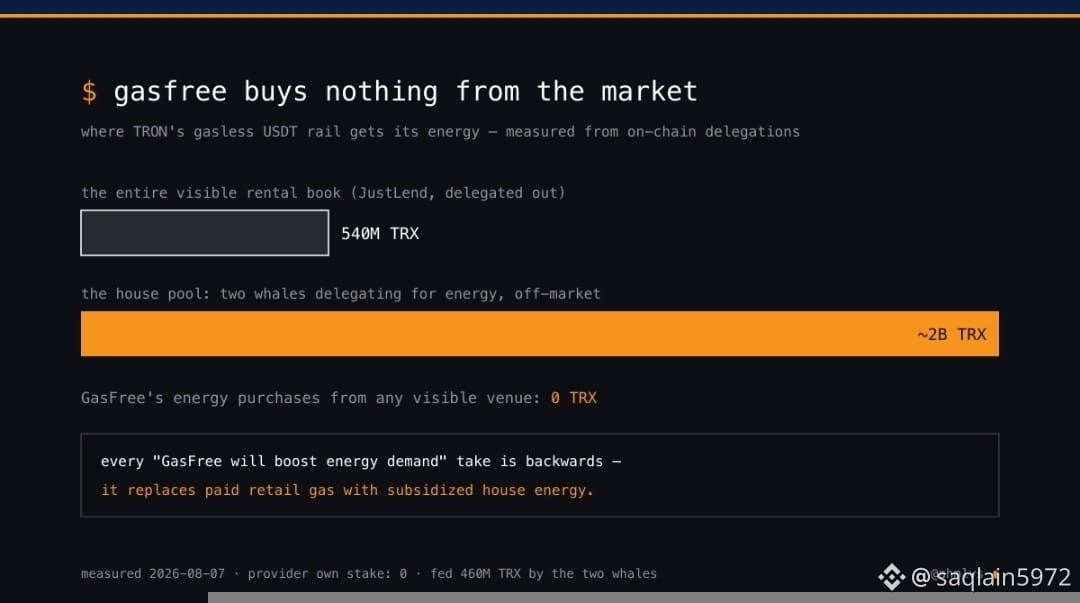
Who does GasFree buy energy from? I checked on-chain: nobody.
Zero $TRX delegated from JustLend's rental pool to the GasFree provider. Zero from the order-book markets. The provider (own stake: 0) runs entirely on ~460M TRX delegated by two Sun-orbit giga-whales — and those same whales delegate out ~2B TRX for energy in total. That's a second, invisible energy pool — nearly 4x JustLend's entire delegated book (540M TRX), operating outside every visible rental venue.
So the popular take — "GasFree adoption will boost TRON energy demand" — is backwards. GasFree doesn't buy energy; it replaces paid retail gas with subsidized house energy. Every USDT$USDT transfer it wins is a transfer the retail energy shops and order books lose.
If you sell energy on TRX markets, the biggest buyer in the room isn't in the room. The house lends to itself.
{spot}(TRXUSDT)
#TRXUpdate
Who does GasFree buy energy from? I checked on-chain: nobody.
Zero $TRX delegated from JustLend's rental pool to the GasFree provider. Zero from the order-book markets. The provider (own stake: 0) runs entirely on ~460M TRX delegated by two Sun-orbit giga-whales — and those same whales delegate out ~2B TRX for energy in total. That's a second, invisible energy pool — nearly 4x JustLend's entire delegated book (540M TRX), operating outside every visible rental venue.
So the popular take — "GasFree adoption will boost TRON energy demand" — is backwards. GasFree doesn't buy energy; it replaces paid retail gas with subsidized house energy. Every USDT$USDT transfer it wins is a transfer the retail energy shops and order books lose.
If you sell energy on TRX markets, the biggest buyer in the room isn't in the room. The house lends to itself.
#TRXUpdate
Zero $TRX delegated from JustLend's rental pool to the GasFree provider. Zero from the order-book markets. The provider (own stake: 0) runs entirely on ~460M TRX delegated by two Sun-orbit giga-whales — and those same whales delegate out ~2B TRX for energy in total. That's a second, invisible energy pool — nearly 4x JustLend's entire delegated book (540M TRX), operating outside every visible rental venue.
So the popular take — "GasFree adoption will boost TRON energy demand" — is backwards. GasFree doesn't buy energy; it replaces paid retail gas with subsidized house energy. Every USDT$USDT transfer it wins is a transfer the retail energy shops and order books lose.
If you sell energy on TRX markets, the biggest buyer in the room isn't in the room. The house lends to itself.
#TRXUpdate
14
TRON ($TRX ) Technical Update: June 8, 2026
$TRX has experienced a mild technical pullback, closely mirroring the broader distribution trend suppressing major Layer-1 protocols. After testing localized multi-month highs near $0.37 late last month, TRX has softened by roughly 11% to trade at $0.327.
### Key Technical Levels
Immediate Support ($0.31 – $0.32): The immediate defensive line is centered at $0.32, backed closely by the ascending 200-day Moving Average. Slicing cleanly below this cluster would neutralize the macro bull structure and risk a deeper slide toward the $0.29 demand pocket.
Immediate Resistance ($0.34 – $0.37): Near-term relief rallies face dynamic overhead resistance at the daily 50-day Moving Average around $0.35. Reclaiming this level is essential to challenge the late-May distribution peak of $0.37 and reopen a clean path toward psychological targets at $0.40.
{spot}(TRXUSDT)
#TRX #KOSPIDropsOver8PctTradingHalt #SaylorHintsStrategyBitcoinBuy #TRXUpdate
TRON ($TRX ) Technical Update: June 8, 2026
$TRX has experienced a mild technical pullback, closely mirroring the broader distribution trend suppressing major Layer-1 protocols. After testing localized multi-month highs near $0.37 late last month, TRX has softened by roughly 11% to trade at $0.327.
### Key Technical Levels
Immediate Support ($0.31 – $0.32): The immediate defensive line is centered at $0.32, backed closely by the ascending 200-day Moving Average. Slicing cleanly below this cluster would neutralize the macro bull structure and risk a deeper slide toward the $0.29 demand pocket.
Immediate Resistance ($0.34 – $0.37): Near-term relief rallies face dynamic overhead resistance at the daily 50-day Moving Average around $0.35. Reclaiming this level is essential to challenge the late-May distribution peak of $0.37 and reopen a clean path toward psychological targets at $0.40.
#TRX #KOSPIDropsOver8PctTradingHalt #SaylorHintsStrategyBitcoinBuy #TRXUpdate
$TRX has experienced a mild technical pullback, closely mirroring the broader distribution trend suppressing major Layer-1 protocols. After testing localized multi-month highs near $0.37 late last month, TRX has softened by roughly 11% to trade at $0.327.
### Key Technical Levels
Immediate Support ($0.31 – $0.32): The immediate defensive line is centered at $0.32, backed closely by the ascending 200-day Moving Average. Slicing cleanly below this cluster would neutralize the macro bull structure and risk a deeper slide toward the $0.29 demand pocket.
Immediate Resistance ($0.34 – $0.37): Near-term relief rallies face dynamic overhead resistance at the daily 50-day Moving Average around $0.35. Reclaiming this level is essential to challenge the late-May distribution peak of $0.37 and reopen a clean path toward psychological targets at $0.40.
#TRX #KOSPIDropsOver8PctTradingHalt #SaylorHintsStrategyBitcoinBuy #TRXUpdate
160
·
--
Bearish
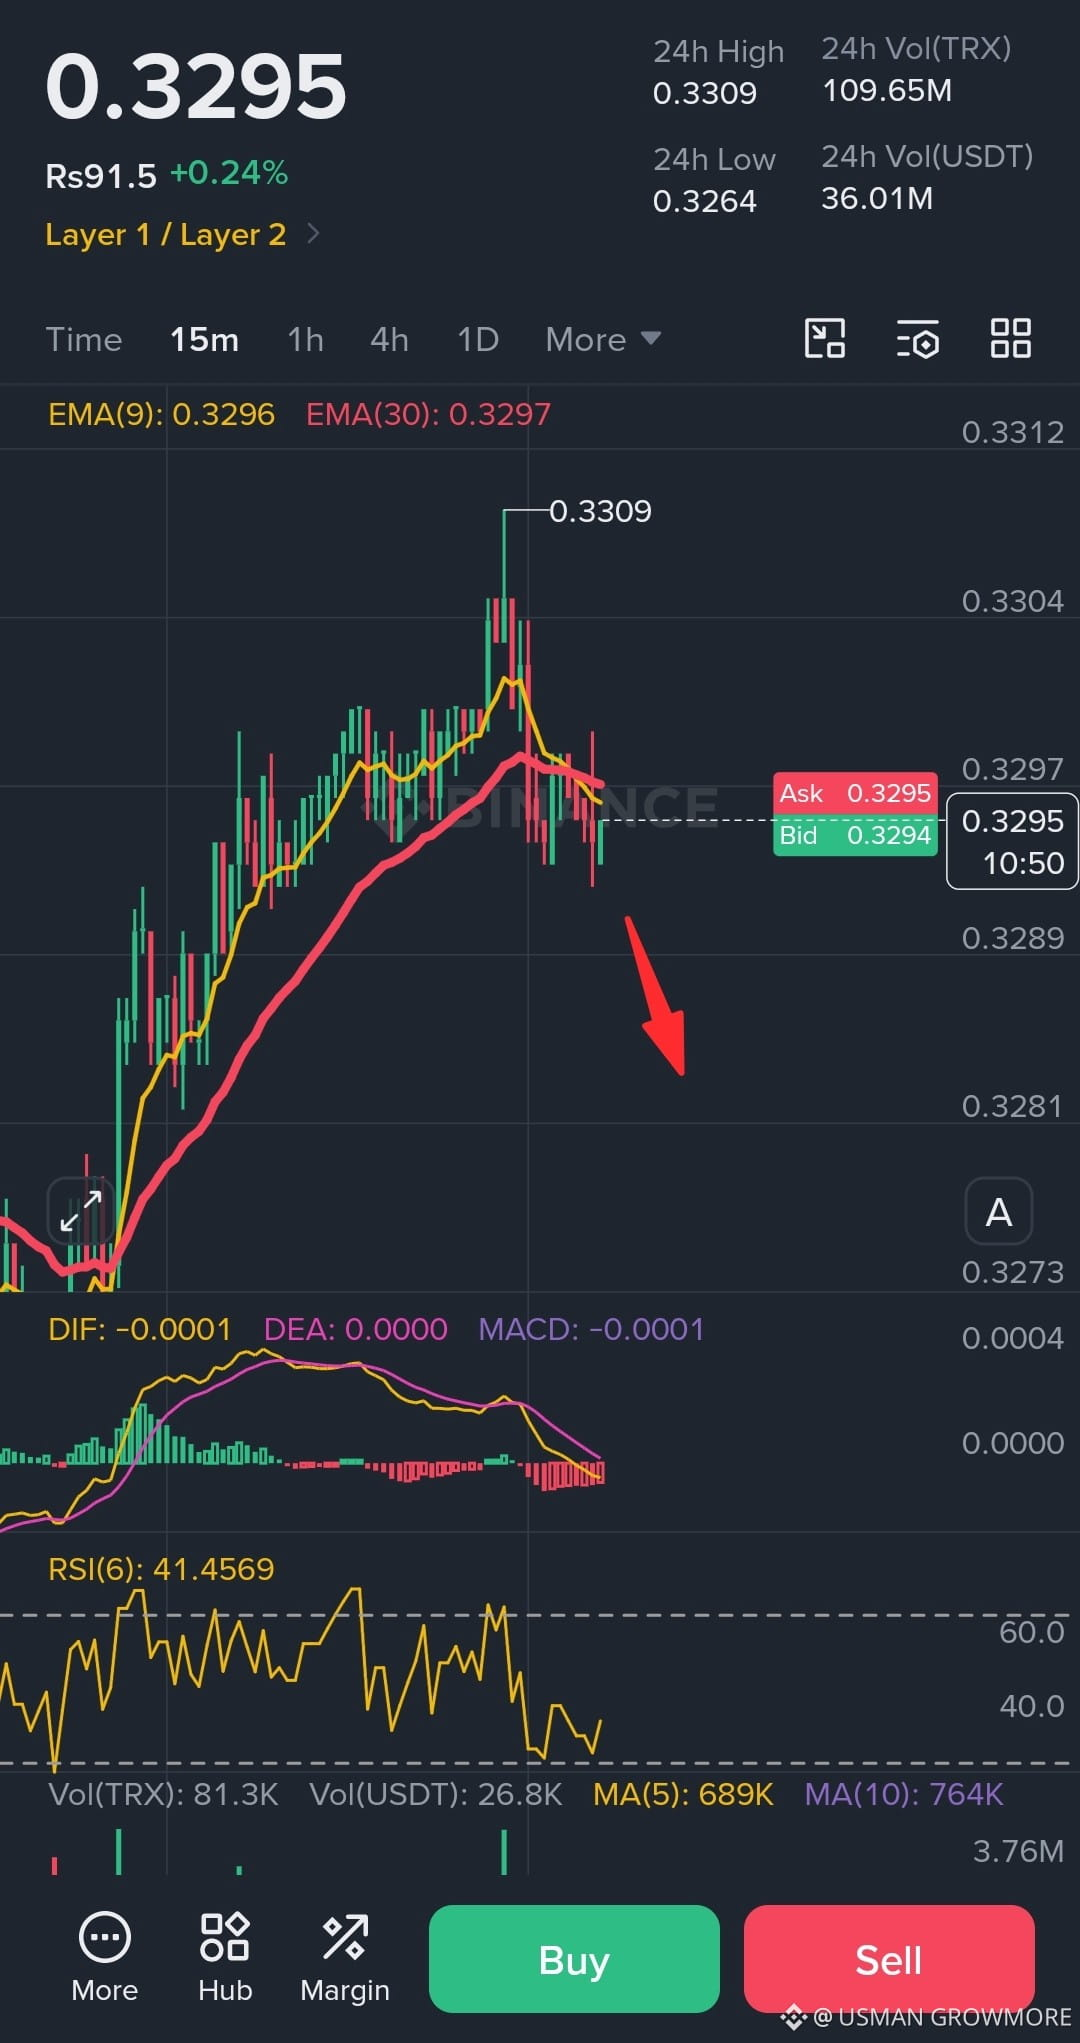
$TRX 🔥 Market is on fire! 🔥 Follow the instructions of plan , manage your risk, and stay disciplined to get profit. 🚀📈
🔰════════════════════🔰
⚖️ RISK MANAGEMENT PARAMETERS ⚖️
🔰════════════════════🔰
❤️ STOP LOSS (SL) 🚷
📉 $0.3300
🔹 Candle body close above the EMA(30) structural resistance crossover.
━━━━━━━━━━━━━━━━━━━━
💚 TP1 • IMMEDIATE SUPPORT 🍃
💰 $0.3280
🔹 Test of the local structural floor visible on grid lines.
━━━━━━━━━━━━━━━━━━━━
💜 TP2 • PSYCHOLOGICAL WALL 🪙
💰 $0.3270
🔹 Major whole-number support and historical order flow zone.
━━━━━━━━━━━━━━━━━━━━
💙 TP3 • EXTERNAL LIQUIDITY TARGET 🌐
💰 $0.3264
🔹 Clean sweep of the 24-hour structural low and liquidity pool.
🔰════════════════════🔰
⚠️ 🧠 **DYOR** 🧠 ⚠️
📈 **Analysis Notice**
🔹 The analysis above is based on my personal research and market understanding.
🚫 **Disclaimer**
❗ This is **NOT** financial advice.
💸 **Trade Smart**
🛡️ Always manage your risk and never invest more than you can afford to lose.
🔍 **Do Your Own Research**
📚 Verify the information and make your own before investment decisions.🧠⚠️
═══════════════════════════
$TRX
#TRXUpdate
#TRX✅
{future}(TRXUSDT)
$TRX 🔥 Market is on fire! 🔥 Follow the instructions of plan , manage your risk, and stay disciplined to get profit. 🚀📈
🔰════════════════════🔰
⚖️ RISK MANAGEMENT PARAMETERS ⚖️
🔰════════════════════🔰
❤️ STOP LOSS (SL) 🚷
📉 $0.3300
🔹 Candle body close above the EMA(30) structural resistance crossover.
━━━━━━━━━━━━━━━━━━━━
💚 TP1 • IMMEDIATE SUPPORT 🍃
💰 $0.3280
🔹 Test of the local structural floor visible on grid lines.
━━━━━━━━━━━━━━━━━━━━
💜 TP2 • PSYCHOLOGICAL WALL 🪙
💰 $0.3270
🔹 Major whole-number support and historical order flow zone.
━━━━━━━━━━━━━━━━━━━━
💙 TP3 • EXTERNAL LIQUIDITY TARGET 🌐
💰 $0.3264
🔹 Clean sweep of the 24-hour structural low and liquidity pool.
🔰════════════════════🔰
⚠️ 🧠 **DYOR** 🧠 ⚠️
📈 **Analysis Notice**
🔹 The analysis above is based on my personal research and market understanding.
🚫 **Disclaimer**
❗ This is **NOT** financial advice.
💸 **Trade Smart**
🛡️ Always manage your risk and never invest more than you can afford to lose.
🔍 **Do Your Own Research**
📚 Verify the information and make your own before investment decisions.🧠⚠️
═══════════════════════════
$TRX
#TRXUpdate
#TRX✅
🔰════════════════════🔰
⚖️ RISK MANAGEMENT PARAMETERS ⚖️
🔰════════════════════🔰
❤️ STOP LOSS (SL) 🚷
📉 $0.3300
🔹 Candle body close above the EMA(30) structural resistance crossover.
━━━━━━━━━━━━━━━━━━━━
💚 TP1 • IMMEDIATE SUPPORT 🍃
💰 $0.3280
🔹 Test of the local structural floor visible on grid lines.
━━━━━━━━━━━━━━━━━━━━
💜 TP2 • PSYCHOLOGICAL WALL 🪙
💰 $0.3270
🔹 Major whole-number support and historical order flow zone.
━━━━━━━━━━━━━━━━━━━━
💙 TP3 • EXTERNAL LIQUIDITY TARGET 🌐
💰 $0.3264
🔹 Clean sweep of the 24-hour structural low and liquidity pool.
🔰════════════════════🔰
⚠️ 🧠 **DYOR** 🧠 ⚠️
📈 **Analysis Notice**
🔹 The analysis above is based on my personal research and market understanding.
🚫 **Disclaimer**
❗ This is **NOT** financial advice.
💸 **Trade Smart**
🛡️ Always manage your risk and never invest more than you can afford to lose.
🔍 **Do Your Own Research**
📚 Verify the information and make your own before investment decisions.🧠⚠️
═══════════════════════════
$TRX
#TRXUpdate
#TRX✅
12
·
--
Bearish
TRON Holds Key Support as Network Revenue Surges – Here Is Why $TRX Could Be Preparing for Its Next Breakout
{spot}(TRXUSDT)
#TRXUpdate
TRON Holds Key Support as Network Revenue Surges – Here Is Why $TRX Could Be Preparing for Its Next Breakout
#TRXUpdate
#TRXUpdate

27

·
--
TRX stands out because its value is closely linked to real-world activity on the TRON network, especially stablecoin and USDT transactions. Its fast, low-cost network and growing use in digital payments could support long-term demand for TRX. However, its future price will still depend on crypto-market conditions, adoption, and regulatory developments, making the outlook cautiously positive but highly volatile.#TRXUpdate
TRX stands out because its value is closely linked to real-world activity on the TRON network, especially stablecoin and USDT transactions. Its fast, low-cost network and growing use in digital payments could support long-term demand for TRX. However, its future price will still depend on crypto-market conditions, adoption, and regulatory developments, making the outlook cautiously positive but highly volatile.#TRXUpdate

56

·
--
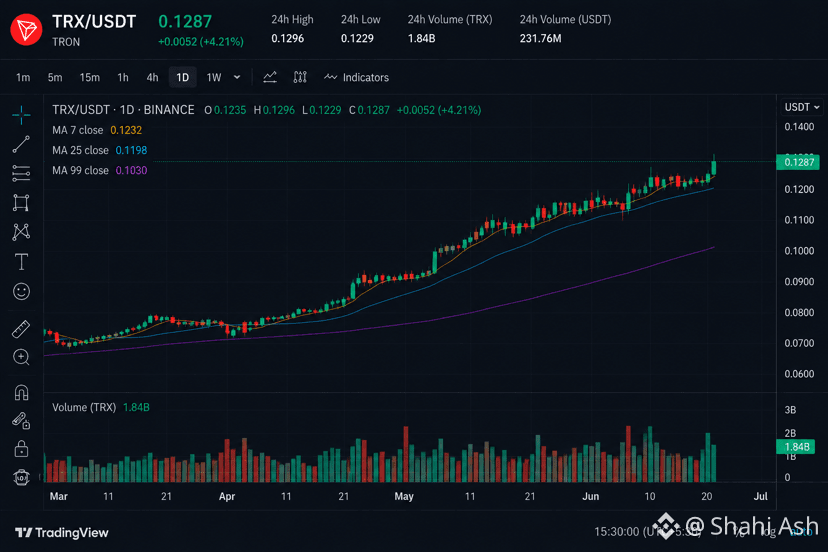
$TRX has established itself as one of crypto’s most resilient and widely used blockchain networks. Known for fast transactions and a thriving ecosystem, it continues to attract users and developers around the world. With strong utility and consistent growth, $TRX remains a project that many investors keep firmly on their radar.
#TRX #TRXUpdate #UNISurges20% #WarshFirstFOMCRatesHold
{spot}(TRXUSDT)
$TRX has established itself as one of crypto’s most resilient and widely used blockchain networks. Known for fast transactions and a thriving ecosystem, it continues to attract users and developers around the world. With strong utility and consistent growth, $TRX remains a project that many investors keep firmly on their radar.
#TRX #TRXUpdate #UNISurges20% #WarshFirstFOMCRatesHold
#TRX #TRXUpdate #UNISurges20% #WarshFirstFOMCRatesHold
89

·
--
🚨 $TRX — Consolidation Above Key Levels 📈
▪️ Order Flow Bias: Neutral/Bullish 🟡 (Range Accumulation)
▪️ Expected Mitigation Range: $0.3280 – $0.3290
▪️ Liquidity Target 1: $0.3320 (Range high)
▪️ Liquidity Target 2: $0.3340 (Resistance)
▪️ Structural Invalidation: $0.3260 (Break of support)
Institutional Macro & Market Analysis:
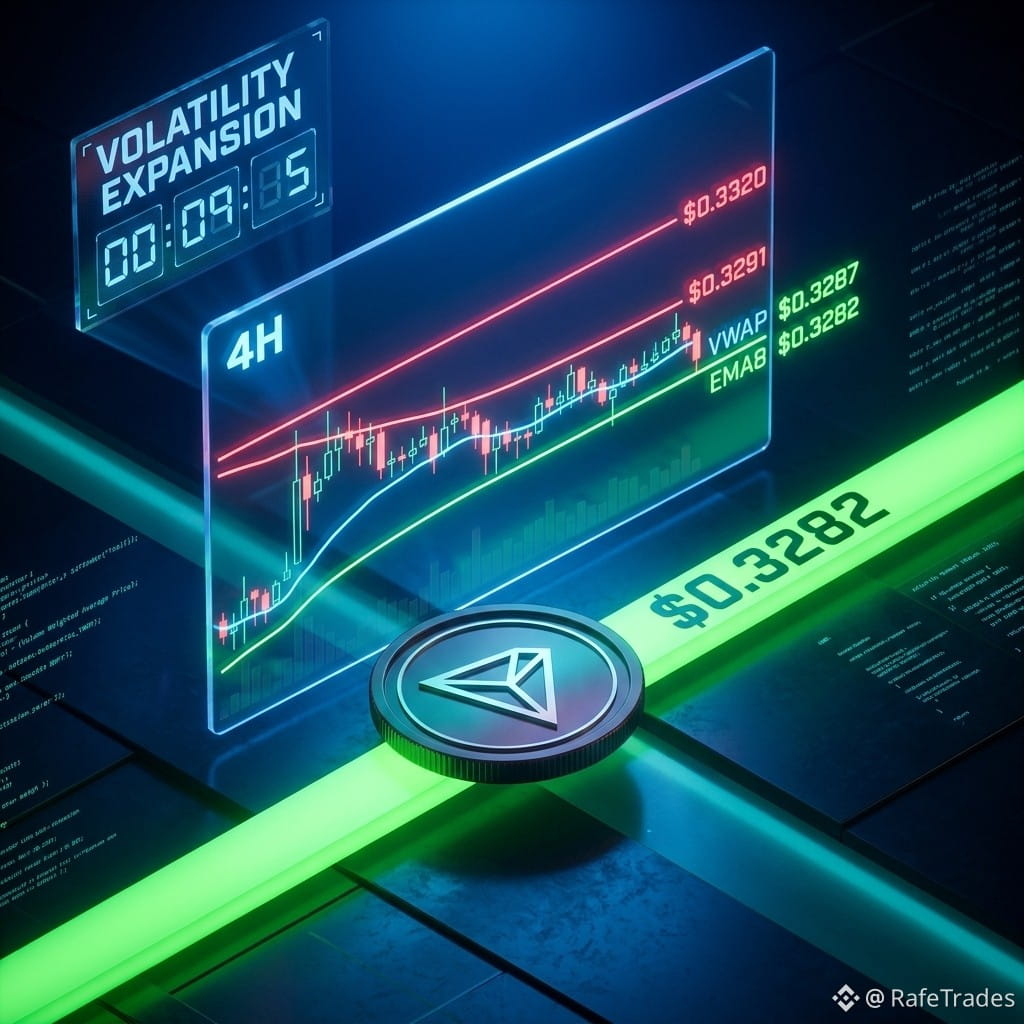
TRX is consolidating in a tight range, holding above VWAP ($0.3287) and EMA8 ($0.3282) at $0.3288. The 4H chart shows price compressing between $0.3282 support and $0.3291 resistance, with the next major resistance at $0.3320-$0.3340. This accumulation phase suggests buyers are absorbing supply.
The broader market is risk-off due to tariffs and geopolitical tensions, but TRX has shown relative strength by holding its range. A break above $0.3291 triggers a move toward $0.3320, while a breakdown below $0.3260 would invalidate the structure. Traders should watch for a volume spike to confirm the next directional move. The bias remains neutral but leans bullish as long as support holds.
#RafeTrades
"CLICK HERE👇👇👇 TO TRACK THE LIVE CHART & TRADE"
$TRX
Disclaimer: Market structure tracking for informational purposes. Not financial advice. Always DYOR. 🛡️
#TRXUpdate
🚨 $TRX — Consolidation Above Key Levels 📈
▪️ Order Flow Bias: Neutral/Bullish 🟡 (Range Accumulation)
▪️ Expected Mitigation Range: $0.3280 – $0.3290
▪️ Liquidity Target 1: $0.3320 (Range high)
▪️ Liquidity Target 2: $0.3340 (Resistance)
▪️ Structural Invalidation: $0.3260 (Break of support)
Institutional Macro & Market Analysis:
TRX is consolidating in a tight range, holding above VWAP ($0.3287) and EMA8 ($0.3282) at $0.3288. The 4H chart shows price compressing between $0.3282 support and $0.3291 resistance, with the next major resistance at $0.3320-$0.3340. This accumulation phase suggests buyers are absorbing supply.
The broader market is risk-off due to tariffs and geopolitical tensions, but TRX has shown relative strength by holding its range. A break above $0.3291 triggers a move toward $0.3320, while a breakdown below $0.3260 would invalidate the structure. Traders should watch for a volume spike to confirm the next directional move. The bias remains neutral but leans bullish as long as support holds.
#RafeTrades
"CLICK HERE👇👇👇 TO TRACK THE LIVE CHART & TRADE"
$TRX
Disclaimer: Market structure tracking for informational purposes. Not financial advice. Always DYOR. 🛡️
#TRXUpdate
▪️ Order Flow Bias: Neutral/Bullish 🟡 (Range Accumulation)
▪️ Expected Mitigation Range: $0.3280 – $0.3290
▪️ Liquidity Target 1: $0.3320 (Range high)
▪️ Liquidity Target 2: $0.3340 (Resistance)
▪️ Structural Invalidation: $0.3260 (Break of support)
Institutional Macro & Market Analysis:
TRX is consolidating in a tight range, holding above VWAP ($0.3287) and EMA8 ($0.3282) at $0.3288. The 4H chart shows price compressing between $0.3282 support and $0.3291 resistance, with the next major resistance at $0.3320-$0.3340. This accumulation phase suggests buyers are absorbing supply.
The broader market is risk-off due to tariffs and geopolitical tensions, but TRX has shown relative strength by holding its range. A break above $0.3291 triggers a move toward $0.3320, while a breakdown below $0.3260 would invalidate the structure. Traders should watch for a volume spike to confirm the next directional move. The bias remains neutral but leans bullish as long as support holds.
#RafeTrades
"CLICK HERE👇👇👇 TO TRACK THE LIVE CHART & TRADE"
$TRX
Disclaimer: Market structure tracking for informational purposes. Not financial advice. Always DYOR. 🛡️
#TRXUpdate
8


·
--
$TRX
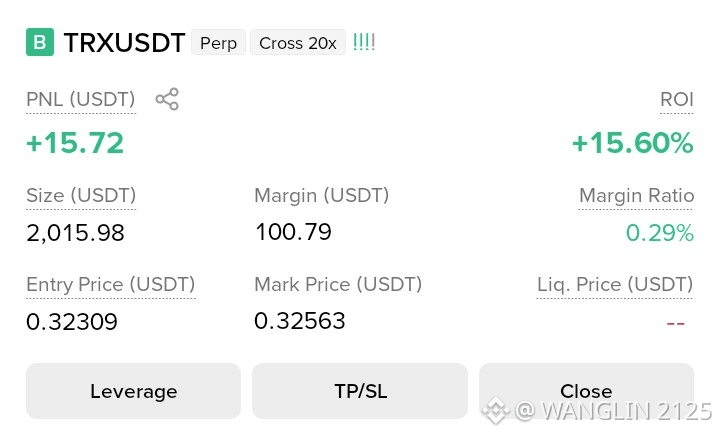
Green day. 📈✅
Another profitable trade. 💚
Trade. Profit. Repeat. 🚀
Consistency beats luck. 📊
Patience pays. 💰
Small profit, big progress. 🔥
Trust the process. ✅
One step closer to the goal. 🎯
Disciplined trading wins. 📈
Not every trade is perfect, but consistency matters. 💚
$TRX
{spot}(TRXUSDT)
#TRX #Trxusdt #TRXUpdate #TRXNews
$TRX
Green day. 📈✅
Another profitable trade. 💚
Trade. Profit. Repeat. 🚀
Consistency beats luck. 📊
Patience pays. 💰
Small profit, big progress. 🔥
Trust the process. ✅
One step closer to the goal. 🎯
Disciplined trading wins. 📈
Not every trade is perfect, but consistency matters. 💚
$TRX
#TRX #Trxusdt #TRXUpdate #TRXNews
Green day. 📈✅
Another profitable trade. 💚
Trade. Profit. Repeat. 🚀
Consistency beats luck. 📊
Patience pays. 💰
Small profit, big progress. 🔥
Trust the process. ✅
One step closer to the goal. 🎯
Disciplined trading wins. 📈
Not every trade is perfect, but consistency matters. 💚
$TRX
#TRX #Trxusdt #TRXUpdate #TRXNews
76

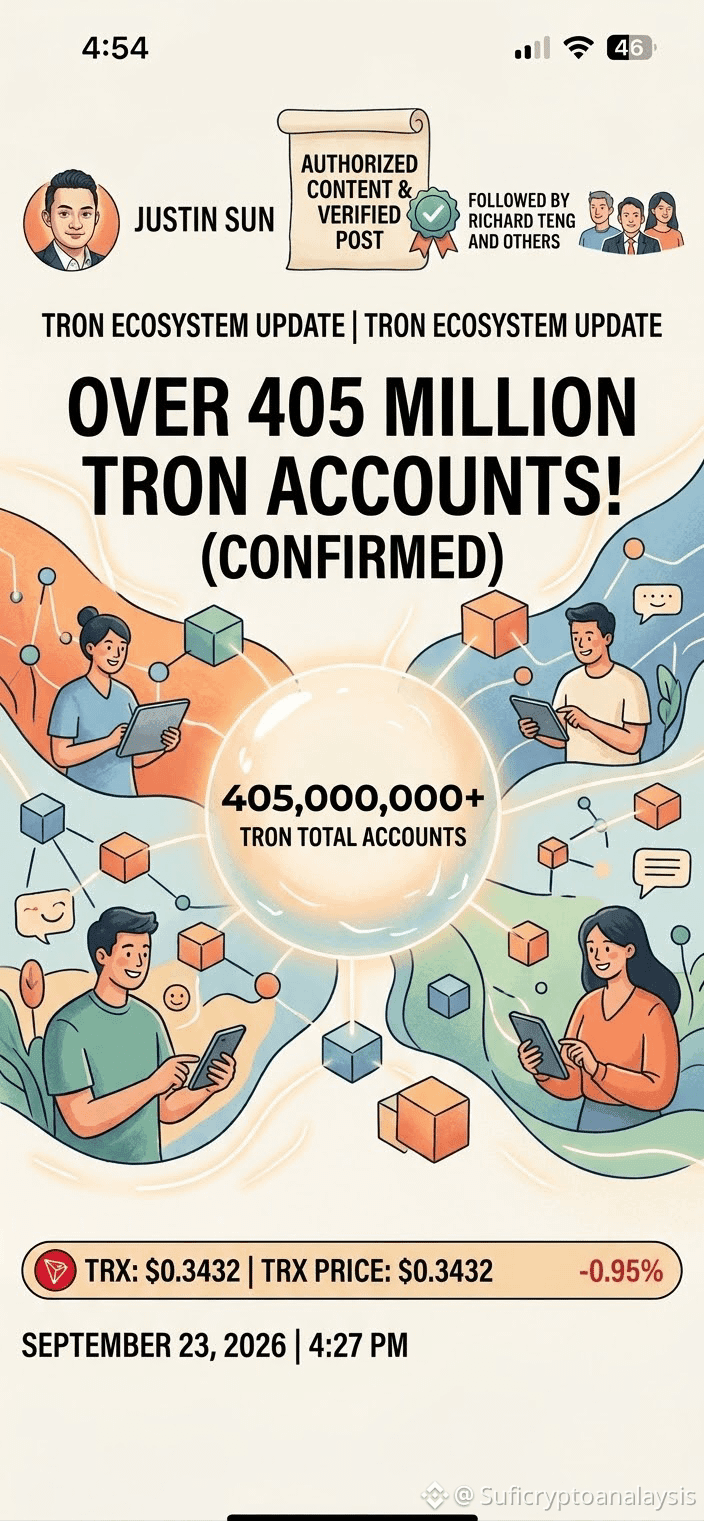
Big milestone for TRON! 🎉 We’ve officially crossed 405 million total accounts. Huge thanks to the incredible community building and growing with us every single day as we push towards a decentralized future. 🚀
{spot}(TRXUSDT)
Big milestone for TRON! 🎉 We’ve officially crossed 405 million total accounts. Huge thanks to the incredible community building and growing with us every single day as we push towards a decentralized future. 🚀
9

·
--
Copa do mundo está chegando, vocês acham que haverá interferência direta em alguma cripto? $TRX U#TRXUpdate
{spot}(TRXUSDT)
Copa do mundo está chegando, vocês acham que haverá interferência direta em alguma cripto? $TRX U#TRXUpdate

6
1
10.3k
Article
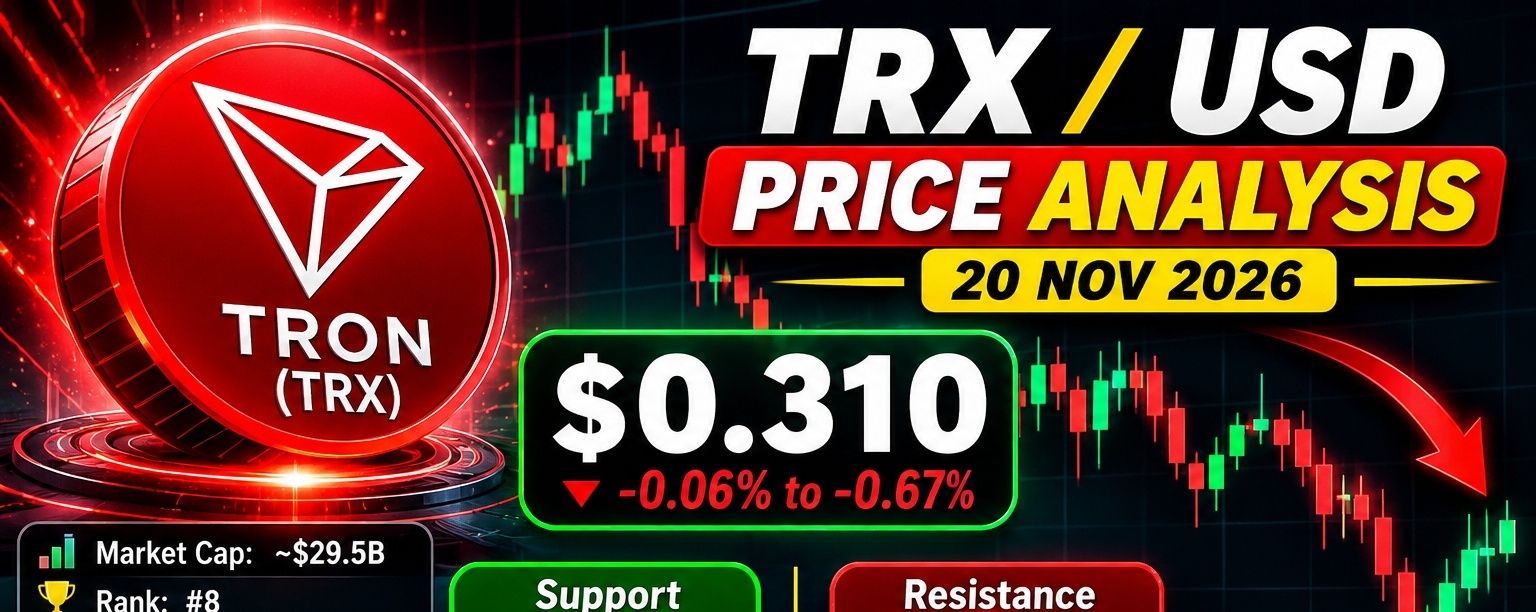
TRX / USD - Complete Analysis
Nov 20, 2026$TRX / USD - Complete Analysis
Nov 20, 2026
1. Current Price Snapshot
Price: $0.309 - $0.310
24h Change: -0.06% to -0.67% (varies slightly by exchange)
24h Range: $0.3089 - $0.3137
Open: $0.3114
Market Cap: ∼$29.5B - $29.72B
Rank: #8
24h Volume: ∼$298M
Circulating Supply: ∼95.04B TRX
1 TRX = $0.3102 | 1 USD = 3.22 TRX
{spot}(TRXUSDT)
2. Performance
| Period | Return |
| --- | --- |
| 5 Days | +1.3% |
| 7 Days | -1.66% to -1.76% |
| 1 Month | -6.19% |
| 6 Months | -13.45% |
| Year-to-Date | +8.29% |
| 1 Year | +10.84% |
TRX is still positive for the year, but in a clear medium-term downtrend from its May high near $0.377.
3. Technical Analysis
Overall Bias: Bearish on Daily, Mixed on Lower Timeframes
Daily: Strong bearish bias
4-Hour: Bullish bias - short-term bounce attempt
Weekly: Strong bullish bias - long-term structure still intact
Key Indicators:
RSI (14): 37 - 41.1 - Near oversold, but not yet extreme. Below its signal line, showing weak momentum.
50-Day EMA / SMA: ∼$0.323 - $0.325 - Price is below it
200-Day EMA / SMA: ∼$0.326 - $0.333 - Price is below it
Death Cross: 50-day below 200-day is still in place - this is the main bearish signal
MACD: Bearish crossover, negative histogram contracting
Volatility (30d): ∼2.5% daily, ∼23% annualized
Green Days (30d): Only 10/30 - buyers are not in control
Fear & Greed (Market-wide): 10 - Extreme Fear
What this means: $TRX is stuck under all major moving averages. Every bounce toward $0.32 has been sold. RSI near 40 suggests sellers are tired, but not yet exhausted enough for a strong reversal.
4. Support & Resistance Levels
Immediate Levels:
| Type | Level | Distance |
| --- | --- | --- |
| Resistance 1 | $0.3108 - $0.311 | Right at price - must break to go up |
| Resistance 2 | $0.321 - $0.3243 | +4.4% - Major breakout level, tested 9 times |
| Resistance 3 | $0.3250 | +5.1% - Former support from October |
| Support 1 | $0.3023 - $0.303 | -2.7% - Bought 5 times, last Nov 16 |
| Support 2 (Major) | $0.2994 - $0.3000 | -3.5% - Psychological $0.30 floor |
| Support 3 | $0.2977 | -3.8% |
| Major High | $0.3759 | +21% - May 26 high |
Nearest support is $0.29943 and nearest resistance is $0.32495 according to live level data.
5. Three Scenarios
1. Bullish Scenario (30% probability)
Hold above $0.302, break and close above $0.311, then $0.324.
Target: $0.325 - $0.330, then $0.352
Invalidation: Daily close below $0.299
2. Base / Sideways Scenario (50% probability) - Most Likely
Chop between $0.300 - $0.318 for rest of November. This matches most November forecasts: $0.306 - $0.313 average, $0.300 support, $0.318 resistance.
3. Bearish Scenario (20% probability)
Lose $0.300 on high volume.
Target: $0.277 - $0.285, then $0.27
This would confirm continuation of the downtrend from $0.377.
6. Short-Term Forecast
| Date | Forecast |
| --- | --- |
| Nov 20 | $0.3102 - $0.3128 |
| Nov 21 | $0.3089 - $0.3153 |
| Nov 22 | $0.3083 - $0.3142 |
| Nov 23 | $0.3085 - $0.3126 |
Most models expect flat to slightly up, not a big move.
7. Longer-Term Forecast
End of Nov 2026: $0.306 - $0.319
End of 2026: $0.314 - $0.333 (CoinCodex: $0.3326, Changelly avg: $0.328)
2027-2030: Most long-term models stay bullish on TRON fundamentals (high USDT usage, low fees, DPoS), with 2030 targets ranging widely from $0.80 to $1.43 - these are speculative and should not be used for trading.
8. Trading Plan
For Traders:
Do NOT chase below $0.324. The trend is still down.
Buy Zone: $0.300 - $0.303 with tight stop below $0.297
Breakout Buy: Only on daily close above $0.3243, target $0.352
Sell / Short Zone: $0.321 - $0.325, stop above $0.330
For Long-Term Holders:
$TRX is holding the $0.30 floor well despite Extreme Fear in the market and a death cross. That's relative strength vs many altcoins. Accumulating in $0.29 - $0.30 zone with a long horizon makes more sense than buying at current $0.31 in the middle of the range.
Risk Management:
Never risk more than 1-2% of capital per trade. Crypto is volatile, and TRX can move 3-5% in a day on Bitcoin news alone.
#TradingCommunity #TradingTales #trxanalysis #TRXUpdate #TRXUSDT #CryptoSignals #LongTrade #FuturesTrading #BinanceFeed #ScalpSetup #MomentumTrade #Leverage15x #CryptoTamil #BreakoutSetup
TRX / USD - Complete Analysis Nov 20, 2026
$TRX / USD - Complete Analysis
Nov 20, 2026
1. Current Price Snapshot
Price: $0.309 - $0.310
24h Change: -0.06% to -0.67% (varies slightly by exchange)
24h Range: $0.3089 - $0.3137
Open: $0.3114
Market Cap: ∼$29.5B - $29.72B
Rank: #8
24h Volume: ∼$298M
Circulating Supply: ∼95.04B TRX
1 TRX = $0.3102 | 1 USD = 3.22 TRX
2. Performance
| Period | Return |
| --- | --- |
| 5 Days | +1.3% |
| 7 Days | -1.66% to -1.76% |
| 1 Month | -6.19% |
| 6 Months | -13.45% |
| Year-to-Date | +8.29% |
| 1 Year | +10.84% |
TRX is still positive for the year, but in a clear medium-term downtrend from its May high near $0.377.
3. Technical Analysis
Overall Bias: Bearish on Daily, Mixed on Lower Timeframes
Daily: Strong bearish bias
4-Hour: Bullish bias - short-term bounce attempt
Weekly: Strong bullish bias - long-term structure still intact
Key Indicators:
RSI (14): 37 - 41.1 - Near oversold, but not yet extreme. Below its signal line, showing weak momentum.
50-Day EMA / SMA: ∼$0.323 - $0.325 - Price is below it
200-Day EMA / SMA: ∼$0.326 - $0.333 - Price is below it
Death Cross: 50-day below 200-day is still in place - this is the main bearish signal
MACD: Bearish crossover, negative histogram contracting
Volatility (30d): ∼2.5% daily, ∼23% annualized
Green Days (30d): Only 10/30 - buyers are not in control
Fear & Greed (Market-wide): 10 - Extreme Fear
What this means: $TRX is stuck under all major moving averages. Every bounce toward $0.32 has been sold. RSI near 40 suggests sellers are tired, but not yet exhausted enough for a strong reversal.
4. Support & Resistance Levels
Immediate Levels:
| Type | Level | Distance |
| --- | --- | --- |
| Resistance 1 | $0.3108 - $0.311 | Right at price - must break to go up |
| Resistance 2 | $0.321 - $0.3243 | +4.4% - Major breakout level, tested 9 times |
| Resistance 3 | $0.3250 | +5.1% - Former support from October |
| Support 1 | $0.3023 - $0.303 | -2.7% - Bought 5 times, last Nov 16 |
| Support 2 (Major) | $0.2994 - $0.3000 | -3.5% - Psychological $0.30 floor |
| Support 3 | $0.2977 | -3.8% |
| Major High | $0.3759 | +21% - May 26 high |
Nearest support is $0.29943 and nearest resistance is $0.32495 according to live level data.
5. Three Scenarios
1. Bullish Scenario (30% probability)
Hold above $0.302, break and close above $0.311, then $0.324.
Target: $0.325 - $0.330, then $0.352
Invalidation: Daily close below $0.299
2. Base / Sideways Scenario (50% probability) - Most Likely
Chop between $0.300 - $0.318 for rest of November. This matches most November forecasts: $0.306 - $0.313 average, $0.300 support, $0.318 resistance.
3. Bearish Scenario (20% probability)
Lose $0.300 on high volume.
Target: $0.277 - $0.285, then $0.27
This would confirm continuation of the downtrend from $0.377.
6. Short-Term Forecast
| Date | Forecast |
| --- | --- |
| Nov 20 | $0.3102 - $0.3128 |
| Nov 21 | $0.3089 - $0.3153 |
| Nov 22 | $0.3083 - $0.3142 |
| Nov 23 | $0.3085 - $0.3126 |
Most models expect flat to slightly up, not a big move.
7. Longer-Term Forecast
End of Nov 2026: $0.306 - $0.319
End of 2026: $0.314 - $0.333 (CoinCodex: $0.3326, Changelly avg: $0.328)
2027-2030: Most long-term models stay bullish on TRON fundamentals (high USDT usage, low fees, DPoS), with 2030 targets ranging widely from $0.80 to $1.43 - these are speculative and should not be used for trading.
8. Trading Plan
For Traders:
Do NOT chase below $0.324. The trend is still down.
Buy Zone: $0.300 - $0.303 with tight stop below $0.297
Breakout Buy: Only on daily close above $0.3243, target $0.352
Sell / Short Zone: $0.321 - $0.325, stop above $0.330
For Long-Term Holders:
$TRX is holding the $0.30 floor well despite Extreme Fear in the market and a death cross. That's relative strength vs many altcoins. Accumulating in $0.29 - $0.30 zone with a long horizon makes more sense than buying at current $0.31 in the middle of the range.
Risk Management:
Never risk more than 1-2% of capital per trade. Crypto is volatile, and TRX can move 3-5% in a day on Bitcoin news alone.
#TradingCommunity #TradingTales #trxanalysis #TRXUpdate #TRXUSDT #CryptoSignals #LongTrade #FuturesTrading #BinanceFeed #ScalpSetup #MomentumTrade #Leverage15x #CryptoTamil #BreakoutSetup
Nov 20, 2026
1. Current Price Snapshot
Price: $0.309 - $0.310
24h Change: -0.06% to -0.67% (varies slightly by exchange)
24h Range: $0.3089 - $0.3137
Open: $0.3114
Market Cap: ∼$29.5B - $29.72B
Rank: #8
24h Volume: ∼$298M
Circulating Supply: ∼95.04B TRX
1 TRX = $0.3102 | 1 USD = 3.22 TRX
2. Performance
| Period | Return |
| --- | --- |
| 5 Days | +1.3% |
| 7 Days | -1.66% to -1.76% |
| 1 Month | -6.19% |
| 6 Months | -13.45% |
| Year-to-Date | +8.29% |
| 1 Year | +10.84% |
TRX is still positive for the year, but in a clear medium-term downtrend from its May high near $0.377.
3. Technical Analysis
Overall Bias: Bearish on Daily, Mixed on Lower Timeframes
Daily: Strong bearish bias
4-Hour: Bullish bias - short-term bounce attempt
Weekly: Strong bullish bias - long-term structure still intact
Key Indicators:
RSI (14): 37 - 41.1 - Near oversold, but not yet extreme. Below its signal line, showing weak momentum.
50-Day EMA / SMA: ∼$0.323 - $0.325 - Price is below it
200-Day EMA / SMA: ∼$0.326 - $0.333 - Price is below it
Death Cross: 50-day below 200-day is still in place - this is the main bearish signal
MACD: Bearish crossover, negative histogram contracting
Volatility (30d): ∼2.5% daily, ∼23% annualized
Green Days (30d): Only 10/30 - buyers are not in control
Fear & Greed (Market-wide): 10 - Extreme Fear
What this means: $TRX is stuck under all major moving averages. Every bounce toward $0.32 has been sold. RSI near 40 suggests sellers are tired, but not yet exhausted enough for a strong reversal.
4. Support & Resistance Levels
Immediate Levels:
| Type | Level | Distance |
| --- | --- | --- |
| Resistance 1 | $0.3108 - $0.311 | Right at price - must break to go up |
| Resistance 2 | $0.321 - $0.3243 | +4.4% - Major breakout level, tested 9 times |
| Resistance 3 | $0.3250 | +5.1% - Former support from October |
| Support 1 | $0.3023 - $0.303 | -2.7% - Bought 5 times, last Nov 16 |
| Support 2 (Major) | $0.2994 - $0.3000 | -3.5% - Psychological $0.30 floor |
| Support 3 | $0.2977 | -3.8% |
| Major High | $0.3759 | +21% - May 26 high |
Nearest support is $0.29943 and nearest resistance is $0.32495 according to live level data.
5. Three Scenarios
1. Bullish Scenario (30% probability)
Hold above $0.302, break and close above $0.311, then $0.324.
Target: $0.325 - $0.330, then $0.352
Invalidation: Daily close below $0.299
2. Base / Sideways Scenario (50% probability) - Most Likely
Chop between $0.300 - $0.318 for rest of November. This matches most November forecasts: $0.306 - $0.313 average, $0.300 support, $0.318 resistance.
3. Bearish Scenario (20% probability)
Lose $0.300 on high volume.
Target: $0.277 - $0.285, then $0.27
This would confirm continuation of the downtrend from $0.377.
6. Short-Term Forecast
| Date | Forecast |
| --- | --- |
| Nov 20 | $0.3102 - $0.3128 |
| Nov 21 | $0.3089 - $0.3153 |
| Nov 22 | $0.3083 - $0.3142 |
| Nov 23 | $0.3085 - $0.3126 |
Most models expect flat to slightly up, not a big move.
7. Longer-Term Forecast
End of Nov 2026: $0.306 - $0.319
End of 2026: $0.314 - $0.333 (CoinCodex: $0.3326, Changelly avg: $0.328)
2027-2030: Most long-term models stay bullish on TRON fundamentals (high USDT usage, low fees, DPoS), with 2030 targets ranging widely from $0.80 to $1.43 - these are speculative and should not be used for trading.
8. Trading Plan
For Traders:
Do NOT chase below $0.324. The trend is still down.
Buy Zone: $0.300 - $0.303 with tight stop below $0.297
Breakout Buy: Only on daily close above $0.3243, target $0.352
Sell / Short Zone: $0.321 - $0.325, stop above $0.330
For Long-Term Holders:
$TRX is holding the $0.30 floor well despite Extreme Fear in the market and a death cross. That's relative strength vs many altcoins. Accumulating in $0.29 - $0.30 zone with a long horizon makes more sense than buying at current $0.31 in the middle of the range.
Risk Management:
Never risk more than 1-2% of capital per trade. Crypto is volatile, and TRX can move 3-5% in a day on Bitcoin news alone.
#TradingCommunity #TradingTales #trxanalysis #TRXUpdate #TRXUSDT #CryptoSignals #LongTrade #FuturesTrading #BinanceFeed #ScalpSetup #MomentumTrade #Leverage15x #CryptoTamil #BreakoutSetup
86
Log in to explore more content
Join global crypto users on Binance Square
⚡️ Get latest and useful information about crypto.
💬 Trusted by the world’s largest crypto exchange.
👍 Discover real insights from verified creators.
Email / Phone number
Trending Topics
1
#BTCReboundsAbove$60KAmidWhaleDipBuying
81,456 views
368 Discussing
2
#SolanaSets2027RoadmapToDoubleComputeCapacity
66,241 views
1,077 Discussing
3
#CaliforniaNvidiaProbeExaminesPotentialCriminalViolations
17,858 views
149 Discussing
4
#BlackRockLaunchesHKDollarDigitalLiquidityFund
54,757 views
809 Discussing
5
#NvidiaLoses$2.7TrillionInMonthAndAHalf
79,559 views
319 Discussing
6
#GlobalStocksFaceLongestLosingStreakSince2023
580,802 views
3,536 Discussing
7
#BlackRockIBITPostsRecord$541MSingleDayOutflow
97,715 views
186 Discussing
8
#AnthropicPlungesTowardIPOPriceonDay2
322,964 views
2,376 Discussing
9
#TwentyOneCapitalAdds172.25BTC
173,239 views
1,685 Discussing
10
#HKBillWouldExcludeTokenizedDepositsFromVirtualAssets
18,747 views
109 Discussing