
#intcb
intcb
22,802 views
647 Discussing
Hot
Latest

·
--
Is $INTCB building momentum or stalling near recent highs?
The asset trades at $56.12, reflecting a 2.60% daily gain on $12.45M in volume. Notably, recent hourly volume is significantly lower than the preceding average, signaling cautious participation despite the upward move.
Watch for a clean breakout above the 57.00 range high to confirm potential strength. Conversely, a drop below the 52.49 range low would invalidate the current bullish structure.
Does this volume divergence suggest a breakout is imminent, or is the lack of buyer participation a warning of exhaustion?
Tap $INTCB for the live chart. #INTCB #BinanceSquare
Is $INTCB building momentum or stalling near recent highs?
The asset trades at $56.12, reflecting a 2.60% daily gain on $12.45M in volume. Notably, recent hourly volume is significantly lower than the preceding average, signaling cautious participation despite the upward move.
Watch for a clean breakout above the 57.00 range high to confirm potential strength. Conversely, a drop below the 52.49 range low would invalidate the current bullish structure.
Does this volume divergence suggest a breakout is imminent, or is the lack of buyer participation a warning of exhaustion?
Tap $INTCB for the live chart. #INTCB #BinanceSquare
The asset trades at $56.12, reflecting a 2.60% daily gain on $12.45M in volume. Notably, recent hourly volume is significantly lower than the preceding average, signaling cautious participation despite the upward move.
Watch for a clean breakout above the 57.00 range high to confirm potential strength. Conversely, a drop below the 52.49 range low would invalidate the current bullish structure.
Does this volume divergence suggest a breakout is imminent, or is the lack of buyer participation a warning of exhaustion?
Tap $INTCB for the live chart. #INTCB #BinanceSquare
2

·
--
Is the current $INTCB liquidity sufficient to sustain this recent momentum?
Trading at $55.51, the asset shows a 1.57% gain, though hourly volume has dipped to just 0.31x of the 23-hour average. This suggests potential exhaustion after recent volatility.
A bullish scenario requires a clean breakout above $57 to confirm renewed interest. Conversely, failing to hold the $52.49 range low would invalidate the current structure.
Does the drop in hourly volume signal a genuine cooling off period, or are traders simply waiting for a breakout above $57?
Tap $INTCB for the live chart. #INTCB #BinanceSquare
Is the current $INTCB liquidity sufficient to sustain this recent momentum?
Trading at $55.51, the asset shows a 1.57% gain, though hourly volume has dipped to just 0.31x of the 23-hour average. This suggests potential exhaustion after recent volatility.
A bullish scenario requires a clean breakout above $57 to confirm renewed interest. Conversely, failing to hold the $52.49 range low would invalidate the current structure.
Does the drop in hourly volume signal a genuine cooling off period, or are traders simply waiting for a breakout above $57?
Tap $INTCB for the live chart. #INTCB #BinanceSquare
Trading at $55.51, the asset shows a 1.57% gain, though hourly volume has dipped to just 0.31x of the 23-hour average. This suggests potential exhaustion after recent volatility.
A bullish scenario requires a clean breakout above $57 to confirm renewed interest. Conversely, failing to hold the $52.49 range low would invalidate the current structure.
Does the drop in hourly volume signal a genuine cooling off period, or are traders simply waiting for a breakout above $57?
Tap $INTCB for the live chart. #INTCB #BinanceSquare
56

·
--
Bullish
🚀 Intel is waking up — and $57.00 is the line that matters
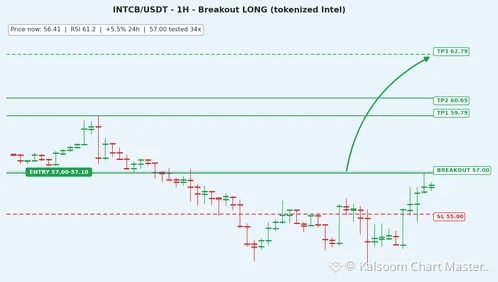
INTCB (tokenized Intel stock on Binance) is +5.5% today at $56.41, riding the chip rally after Nvidia's earnings beat. Hourly closes have climbed all day — $53.51 → $56.41 — and it's above both EMAs with RSI 61.2.
Why $57.00 matters: it's the 24h high, tested 34 times in 48 hours. A break above it opens $59.79, then $60.65.
Roadmap:
$55.00 support → $56.41 → $57.00 breakout → $59.79 → $60.65 → $62.79
🟢 LONG — $INTCB (on breakout)
Entry: $57.00 – $57.10
SL: $55.00
TP1: $59.79 | TP2: $60.65 | TP3: $62.79
⚠️ Don't buy at $56.41 — wait for the break of $57.00. If it rejects $57.00 again, the breakout fails.
Receipts: our calls overnight — SOL TP2 $75, BREV TP2 $0.1200, MMT full TP3, ZEC TP1.
Is Intel the next chip stock to run? 🤔
#intcb #Intel #Stocks
NFA — This is not financial advice, DYOR.
🚀 Intel is waking up — and $57.00 is the line that matters
INTCB (tokenized Intel stock on Binance) is +5.5% today at $56.41, riding the chip rally after Nvidia's earnings beat. Hourly closes have climbed all day — $53.51 → $56.41 — and it's above both EMAs with RSI 61.2.
Why $57.00 matters: it's the 24h high, tested 34 times in 48 hours. A break above it opens $59.79, then $60.65.
Roadmap:
$55.00 support → $56.41 → $57.00 breakout → $59.79 → $60.65 → $62.79
🟢 LONG — $INTCB (on breakout)
Entry: $57.00 – $57.10
SL: $55.00
TP1: $59.79 | TP2: $60.65 | TP3: $62.79
⚠️ Don't buy at $56.41 — wait for the break of $57.00. If it rejects $57.00 again, the breakout fails.
Receipts: our calls overnight — SOL TP2 $75, BREV TP2 $0.1200, MMT full TP3, ZEC TP1.
Is Intel the next chip stock to run? 🤔
#intcb #Intel #Stocks
NFA — This is not financial advice, DYOR.
INTCB (tokenized Intel stock on Binance) is +5.5% today at $56.41, riding the chip rally after Nvidia's earnings beat. Hourly closes have climbed all day — $53.51 → $56.41 — and it's above both EMAs with RSI 61.2.
Why $57.00 matters: it's the 24h high, tested 34 times in 48 hours. A break above it opens $59.79, then $60.65.
Roadmap:
$55.00 support → $56.41 → $57.00 breakout → $59.79 → $60.65 → $62.79
🟢 LONG — $INTCB (on breakout)
Entry: $57.00 – $57.10
SL: $55.00
TP1: $59.79 | TP2: $60.65 | TP3: $62.79
⚠️ Don't buy at $56.41 — wait for the break of $57.00. If it rejects $57.00 again, the breakout fails.
Receipts: our calls overnight — SOL TP2 $75, BREV TP2 $0.1200, MMT full TP3, ZEC TP1.
Is Intel the next chip stock to run? 🤔
#intcb #Intel #Stocks
NFA — This is not financial advice, DYOR.
68

·
--
$INTCB looks ready to go higher from here 🚀
It is holding strong right near today's high at $56.3200
RSI sits at 58 showing power without being too hot
Volume is up at $15.5M as buyers step in today
🎯 Buy $INTCB 55.2136 to 56.1591
Stop loss 51.8596
Targets 62.1355 / 66.2459 / 72.4114
Tap $INTCB to buy it here
#INTCB #TradingSignals
$INTCB looks ready to go higher from here 🚀
It is holding strong right near today's high at $56.3200
RSI sits at 58 showing power without being too hot
Volume is up at $15.5M as buyers step in today
🎯 Buy $INTCB 55.2136 to 56.1591
Stop loss 51.8596
Targets 62.1355 / 66.2459 / 72.4114
Tap $INTCB to buy it here
#INTCB #TradingSignals
It is holding strong right near today's high at $56.3200
RSI sits at 58 showing power without being too hot
Volume is up at $15.5M as buyers step in today
🎯 Buy $INTCB 55.2136 to 56.1591
Stop loss 51.8596
Targets 62.1355 / 66.2459 / 72.4114
Tap $INTCB to buy it here
#INTCB #TradingSignals
4

·
--
$INTCB Price Breaks Below Recent Low into Oversold Zone
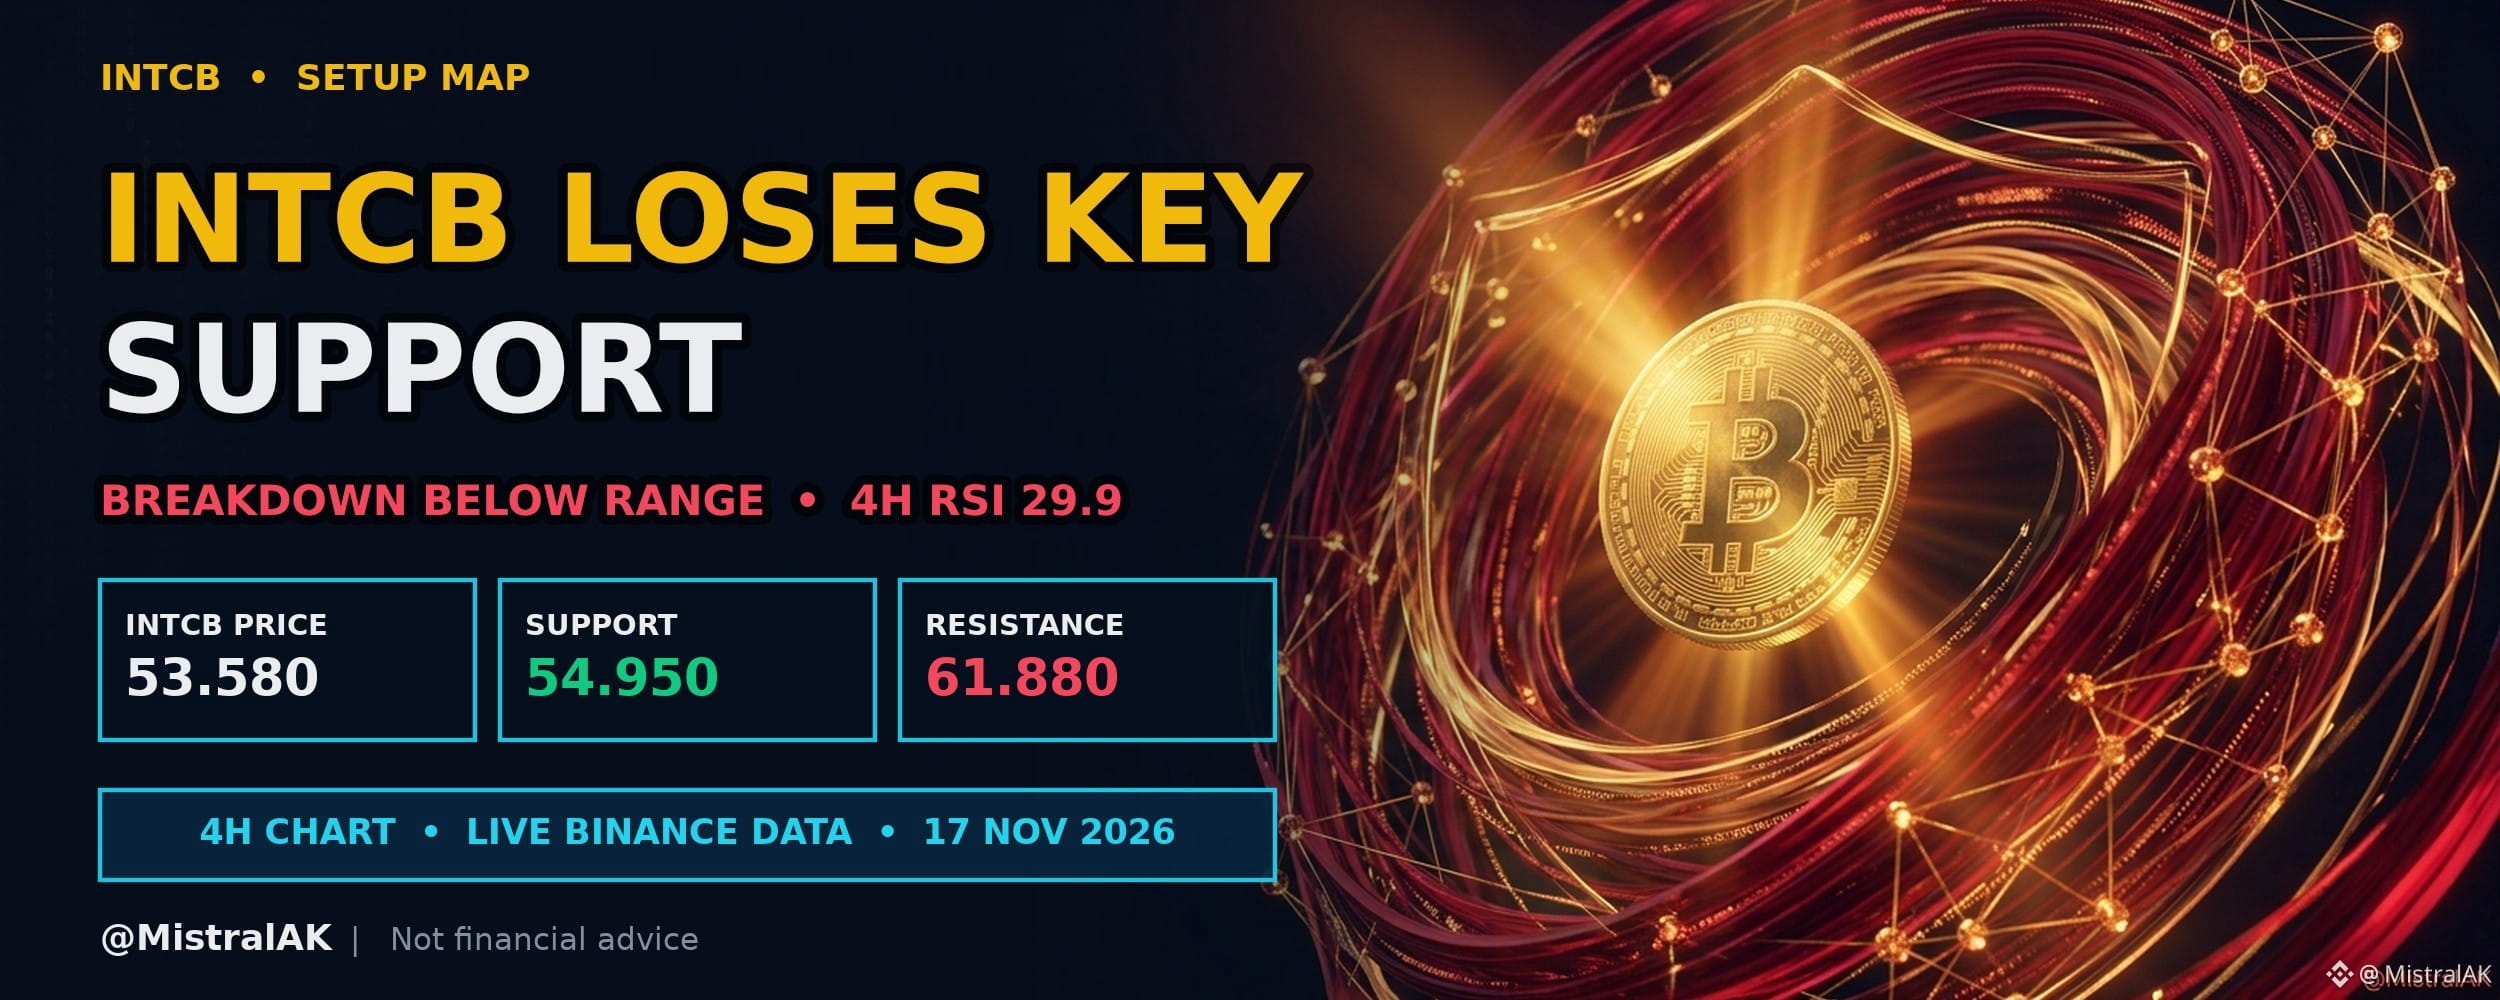
$INTCB trades at 53.580 USD, down 8.2% over the past 24 hours, with 4H RSI at 29.9 (oversold).
Downward pressure over the past twenty-four hours has driven price below its recent low on the four-hour chart. An oversold relative strength index highlights stretched momentum, leaving traders to watch whether key support holds.
KEY LEVELS
▪️ Resistance: 61.880 USD (20-candle 4H swing high)
▪️ Support: 54.950 USD (20-candle 4H swing low)
▪️ EMA 20 / EMA 50: 57.470 / 58.739 USD (short-term trend filter)
WHAT WOULD CONFIRM WEAKNESS
▪️ 4H closes staying below 54.950 USD, turning it into resistance
▪️ Rallies failing near EMA 20 (57.470 USD)
WHAT WOULD INVALIDATE IT
▪️ A 4H close back above 54.950 USD (range reclaimed)
▪️ Price recovering EMA 20 (57.470 USD)
Do you expect a temporary bounce from oversold levels, or will downward momentum continue on the four-hour chart?
Not financial advice. Always DYOR.
Like & Follow for Daily Trade Analytics & Insider News. @MistralAK
#INTCB #Breakdown #TrendingTopic
$INTCB Price Breaks Below Recent Low into Oversold Zone
$INTCB trades at 53.580 USD, down 8.2% over the past 24 hours, with 4H RSI at 29.9 (oversold).
Downward pressure over the past twenty-four hours has driven price below its recent low on the four-hour chart. An oversold relative strength index highlights stretched momentum, leaving traders to watch whether key support holds.
KEY LEVELS
▪️ Resistance: 61.880 USD (20-candle 4H swing high)
▪️ Support: 54.950 USD (20-candle 4H swing low)
▪️ EMA 20 / EMA 50: 57.470 / 58.739 USD (short-term trend filter)
WHAT WOULD CONFIRM WEAKNESS
▪️ 4H closes staying below 54.950 USD, turning it into resistance
▪️ Rallies failing near EMA 20 (57.470 USD)
WHAT WOULD INVALIDATE IT
▪️ A 4H close back above 54.950 USD (range reclaimed)
▪️ Price recovering EMA 20 (57.470 USD)
Do you expect a temporary bounce from oversold levels, or will downward momentum continue on the four-hour chart?
Not financial advice. Always DYOR.
Like & Follow for Daily Trade Analytics & Insider News. @MistralAK
#INTCB #Breakdown #TrendingTopic
$INTCB trades at 53.580 USD, down 8.2% over the past 24 hours, with 4H RSI at 29.9 (oversold).
Downward pressure over the past twenty-four hours has driven price below its recent low on the four-hour chart. An oversold relative strength index highlights stretched momentum, leaving traders to watch whether key support holds.
KEY LEVELS
▪️ Resistance: 61.880 USD (20-candle 4H swing high)
▪️ Support: 54.950 USD (20-candle 4H swing low)
▪️ EMA 20 / EMA 50: 57.470 / 58.739 USD (short-term trend filter)
WHAT WOULD CONFIRM WEAKNESS
▪️ 4H closes staying below 54.950 USD, turning it into resistance
▪️ Rallies failing near EMA 20 (57.470 USD)
WHAT WOULD INVALIDATE IT
▪️ A 4H close back above 54.950 USD (range reclaimed)
▪️ Price recovering EMA 20 (57.470 USD)
Do you expect a temporary bounce from oversold levels, or will downward momentum continue on the four-hour chart?
Not financial advice. Always DYOR.
Like & Follow for Daily Trade Analytics & Insider News. @MistralAK
#INTCB #Breakdown #TrendingTopic
1
277

·
--
$INTCB 今天-0.7%,跟大饼差不多。$BTC 今天-0.6%。
看到红K就冲的人,通常也是绿K里最先跑的人。
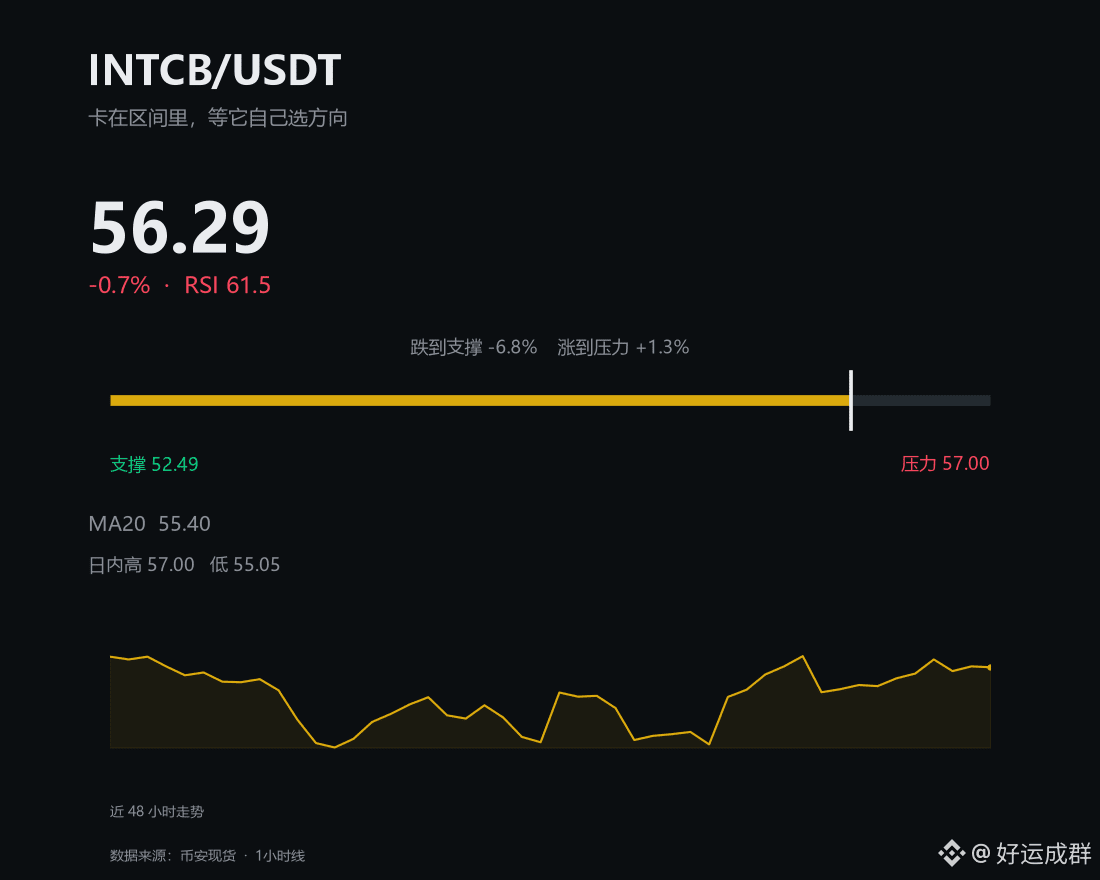
现价 56.29,压力 57,支撑 52.49,RSI 61.5。
要做就等它站住 57 再说,站不住就先看着,钱在手上不会咬人。
这个位置你动手了吗?
市场不缺机会,缺的是等机会的耐心。
#币圈 #INTCB
$INTCB 今天-0.7%,跟大饼差不多。$BTC 今天-0.6%。
看到红K就冲的人,通常也是绿K里最先跑的人。
现价 56.29,压力 57,支撑 52.49,RSI 61.5。
要做就等它站住 57 再说,站不住就先看着,钱在手上不会咬人。
这个位置你动手了吗?
市场不缺机会,缺的是等机会的耐心。
#币圈 #INTCB
看到红K就冲的人,通常也是绿K里最先跑的人。
现价 56.29,压力 57,支撑 52.49,RSI 61.5。
要做就等它站住 57 再说,站不住就先看着,钱在手上不会咬人。
这个位置你动手了吗?
市场不缺机会,缺的是等机会的耐心。
#币圈 #INTCB
39


$INTCB: Volume Whisper
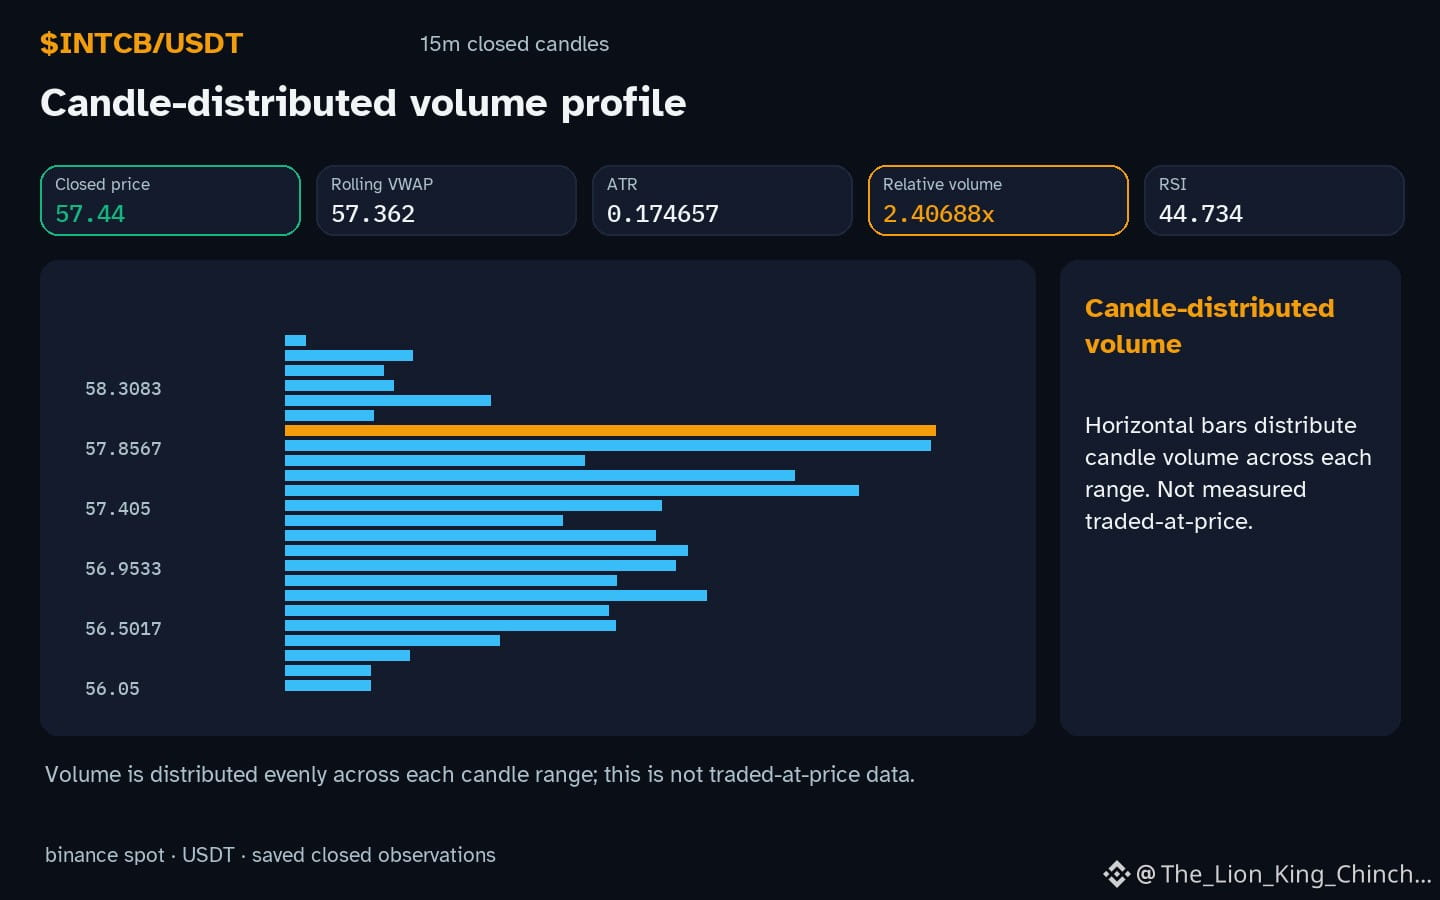
$INTCB: Does elevated volume always mean a shift in perspective? For $INTCB, the readings are 2.41x baseline.
The Question
Think of a busy highway during rain. You slow down. The car ahead is just normal traffic. We often treat ordinary increases as special events. This is apophenia. We see patterns in noise. In market terms, a volume spike above baseline might be routine variation.
Evidence and an Alternative
Supplied data shows hourly movement is down while volume is active. RSI is 44.7. This is a thought experiment. We cannot infer motive or hidden accumulation. A competitor interpretation is simple: routine dispersion. Liquidity may be thin. Different participants react to price ticks. No single buyer exists. The candle does not reveal intent. We must separate observation from narrative.
A Practical Self-Check
Ask before acting: Can baseline data explain this? Relative volume 2.41x is a ratio. It is not a proof of buying. One candle is a snapshot. Wait for the next closed bar. Price action staying above support at 57.42 without fresh confirmation is a reassessment trigger. If the pattern fades, it was noise. Trust the process over the story.
Probabilistic market research, not a recommendation or guaranteed return.
#INTCB #TradingPsychology #CryptoLearning
$INTCB : Volume Whisper
$INTCB : Does elevated volume always mean a shift in perspective? For $INTCB , the readings are 2.41x baseline.
The Question
Think of a busy highway during rain. You slow down. The car ahead is just normal traffic. We often treat ordinary increases as special events. This is apophenia. We see patterns in noise. In market terms, a volume spike above baseline might be routine variation.
Evidence and an Alternative
Supplied data shows hourly movement is down while volume is active. RSI is 44.7. This is a thought experiment. We cannot infer motive or hidden accumulation. A competitor interpretation is simple: routine dispersion. Liquidity may be thin. Different participants react to price ticks. No single buyer exists. The candle does not reveal intent. We must separate observation from narrative.
A Practical Self-Check
Ask before acting: Can baseline data explain this? Relative volume 2.41x is a ratio. It is not a proof of buying. One candle is a snapshot. Wait for the next closed bar. Price action staying above support at 57.42 without fresh confirmation is a reassessment trigger. If the pattern fades, it was noise. Trust the process over the story.
Probabilistic market research, not a recommendation or guaranteed return.
#INTCB #TradingPsychology #CryptoLearning
$INTCB : Does elevated volume always mean a shift in perspective? For $INTCB , the readings are 2.41x baseline.
The Question
Think of a busy highway during rain. You slow down. The car ahead is just normal traffic. We often treat ordinary increases as special events. This is apophenia. We see patterns in noise. In market terms, a volume spike above baseline might be routine variation.
Evidence and an Alternative
Supplied data shows hourly movement is down while volume is active. RSI is 44.7. This is a thought experiment. We cannot infer motive or hidden accumulation. A competitor interpretation is simple: routine dispersion. Liquidity may be thin. Different participants react to price ticks. No single buyer exists. The candle does not reveal intent. We must separate observation from narrative.
A Practical Self-Check
Ask before acting: Can baseline data explain this? Relative volume 2.41x is a ratio. It is not a proof of buying. One candle is a snapshot. Wait for the next closed bar. Price action staying above support at 57.42 without fresh confirmation is a reassessment trigger. If the pattern fades, it was noise. Trust the process over the story.
Probabilistic market research, not a recommendation or guaranteed return.
#INTCB #TradingPsychology #CryptoLearning
67

·
--
看到“成交量很大”时,先找单位:是币的数量,还是计价资产金额?时间范围是否相同?
先摆 $INTCB 眼前这组数据:币安现货 11/17 17:00–18:00(北京时间),这一小时下跌 1.28%,成交额 43.57 万 USDT,为前一小时的 4.1 倍。区间收盘价 53.78 USDT。
成交量可以用基础资产数量表示,成交额则按交易对的计价资产统计。同一笔交易的两种记录描述的是同一件事,但数字和单位不同。某币的成交数量增加,不意味着以计价资产计算的金额一定同比增加。不同币种之间,也不能直接拿币的枚数比较交易规模。
#INTCB #币圈唠嗑
看到“成交量很大”时,先找单位:是币的数量,还是计价资产金额?时间范围是否相同?
先摆 $INTCB 眼前这组数据:币安现货 11/17 17:00–18:00(北京时间),这一小时下跌 1.28%,成交额 43.57 万 USDT,为前一小时的 4.1 倍。区间收盘价 53.78 USDT。
成交量可以用基础资产数量表示,成交额则按交易对的计价资产统计。同一笔交易的两种记录描述的是同一件事,但数字和单位不同。某币的成交数量增加,不意味着以计价资产计算的金额一定同比增加。不同币种之间,也不能直接拿币的枚数比较交易规模。
#INTCB #币圈唠嗑
先摆 $INTCB 眼前这组数据:币安现货 11/17 17:00–18:00(北京时间),这一小时下跌 1.28%,成交额 43.57 万 USDT,为前一小时的 4.1 倍。区间收盘价 53.78 USDT。
成交量可以用基础资产数量表示,成交额则按交易对的计价资产统计。同一笔交易的两种记录描述的是同一件事,但数字和单位不同。某币的成交数量增加,不意味着以计价资产计算的金额一定同比增加。不同币种之间,也不能直接拿币的枚数比较交易规模。
#INTCB #币圈唠嗑
5
·
--
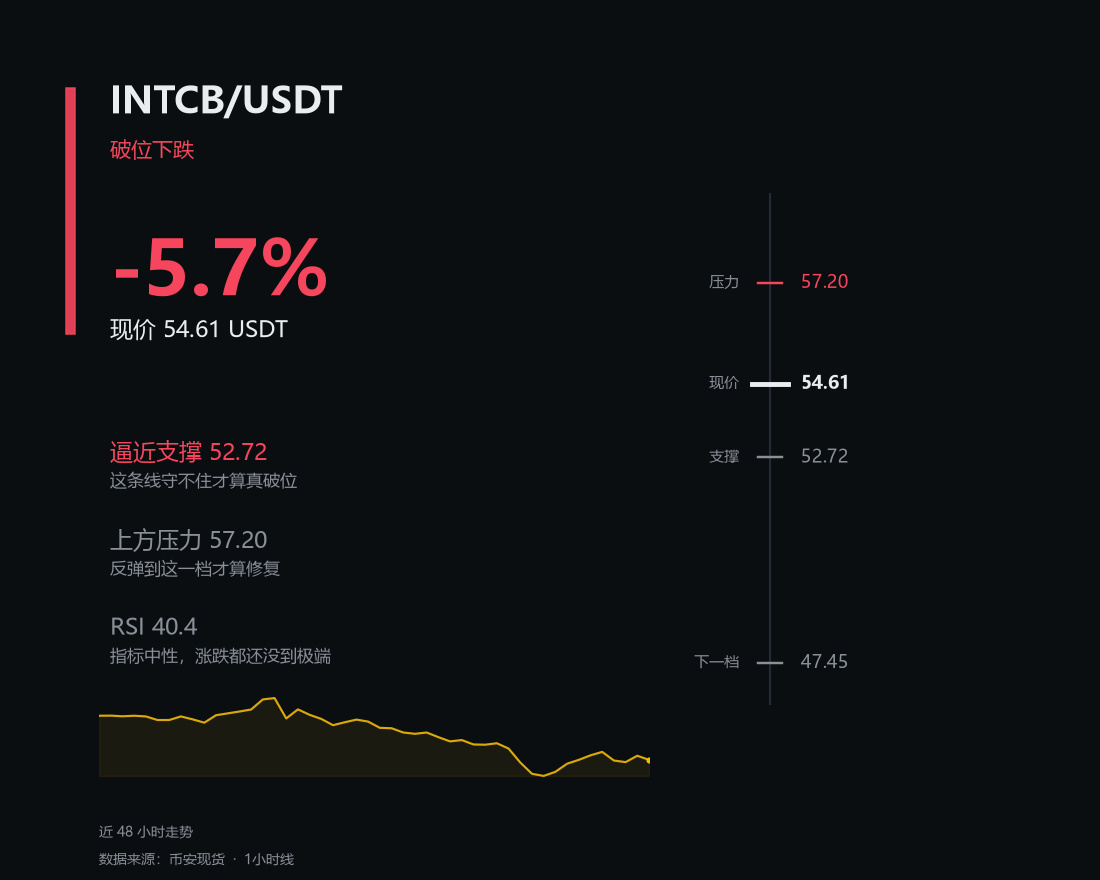
$INTCB 今天-5.7%,比大饼还软。$BTC 今天+0.3%。
看到红K就冲的人,通常也是绿K里最先跑的人。
现价 54.61,压力 57.2,支撑 52.72,RSI 40.4。
要做就等它站住 57.2 再说,站不住就先看着,钱在手上不会咬人。
你手上还有货吗?
追涨杀跌的手速,最后都变成了手续费。
#币圈 #INTCB
$INTCB 今天-5.7%,比大饼还软。$BTC 今天+0.3%。
看到红K就冲的人,通常也是绿K里最先跑的人。
现价 54.61,压力 57.2,支撑 52.72,RSI 40.4。
要做就等它站住 57.2 再说,站不住就先看着,钱在手上不会咬人。
你手上还有货吗?
追涨杀跌的手速,最后都变成了手续费。
#币圈 #INTCB
看到红K就冲的人,通常也是绿K里最先跑的人。
现价 54.61,压力 57.2,支撑 52.72,RSI 40.4。
要做就等它站住 57.2 再说,站不住就先看着,钱在手上不会咬人。
你手上还有货吗?
追涨杀跌的手速,最后都变成了手续费。
#币圈 #INTCB
31
·
--
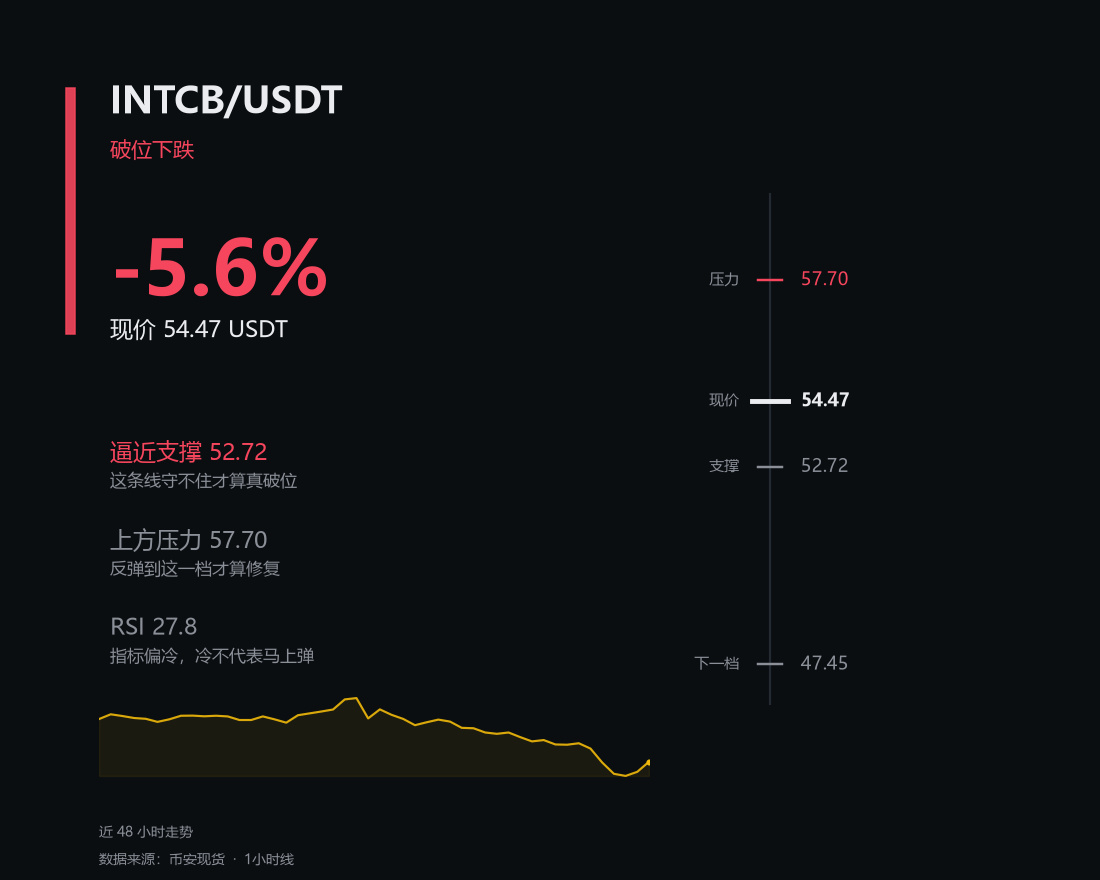
$INTCB 收在 54.47,今天-5.6%,落在 52.72 和 57.7 之间的下半区。
RSI 27.8,MA20 在 55.865,日内高低 57.2 到 52.72。
结构没坏之前,别急着给它判死刑。
$BTC 今天-0.6%。
这一波你站哪边?
市场不缺机会,缺的是等机会的耐心。
#币圈 #INTCB
$INTCB 收在 54.47,今天-5.6%,落在 52.72 和 57.7 之间的下半区。
RSI 27.8,MA20 在 55.865,日内高低 57.2 到 52.72。
结构没坏之前,别急着给它判死刑。
$BTC 今天-0.6%。
这一波你站哪边?
市场不缺机会,缺的是等机会的耐心。
#币圈 #INTCB
RSI 27.8,MA20 在 55.865,日内高低 57.2 到 52.72。
结构没坏之前,别急着给它判死刑。
$BTC 今天-0.6%。
这一波你站哪边?
市场不缺机会,缺的是等机会的耐心。
#币圈 #INTCB
33

·
--
7

·
--
Silicon Slide: $INTCB Dips on Binance Spot 📉
Price action – $INTCB is trading at $56.89, down 3.02 % over the last 24 hours on Binance Spot (INTCB/USDT) with solid volume. The slide matters as Intel heads into its Q3 earnings window while the broader semiconductor sector grapples with a modest demand slowdown.
Key levels – Immediate support sits near $55.00, a strong psychological floor. Nearest resistance caps around $58.50, with the mid‑range corridor between $56.50 and $57.00 acting as a pivot zone this week. A clean break above $58.50 could reopen upside, while a slip back through $55.00 may trigger a deeper correction toward $52.00.
Outlook – Cautious. The recent decline appears stretched; a pullback to the $55‑$56 area looks likely before any rebound. Traders should monitor volume and any earnings guidance for signs of stabilization.
#INTCB #bStocks #BinanceSpot
Silicon Slide: $INTCB Dips on Binance Spot 📉
Price action – $INTCB is trading at $56.89, down 3.02 % over the last 24 hours on Binance Spot (INTCB/USDT) with solid volume. The slide matters as Intel heads into its Q3 earnings window while the broader semiconductor sector grapples with a modest demand slowdown.
Key levels – Immediate support sits near $55.00, a strong psychological floor. Nearest resistance caps around $58.50, with the mid‑range corridor between $56.50 and $57.00 acting as a pivot zone this week. A clean break above $58.50 could reopen upside, while a slip back through $55.00 may trigger a deeper correction toward $52.00.
Outlook – Cautious. The recent decline appears stretched; a pullback to the $55‑$56 area looks likely before any rebound. Traders should monitor volume and any earnings guidance for signs of stabilization.
#INTCB #bStocks #BinanceSpot
Price action – $INTCB is trading at $56.89, down 3.02 % over the last 24 hours on Binance Spot (INTCB/USDT) with solid volume. The slide matters as Intel heads into its Q3 earnings window while the broader semiconductor sector grapples with a modest demand slowdown.
Key levels – Immediate support sits near $55.00, a strong psychological floor. Nearest resistance caps around $58.50, with the mid‑range corridor between $56.50 and $57.00 acting as a pivot zone this week. A clean break above $58.50 could reopen upside, while a slip back through $55.00 may trigger a deeper correction toward $52.00.
Outlook – Cautious. The recent decline appears stretched; a pullback to the $55‑$56 area looks likely before any rebound. Traders should monitor volume and any earnings guidance for signs of stabilization.
#INTCB #bStocks #BinanceSpot
13
·
--
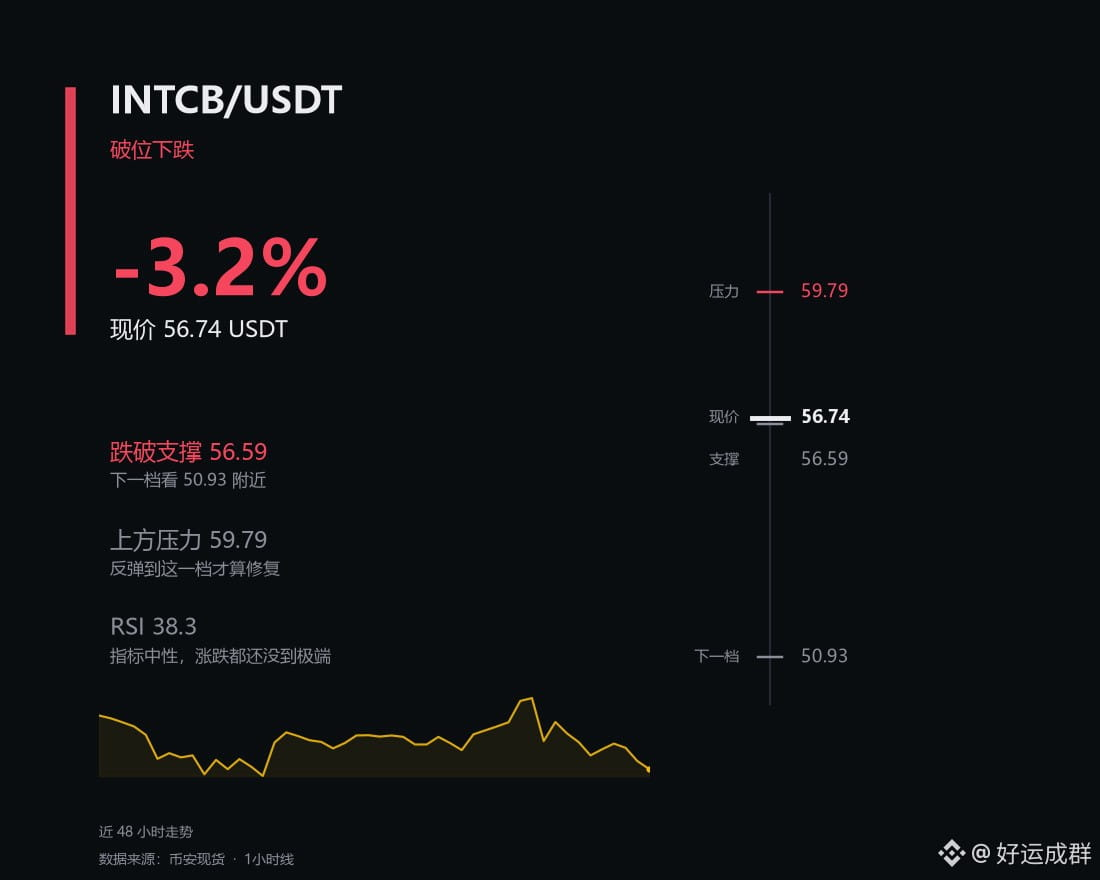
$INTCB 今天-3.2%,和大饼一起磨,现价 56.74。
换个角度想:如果你是庄,这个位置会怎么做?
往上拉到 59.79 骗一波追多的,再回头扫 56.59 下面的止损,两头都能吃。
RSI 38.3 这个数,正好够制造点情绪。
你会在这里加仓吗?
别拿一根K线当结论,它自己都还没站稳。
#币圈 #INTCB
$INTCB 今天-3.2%,和大饼一起磨,现价 56.74。
换个角度想:如果你是庄,这个位置会怎么做?
往上拉到 59.79 骗一波追多的,再回头扫 56.59 下面的止损,两头都能吃。
RSI 38.3 这个数,正好够制造点情绪。
你会在这里加仓吗?
别拿一根K线当结论,它自己都还没站稳。
#币圈 #INTCB
换个角度想:如果你是庄,这个位置会怎么做?
往上拉到 59.79 骗一波追多的,再回头扫 56.59 下面的止损,两头都能吃。
RSI 38.3 这个数,正好够制造点情绪。
你会在这里加仓吗?
别拿一根K线当结论,它自己都还没站稳。
#币圈 #INTCB
96
$INTCB: The Signal Friction Dilemma
$INTCB: Does a surge in content volume improve price discovery or simply obscure the signal? The current movement of $INTCB inside the recorded range during an hourly direction down suggests that more data is not always more clarity.
Evidence and an alternative
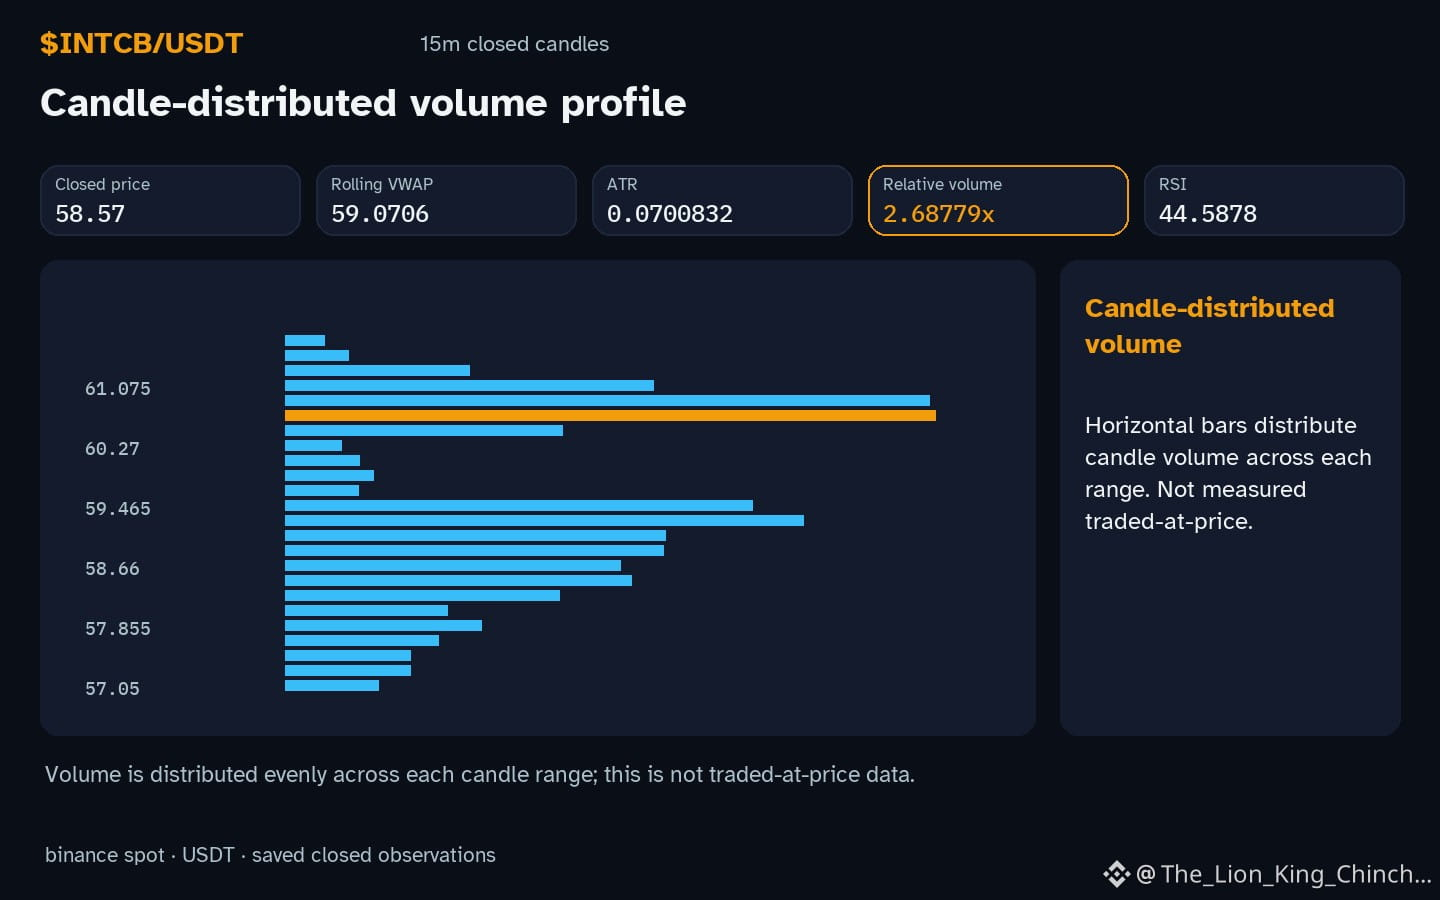
Observers see relative volume at 2.69x the baseline while the daily change is -4.23479%. In a hypothetical quality gate mechanism, a researcher might only share an update if the RSI 44.6 crosses a specific threshold or if price breaks the local resistance of 58.7. The alternative is the spam volume model, where every minor fluctuation triggers a post. This creates an incentive dilemma: does frequency provide value, or does it exploit social proof to gain attention? High volume without a range break might just be noise, regardless of how many people are discussing the asset online.
A practical self-check
To separate evidence from persuasion, ask if the analysis relies on the provided facts or on emotional adjectives. For instance, if the price remains above the local support of 58.49, the technical structure hasn't actually changed. A useful reassessment condition would be a closed candle outside the current boundaries. If the price stays within this range despite high social activity, the perceived urgency may be an artifact of the incentive structure rather than a market shift. 💡
Probabilistic market research, not a recommendation or guaranteed return.
#INTCB #CryptoCommunity #CryptoLearning
$INTCB : The Signal Friction Dilemma
$INTCB : Does a surge in content volume improve price discovery or simply obscure the signal? The current movement of $INTCB inside the recorded range during an hourly direction down suggests that more data is not always more clarity.
Evidence and an alternative
Observers see relative volume at 2.69x the baseline while the daily change is -4.23479%. In a hypothetical quality gate mechanism, a researcher might only share an update if the RSI 44.6 crosses a specific threshold or if price breaks the local resistance of 58.7. The alternative is the spam volume model, where every minor fluctuation triggers a post. This creates an incentive dilemma: does frequency provide value, or does it exploit social proof to gain attention? High volume without a range break might just be noise, regardless of how many people are discussing the asset online.
A practical self-check
To separate evidence from persuasion, ask if the analysis relies on the provided facts or on emotional adjectives. For instance, if the price remains above the local support of 58.49, the technical structure hasn't actually changed. A useful reassessment condition would be a closed candle outside the current boundaries. If the price stays within this range despite high social activity, the perceived urgency may be an artifact of the incentive structure rather than a market shift. 💡
Probabilistic market research, not a recommendation or guaranteed return.
#INTCB #CryptoCommunity #CryptoLearning
$INTCB : Does a surge in content volume improve price discovery or simply obscure the signal? The current movement of $INTCB inside the recorded range during an hourly direction down suggests that more data is not always more clarity.
Evidence and an alternative
Observers see relative volume at 2.69x the baseline while the daily change is -4.23479%. In a hypothetical quality gate mechanism, a researcher might only share an update if the RSI 44.6 crosses a specific threshold or if price breaks the local resistance of 58.7. The alternative is the spam volume model, where every minor fluctuation triggers a post. This creates an incentive dilemma: does frequency provide value, or does it exploit social proof to gain attention? High volume without a range break might just be noise, regardless of how many people are discussing the asset online.
A practical self-check
To separate evidence from persuasion, ask if the analysis relies on the provided facts or on emotional adjectives. For instance, if the price remains above the local support of 58.49, the technical structure hasn't actually changed. A useful reassessment condition would be a closed candle outside the current boundaries. If the price stays within this range despite high social activity, the perceived urgency may be an artifact of the incentive structure rather than a market shift. 💡
Probabilistic market research, not a recommendation or guaranteed return.
#INTCB #CryptoCommunity #CryptoLearning
36

·
--
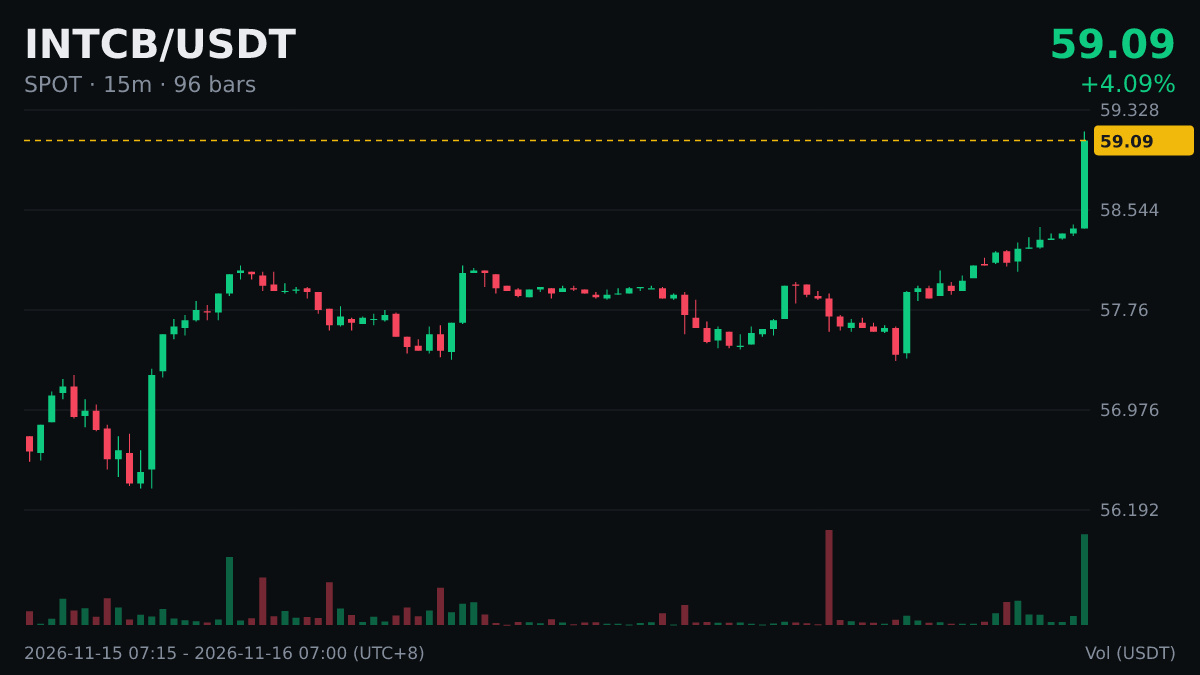
$INTCB 24小时新高,现价 59.13,前高 58.43。
新高之后常见三种走法:
① 回踩前高不破、再创新高:最强
② 在前高附近横盘:换手,看方向
③ 快速跌回前高下方并且站不回去:假突破
目前处于前高上方,先看属于①还是②。
#INTCB
$INTCB 24小时新高,现价 59.13,前高 58.43。
新高之后常见三种走法:
① 回踩前高不破、再创新高:最强
② 在前高附近横盘:换手,看方向
③ 快速跌回前高下方并且站不回去:假突破
目前处于前高上方,先看属于①还是②。
#INTCB
新高之后常见三种走法:
① 回踩前高不破、再创新高:最强
② 在前高附近横盘:换手,看方向
③ 快速跌回前高下方并且站不回去:假突破
目前处于前高上方,先看属于①还是②。
#INTCB
334

·
--
📉 $INTCB among today's top losers (-5.6%)
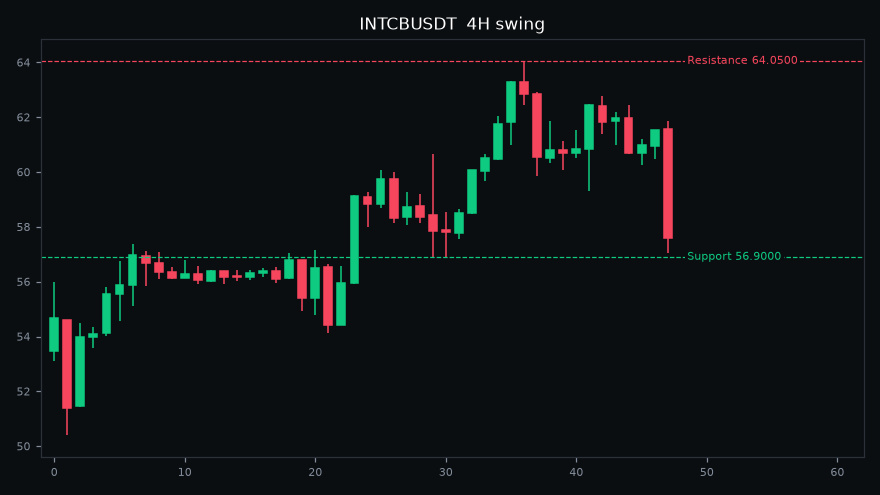
Price: 57.5400
24h High: 62.7900 | 24h Low: 57.0500
24h Volume: $8.9M
Support: 56.9000 | Resistance: 64.0500
RSI 40 (4H swing)
Volatility is high, protect your capital.
#INTCB #CryptoTrading #BinanceSquare #Binance
⚠️ Not financial advice. Do your own research.
📉 $INTCB among today's top losers (-5.6%)
Price: 57.5400
24h High: 62.7900 | 24h Low: 57.0500
24h Volume: $8.9M
Support: 56.9000 | Resistance: 64.0500
RSI 40 (4H swing)
Volatility is high, protect your capital.
#INTCB #CryptoTrading #BinanceSquare #Binance
⚠️ Not financial advice. Do your own research.
Price: 57.5400
24h High: 62.7900 | 24h Low: 57.0500
24h Volume: $8.9M
Support: 56.9000 | Resistance: 64.0500
RSI 40 (4H swing)
Volatility is high, protect your capital.
#INTCB #CryptoTrading #BinanceSquare #Binance
⚠️ Not financial advice. Do your own research.
12
$INTCB: Why Volume Climax at the Bottom Often Looks Identical to Panic Collapse
$INTCB: Why does a surge of volume at the lower end of the range sometimes feel like capitulation and other times like a continuation signal? $INTCB is currently moving down inside the recorded range while volume sits above baseline.
**Myth:** High volume automatically means traders are giving up and a bottom is confirmed. **Reality:** Volume alone cannot reveal intent. A large spike may simply reflect a rapid price move that forces many market participants to adjust orders, creating a temporary imbalance. If the price decline is modest, the same volume could be part of normal market churn rather than a panic dump.
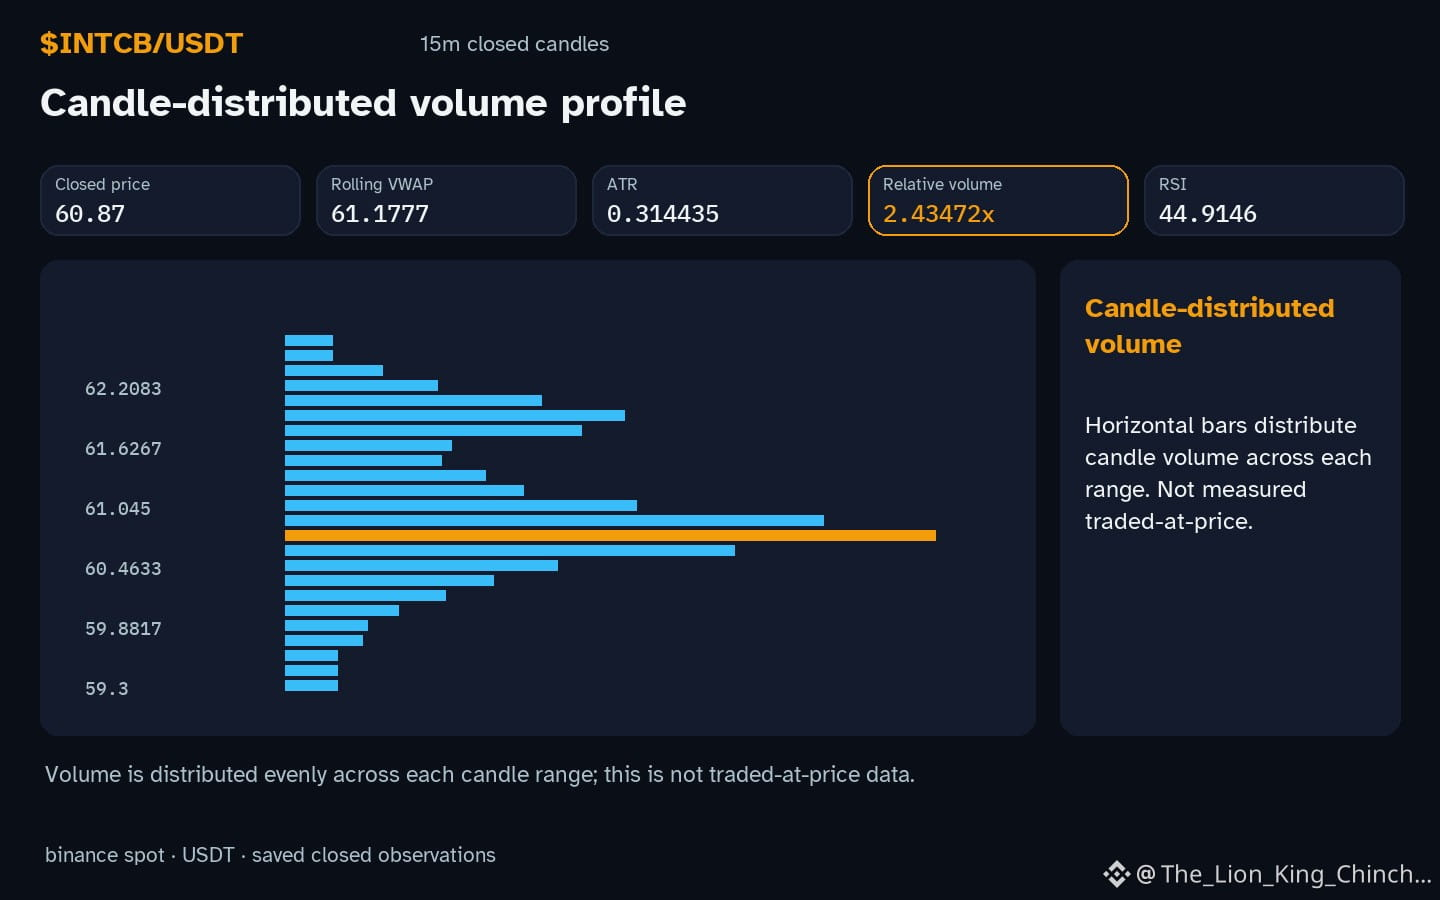
**Evidence:** The observation shows hourly direction down, price contained within local support and resistance, and relative volume 2.43x baseline. This pattern matches both a capitulation scenario. where exhausted sellers flood the market. and a continuation scenario. where aggressive buying absorbs the sell pressure and the down move pauses.
**Self‑check:** Track the next closed hourly candle. If the price rebounds sharply and RSI 44.9 rises above neutral, the volume likely represented a continuation cushion. If the price continues lower, breaks support, and volume remains elevated, the spike aligns with capitulation. Either outcome should be treated as a hypothesis, not a guarantee, and further candles are needed to validate the interpretation.
Probabilistic market research, not a recommendation or guaranteed return.
#INTCB #CryptoLearning
$INTCB : Why Volume Climax at the Bottom Often Looks Identical to Panic Collapse
$INTCB : Why does a surge of volume at the lower end of the range sometimes feel like capitulation and other times like a continuation signal? $INTCB is currently moving down inside the recorded range while volume sits above baseline.
**Myth:** High volume automatically means traders are giving up and a bottom is confirmed. **Reality:** Volume alone cannot reveal intent. A large spike may simply reflect a rapid price move that forces many market participants to adjust orders, creating a temporary imbalance. If the price decline is modest, the same volume could be part of normal market churn rather than a panic dump.
**Evidence:** The observation shows hourly direction down, price contained within local support and resistance, and relative volume 2.43x baseline. This pattern matches both a capitulation scenario. where exhausted sellers flood the market. and a continuation scenario. where aggressive buying absorbs the sell pressure and the down move pauses.
**Self‑check:** Track the next closed hourly candle. If the price rebounds sharply and RSI 44.9 rises above neutral, the volume likely represented a continuation cushion. If the price continues lower, breaks support, and volume remains elevated, the spike aligns with capitulation. Either outcome should be treated as a hypothesis, not a guarantee, and further candles are needed to validate the interpretation.
Probabilistic market research, not a recommendation or guaranteed return.
#INTCB #CryptoLearning
$INTCB : Why does a surge of volume at the lower end of the range sometimes feel like capitulation and other times like a continuation signal? $INTCB is currently moving down inside the recorded range while volume sits above baseline.
**Myth:** High volume automatically means traders are giving up and a bottom is confirmed. **Reality:** Volume alone cannot reveal intent. A large spike may simply reflect a rapid price move that forces many market participants to adjust orders, creating a temporary imbalance. If the price decline is modest, the same volume could be part of normal market churn rather than a panic dump.
**Evidence:** The observation shows hourly direction down, price contained within local support and resistance, and relative volume 2.43x baseline. This pattern matches both a capitulation scenario. where exhausted sellers flood the market. and a continuation scenario. where aggressive buying absorbs the sell pressure and the down move pauses.
**Self‑check:** Track the next closed hourly candle. If the price rebounds sharply and RSI 44.9 rises above neutral, the volume likely represented a continuation cushion. If the price continues lower, breaks support, and volume remains elevated, the spike aligns with capitulation. Either outcome should be treated as a hypothesis, not a guarantee, and further candles are needed to validate the interpretation.
Probabilistic market research, not a recommendation or guaranteed return.
#INTCB #CryptoLearning
59
·
--
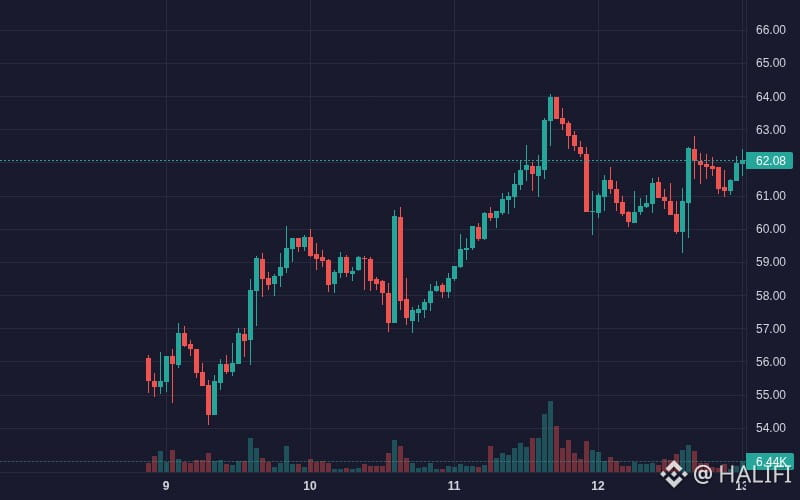
$INTCB INTCB is showing bullish movement: 1.90% (Crypto).
Volume: 9.63M | Last: $62.07
Key signals: high trader activity.
Bias Daily: BULLISH 🟢 | Weekly: BULLISH 🟢
INTCB rose 1.6% over 24h to $61.99, supported by semiconductor optimism and localized volume surges.
**Foundry & AI momentum (High)**: Optimism around domestic chip manufacturing and AI hardware positioning lifted broader sentiment
- **Surge in large buying flow (High)**: Peak net inflow of +$834.6K with +$262.2K in large orders catalyzed a sharp jump from $60.85 to $62.44
- **Bullish trend alignment (Medium)**: Price crossed above EMA 7 and EMA 25 while MACD histogram flipped positive to confirm upward momentum
#INTCB #AGT #sxt #SXT #Crypto
$INTCB INTCB is showing bullish movement: 1.90% (Crypto).
Volume: 9.63M | Last: $62.07
Key signals: high trader activity.
Bias Daily: BULLISH 🟢 | Weekly: BULLISH 🟢
INTCB rose 1.6% over 24h to $61.99, supported by semiconductor optimism and localized volume surges.
**Foundry & AI momentum (High)**: Optimism around domestic chip manufacturing and AI hardware positioning lifted broader sentiment
- **Surge in large buying flow (High)**: Peak net inflow of +$834.6K with +$262.2K in large orders catalyzed a sharp jump from $60.85 to $62.44
- **Bullish trend alignment (Medium)**: Price crossed above EMA 7 and EMA 25 while MACD histogram flipped positive to confirm upward momentum
#INTCB #AGT #sxt #SXT #Crypto
Volume: 9.63M | Last: $62.07
Key signals: high trader activity.
Bias Daily: BULLISH 🟢 | Weekly: BULLISH 🟢
INTCB rose 1.6% over 24h to $61.99, supported by semiconductor optimism and localized volume surges.
**Foundry & AI momentum (High)**: Optimism around domestic chip manufacturing and AI hardware positioning lifted broader sentiment
- **Surge in large buying flow (High)**: Peak net inflow of +$834.6K with +$262.2K in large orders catalyzed a sharp jump from $60.85 to $62.44
- **Bullish trend alignment (Medium)**: Price crossed above EMA 7 and EMA 25 while MACD histogram flipped positive to confirm upward momentum
#INTCB #AGT #sxt #SXT #Crypto
18
·
--
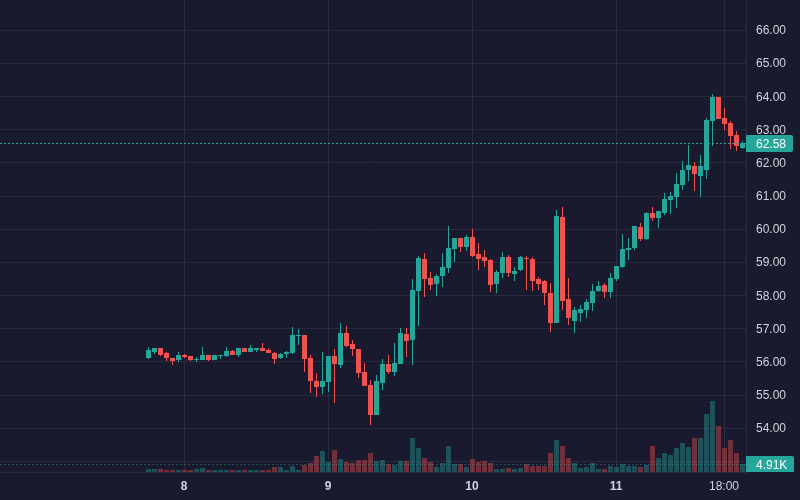
$INTCB INTCB is showing bullish movement: 7.10% (Crypto).
Volume: 20.79M | Last: $62.58
Key signals: strong momentum, high volatility, high trader activity.
Bias Daily: BULLISH 🟢 | Weekly: BULLISH 🟢
INTCB gained 7.2% in 24h, reaching $62.47 after peaking at $63.96 amid sector rotation before profit-taking emerged.
**Foundry turnaround sentiment (High)**: Optimism around U.S. domestic manufacturing and semiconductor sector rotation drove upside interest
- **Bullish momentum breakout (High)**: Price crossed above EMA-7 and Bollinger mid-band, climbing from $58.13 to peak at $63.96
- **Volume surge (Medium)**: Hourly volume spiked above $5.9M at the peak, confirming aggressive momentum buying
#INTCB #BinanceSquareFamily #HotCPIDecemberHikePriced #TRUMP #Crypto
$INTCB INTCB is showing bullish movement: 7.10% (Crypto).
Volume: 20.79M | Last: $62.58
Key signals: strong momentum, high volatility, high trader activity.
Bias Daily: BULLISH 🟢 | Weekly: BULLISH 🟢
INTCB gained 7.2% in 24h, reaching $62.47 after peaking at $63.96 amid sector rotation before profit-taking emerged.
**Foundry turnaround sentiment (High)**: Optimism around U.S. domestic manufacturing and semiconductor sector rotation drove upside interest
- **Bullish momentum breakout (High)**: Price crossed above EMA-7 and Bollinger mid-band, climbing from $58.13 to peak at $63.96
- **Volume surge (Medium)**: Hourly volume spiked above $5.9M at the peak, confirming aggressive momentum buying
#INTCB #BinanceSquareFamily #HotCPIDecemberHikePriced #TRUMP #Crypto
Volume: 20.79M | Last: $62.58
Key signals: strong momentum, high volatility, high trader activity.
Bias Daily: BULLISH 🟢 | Weekly: BULLISH 🟢
INTCB gained 7.2% in 24h, reaching $62.47 after peaking at $63.96 amid sector rotation before profit-taking emerged.
**Foundry turnaround sentiment (High)**: Optimism around U.S. domestic manufacturing and semiconductor sector rotation drove upside interest
- **Bullish momentum breakout (High)**: Price crossed above EMA-7 and Bollinger mid-band, climbing from $58.13 to peak at $63.96
- **Volume surge (Medium)**: Hourly volume spiked above $5.9M at the peak, confirming aggressive momentum buying
#INTCB #BinanceSquareFamily #HotCPIDecemberHikePriced #TRUMP #Crypto
16

·
--
$INTCB +8.47% | $AMDB +7.97% | $NXPC +7.85%
#INTCB is at $62.76, up +8.47% with $20.2M of volume. The price jump feels solid against that liquidity.
#AMDB trades around $557.70, climbing +7.97% on $3.6M of volume. A modest turnover but the upside is notable.
#NXPC sits at $0.1567, gaining +7.85% with $1.2M of volume. Small‑cap activity is keeping pace with the larger names.
🧐 Watch the spread between volume and price moves; a widening gap could signal a pullback risk.
#Write2Earn #Binance
$INTCB +8.47% | $AMDB +7.97% | $NXPC +7.85%
#INTCB is at $62.76, up +8.47% with $20.2M of volume. The price jump feels solid against that liquidity.
#AMDB trades around $557.70, climbing +7.97% on $3.6M of volume. A modest turnover but the upside is notable.
#NXPC sits at $0.1567, gaining +7.85% with $1.2M of volume. Small‑cap activity is keeping pace with the larger names.
🧐 Watch the spread between volume and price moves; a widening gap could signal a pullback risk.
#Write2Earn #Binance
#INTCB is at $62.76, up +8.47% with $20.2M of volume. The price jump feels solid against that liquidity.
#AMDB trades around $557.70, climbing +7.97% on $3.6M of volume. A modest turnover but the upside is notable.
#NXPC sits at $0.1567, gaining +7.85% with $1.2M of volume. Small‑cap activity is keeping pace with the larger names.
🧐 Watch the spread between volume and price moves; a widening gap could signal a pullback risk.
#Write2Earn #Binance
1
11
Log in to explore more content
Join global crypto users on Binance Square
⚡️ Get latest and useful information about crypto.
💬 Trusted by the world’s largest crypto exchange.
👍 Discover real insights from verified creators.
Email / Phone number
Trending Topics
1
#NvidiaBeatsEstimatesWith$130BQ4Outlook
40,110 views
247 Discussing
2
#AnthropicIPOPriceCouldExceed$80
42,962 views
215 Discussing
3
#RussiaCentralBankAddsAlfaBankToCryptoExchangeRegister
1,747 views
30 Discussing
4
#RussianCentralBankPlansToAllowFundsToHoldCryptoIn2027
1,278 views
23 Discussing
5
#VisaPlansStablecoinPrefundingForAPACCrossBorderPayments
1,873 views
23 Discussing
6
#CanNvidia’sDataCenterGrowthContinue?
112,757 views
1,245 Discussing
7
#CanadaAndUSLaunchOperationNiagaraAgainstApprovalPhishing
23,165 views
53 Discussing
8
#BankOfEnglandUnveilsClearingHousePathwayCoveringDLTFirms
3,536 views
61 Discussing
9
#DBSAndCirclePartnerToExpandAsianInstitutionsUSDCAccess
4,666 views
64 Discussing
10
#LedgerHardwareImplantReportsExtendToDubai
63,132 views
677 Discussing