
#btc
btc
9.5G views
61.9M Discussing
Hot
Latest


🟡 Bitcoin price wobbles ahead of Fed’s rate decision
Bitcoin (BTC) dipped as low as $59,500 on Binance ahead of tomorrow’s Federal Open Market Committee (FOMC) meeting. Market participants are bracing for a hawkish stance from the Federal Reserve (Fed), with expectations set for unchanged interest rates.
The CME FedWatch Tool indicates a mere 4.4% of economists predict a rate cut—the first in over a decade—while a dominant 95.6% anticipate rates to hold steady between 525-550 basis points.
According to The Kobeissi Letter, current market data indicates a 36% probability that there will be no interest rate cuts this year. Four months ago, the likelihood of maintaining current rates was only about 3%.
Expectations have also shifted to just one reduction this year. Previously, the market anticipated six rate cuts. Additionally, the probability of experiencing two or more rate cuts has diminished to 31%.
🔺 Stagflation risk
Amidst this financial climate, the US grapples with stagflation risks as inflation persists and economic growth slows.
The first quarter of 2024 saw GDP growth decelerate to 1.6%, falling short of the 2.2% forecast and down from the previous quarter’s 3.4%. Concurrently, the US Core PCE inflation index climbed from 2.0% to 3.7%.
Fed Chair Jerome Powell stated that recent data does not make the Fed more confident, suggesting a longer timeline to regain economic stability. He expressed belief in the adequacy of current policies to navigate the risks at hand, hinting at sustained high-interest rates without increases.
Bitcoin’s trajectory mirrored these economic uncertainties, dropping below $62,000 earlier in the week due to renewed stagflation worries.
A brief rally above $64,000 occurred with the launch of spot Bitcoin and Ethereum ETFs in Hong Kong yesterday, but the momentum was short-lived as investor caution set in ahead of the Fed’s key decision.
$BTC #BTC #Bitcoin
🟡 Bitcoin price wobbles ahead of Fed’s rate decision
Bitcoin (BTC) dipped as low as $59,500 on Binance ahead of tomorrow’s Federal Open Market Committee (FOMC) meeting. Market participants are bracing for a hawkish stance from the Federal Reserve (Fed), with expectations set for unchanged interest rates.
The CME FedWatch Tool indicates a mere 4.4% of economists predict a rate cut—the first in over a decade—while a dominant 95.6% anticipate rates to hold steady between 525-550 basis points.
According to The Kobeissi Letter, current market data indicates a 36% probability that there will be no interest rate cuts this year. Four months ago, the likelihood of maintaining current rates was only about 3%.
Expectations have also shifted to just one reduction this year. Previously, the market anticipated six rate cuts. Additionally, the probability of experiencing two or more rate cuts has diminished to 31%.
🔺 Stagflation risk
Amidst this financial climate, the US grapples with stagflation risks as inflation persists and economic growth slows.
The first quarter of 2024 saw GDP growth decelerate to 1.6%, falling short of the 2.2% forecast and down from the previous quarter’s 3.4%. Concurrently, the US Core PCE inflation index climbed from 2.0% to 3.7%.
Fed Chair Jerome Powell stated that recent data does not make the Fed more confident, suggesting a longer timeline to regain economic stability. He expressed belief in the adequacy of current policies to navigate the risks at hand, hinting at sustained high-interest rates without increases.
Bitcoin’s trajectory mirrored these economic uncertainties, dropping below $62,000 earlier in the week due to renewed stagflation worries.
A brief rally above $64,000 occurred with the launch of spot Bitcoin and Ethereum ETFs in Hong Kong yesterday, but the momentum was short-lived as investor caution set in ahead of the Fed’s key decision.
$BTC #BTC #Bitcoin
Bitcoin (BTC) dipped as low as $59,500 on Binance ahead of tomorrow’s Federal Open Market Committee (FOMC) meeting. Market participants are bracing for a hawkish stance from the Federal Reserve (Fed), with expectations set for unchanged interest rates.
The CME FedWatch Tool indicates a mere 4.4% of economists predict a rate cut—the first in over a decade—while a dominant 95.6% anticipate rates to hold steady between 525-550 basis points.
According to The Kobeissi Letter, current market data indicates a 36% probability that there will be no interest rate cuts this year. Four months ago, the likelihood of maintaining current rates was only about 3%.
Expectations have also shifted to just one reduction this year. Previously, the market anticipated six rate cuts. Additionally, the probability of experiencing two or more rate cuts has diminished to 31%.
🔺 Stagflation risk
Amidst this financial climate, the US grapples with stagflation risks as inflation persists and economic growth slows.
The first quarter of 2024 saw GDP growth decelerate to 1.6%, falling short of the 2.2% forecast and down from the previous quarter’s 3.4%. Concurrently, the US Core PCE inflation index climbed from 2.0% to 3.7%.
Fed Chair Jerome Powell stated that recent data does not make the Fed more confident, suggesting a longer timeline to regain economic stability. He expressed belief in the adequacy of current policies to navigate the risks at hand, hinting at sustained high-interest rates without increases.
Bitcoin’s trajectory mirrored these economic uncertainties, dropping below $62,000 earlier in the week due to renewed stagflation worries.
A brief rally above $64,000 occurred with the launch of spot Bitcoin and Ethereum ETFs in Hong Kong yesterday, but the momentum was short-lived as investor caution set in ahead of the Fed’s key decision.
$BTC #BTC #Bitcoin

138
58
401
299.9k

$BTC
{future}(BTCUSDT)
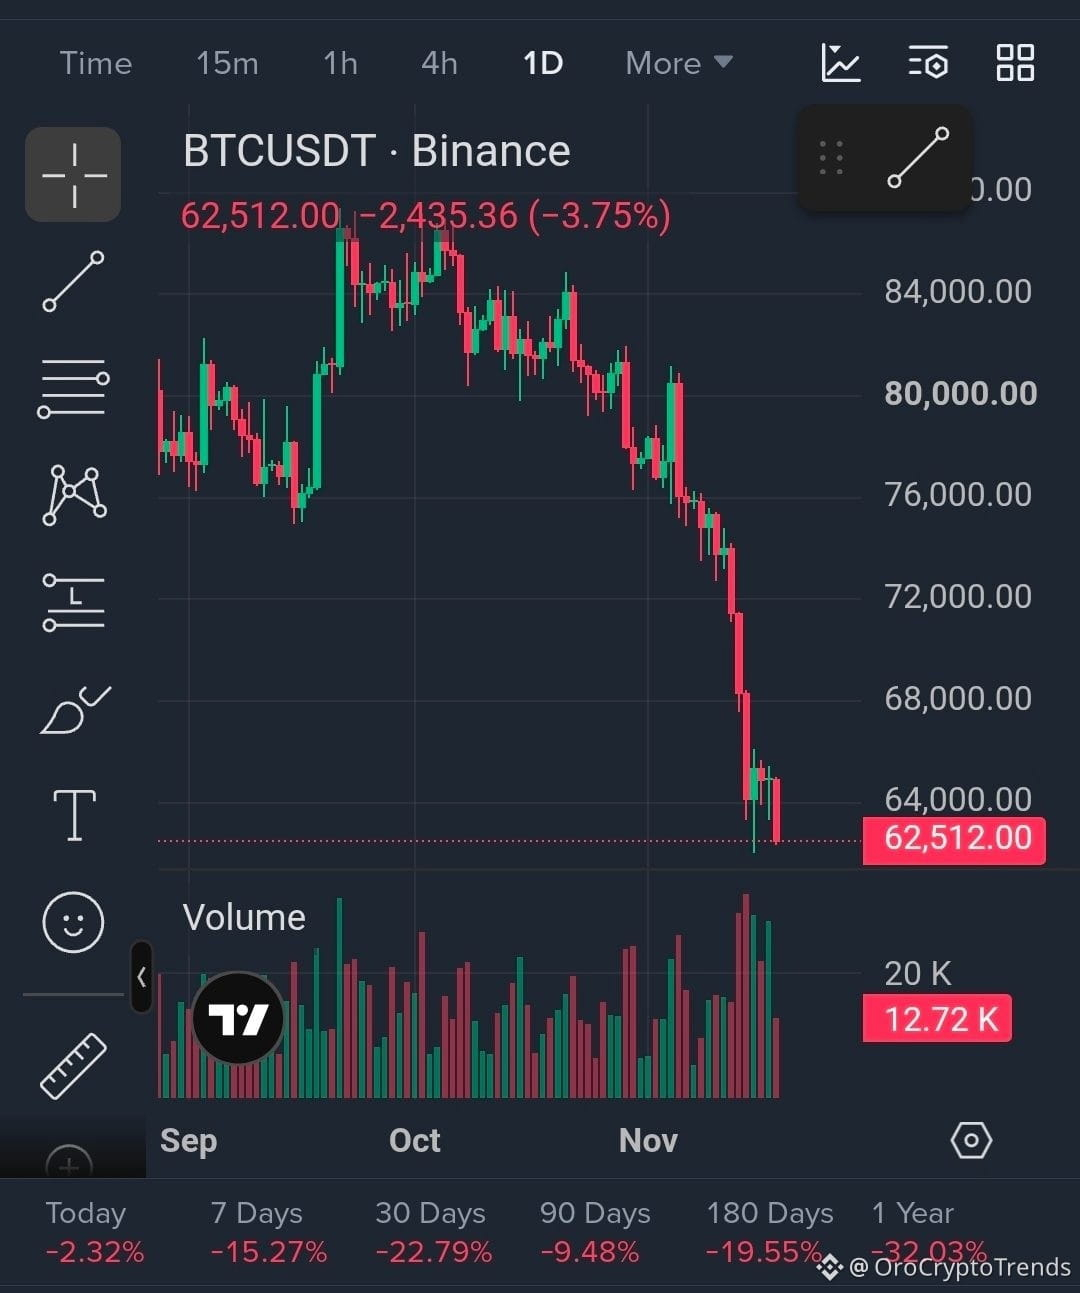
$BTC is testing a key level, and the daily close will tell us a lot. 📉
Bitcoin has dropped sharply over the past two weeks, and price is now sitting on its recent wick low. According to Binance’s BTC/USDT daily chart, BTC trades near $62,512, down about 15% over 7 days and 23% over 30 days.
What the chart shows:
🔻 Trend: The daily structure is bearish, with lower highs since the October peak and lower lows in November.
🔻 Broken support: The $74K-$76K zone held in September but failed in November. It is now resistance.
🔻 Momentum: The drop from about $76K to $64K came as a run of large red candles with very little pullback. That is momentum selling.
🔻 Failed bounce: A high-volume green candle appeared near $62K-$64K with a long lower wick, which suggests dip buying. But there was no follow-through, and price rolled over into a new red candle.
Key levels to watch:
🟥 Resistance: $64K-$65K, $68K, $74K-$76K
🟩 Support: $62K, then $60K
Two scenarios:
Bearish: A daily close below $62K would confirm continuation, with $60K as the next target.
Bullish: If $62K holds and price reclaims $64K-$65K on a daily close with rising volume, a relief bounce toward $68K becomes possible. Even then, the trend only changes if price gets back above $76K.
What I’m watching: the daily close relative to $62K (not intraday wicks) and whether any bounce comes on rising or fading volume.
No hype and no prediction, just levels and conditions. Let the chart confirm the move.
⚠️ This is a chart read, not financial advice. Always manage your risk and do your own research.
What’s your read: does $62K hold or break? 👇
#BTC #Bitcoin
$BTC
$BTC is testing a key level, and the daily close will tell us a lot. 📉
Bitcoin has dropped sharply over the past two weeks, and price is now sitting on its recent wick low. According to Binance’s BTC/USDT daily chart, BTC trades near $62,512, down about 15% over 7 days and 23% over 30 days.
What the chart shows:
🔻 Trend: The daily structure is bearish, with lower highs since the October peak and lower lows in November.
🔻 Broken support: The $74K-$76K zone held in September but failed in November. It is now resistance.
🔻 Momentum: The drop from about $76K to $64K came as a run of large red candles with very little pullback. That is momentum selling.
🔻 Failed bounce: A high-volume green candle appeared near $62K-$64K with a long lower wick, which suggests dip buying. But there was no follow-through, and price rolled over into a new red candle.
Key levels to watch:
🟥 Resistance: $64K-$65K, $68K, $74K-$76K
🟩 Support: $62K, then $60K
Two scenarios:
Bearish: A daily close below $62K would confirm continuation, with $60K as the next target.
Bullish: If $62K holds and price reclaims $64K-$65K on a daily close with rising volume, a relief bounce toward $68K becomes possible. Even then, the trend only changes if price gets back above $76K.
What I’m watching: the daily close relative to $62K (not intraday wicks) and whether any bounce comes on rising or fading volume.
No hype and no prediction, just levels and conditions. Let the chart confirm the move.
⚠️ This is a chart read, not financial advice. Always manage your risk and do your own research.
What’s your read: does $62K hold or break? 👇
#BTC #Bitcoin
$BTC is testing a key level, and the daily close will tell us a lot. 📉
Bitcoin has dropped sharply over the past two weeks, and price is now sitting on its recent wick low. According to Binance’s BTC/USDT daily chart, BTC trades near $62,512, down about 15% over 7 days and 23% over 30 days.
What the chart shows:
🔻 Trend: The daily structure is bearish, with lower highs since the October peak and lower lows in November.
🔻 Broken support: The $74K-$76K zone held in September but failed in November. It is now resistance.
🔻 Momentum: The drop from about $76K to $64K came as a run of large red candles with very little pullback. That is momentum selling.
🔻 Failed bounce: A high-volume green candle appeared near $62K-$64K with a long lower wick, which suggests dip buying. But there was no follow-through, and price rolled over into a new red candle.
Key levels to watch:
🟥 Resistance: $64K-$65K, $68K, $74K-$76K
🟩 Support: $62K, then $60K
Two scenarios:
Bearish: A daily close below $62K would confirm continuation, with $60K as the next target.
Bullish: If $62K holds and price reclaims $64K-$65K on a daily close with rising volume, a relief bounce toward $68K becomes possible. Even then, the trend only changes if price gets back above $76K.
What I’m watching: the daily close relative to $62K (not intraday wicks) and whether any bounce comes on rising or fading volume.
No hype and no prediction, just levels and conditions. Let the chart confirm the move.
⚠️ This is a chart read, not financial advice. Always manage your risk and do your own research.
What’s your read: does $62K hold or break? 👇
#BTC #Bitcoin
Kellye Setting U1tk:
58000, next?
2
2
1k

·
--
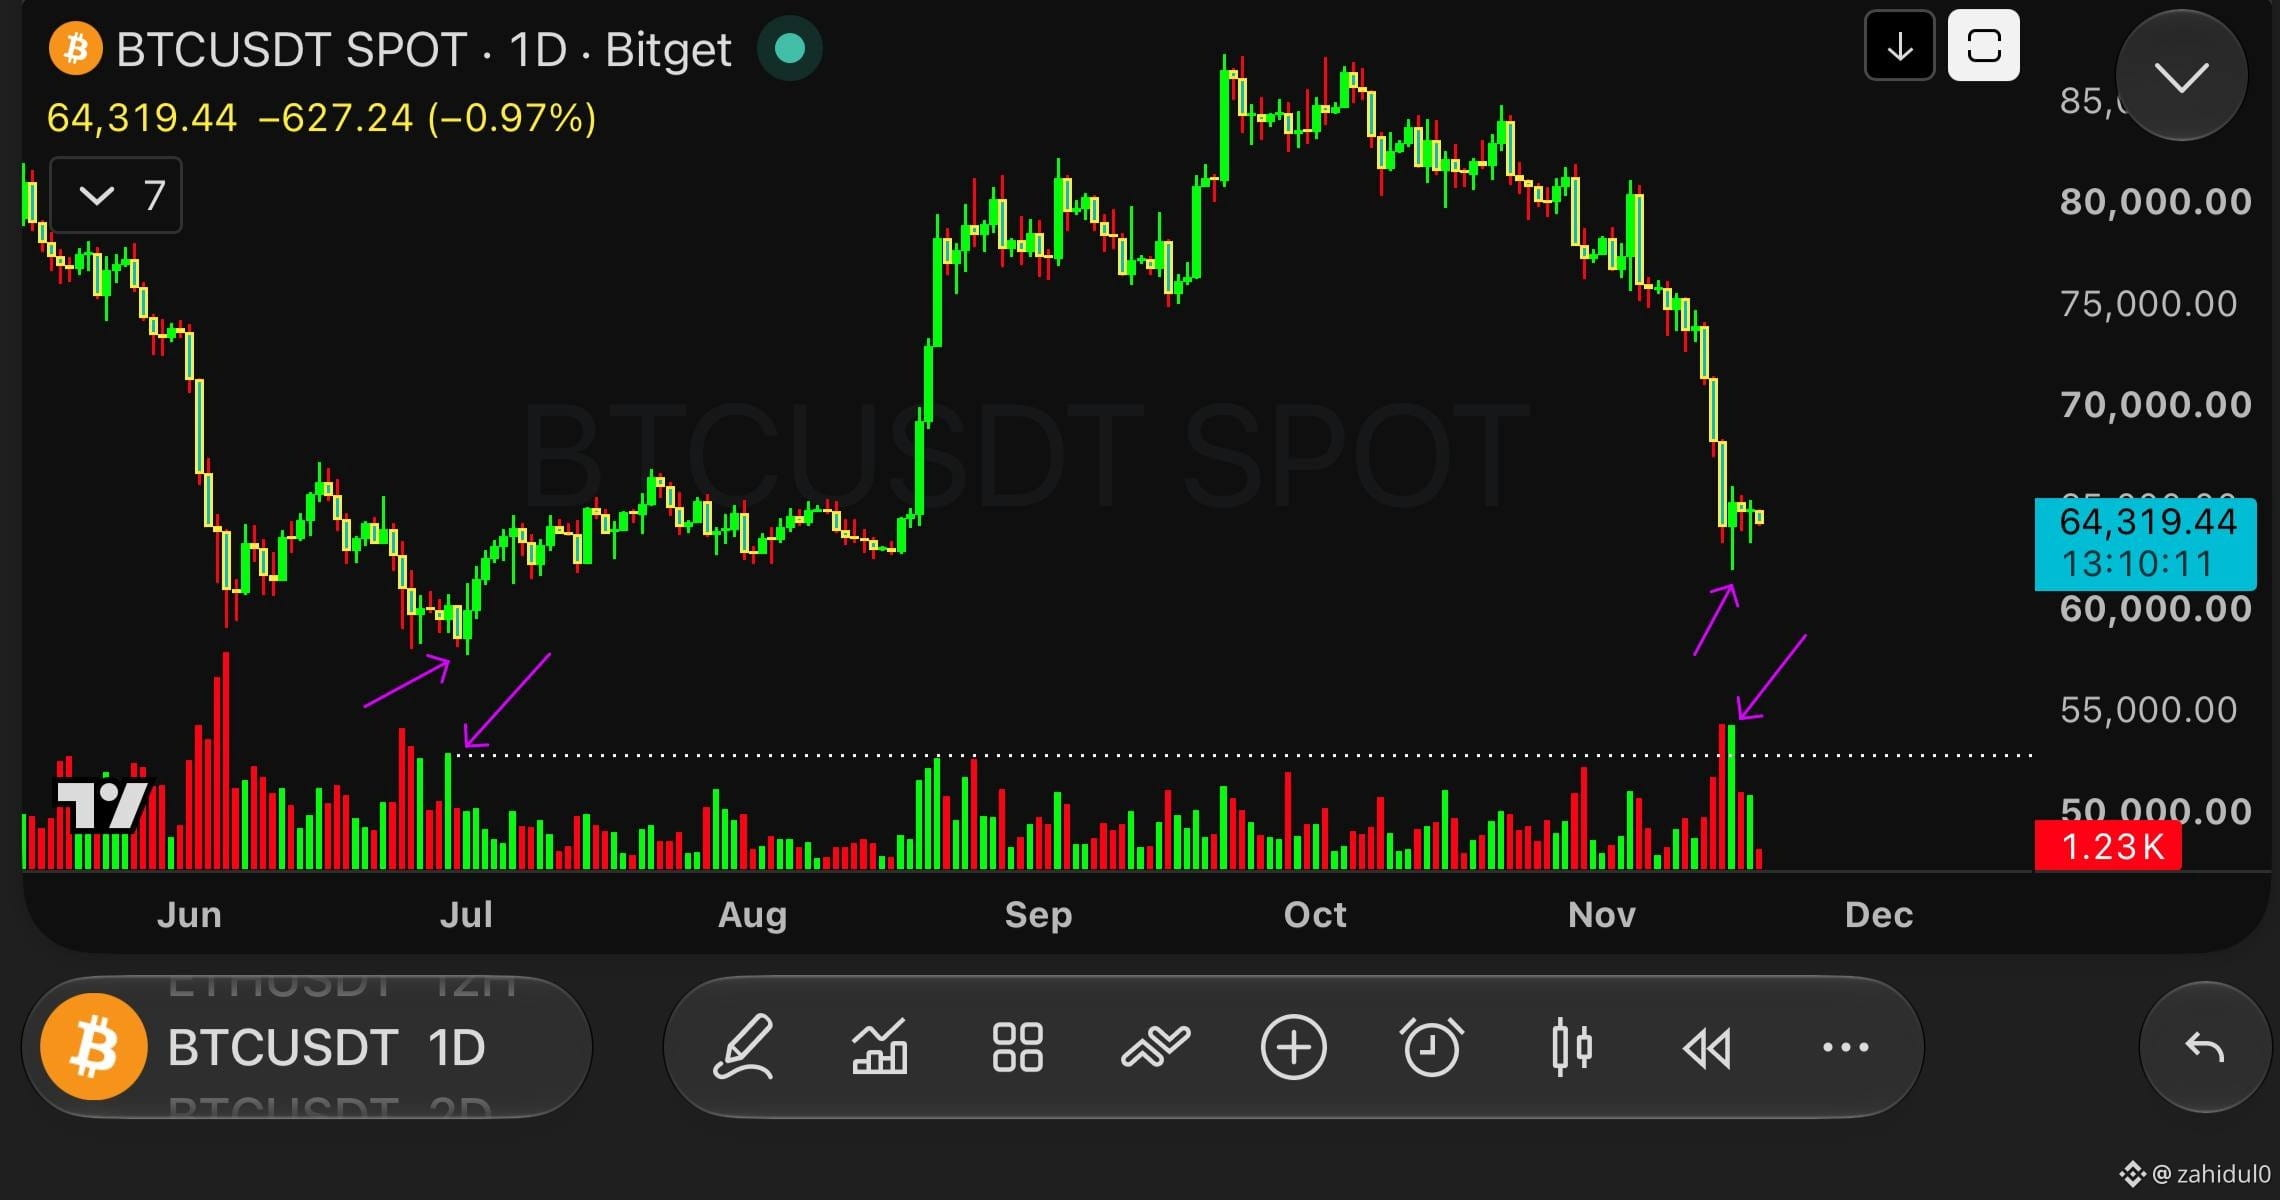
Btc buying volume at $62K has been significantly higher than what we saw at bottom back in june 2026.
They’re clearly accumulating in this range while retail is busy calling for $50K and even $40K.
Interesting how the crowd is still looking lower while buyers are stepping in…
#btc $BTC
Btc buying volume at $62K has been significantly higher than what we saw at bottom back in june 2026.
They’re clearly accumulating in this range while retail is busy calling for $50K and even $40K.
Interesting how the crowd is still looking lower while buyers are stepping in…
#btc $BTC
They’re clearly accumulating in this range while retail is busy calling for $50K and even $40K.
Interesting how the crowd is still looking lower while buyers are stepping in…
#btc $BTC
soliman soliman:
فعلا يبدو الأمر وكأنهم يريدون من مستثمري التجزئة الخروج من سوق البيتكوين
3
574

·
--
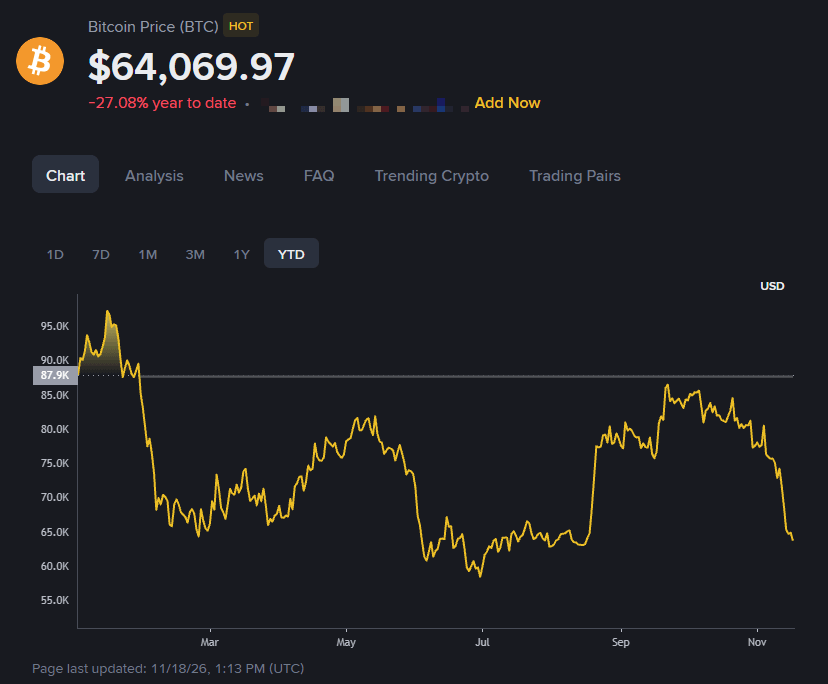
$BTC BITCOIN IS FLAT 942 DAYS AFTER THE HALVING. THIS HAS NEVER HAPPENED BEFORE!
Bitcoin closed the April 20, 2024 halving day at $64,940. Today, $BTC trades near $64.5K.
At a similar point in previous cycles:
• 2012 halving: +1,888%
• 2016 halving: +427%
• 2020 halving: +96%
• 2024 halving: ~0%
Bitcoin is also trading roughly 49% below its October 2025 all-time high of $126,199.
Here's another interesting detail:
In the previous three cycles, Bitcoin reached its bear market bottom 364–406 days after the peak.
We're now around day 407.
Is Bitcoin finally approaching a cycle bottom, or has the four-year cycle fundamentally changed? 👀
#Bitcoin #BTC
{future}(BTCUSDT)
$BTC BITCOIN IS FLAT 942 DAYS AFTER THE HALVING. THIS HAS NEVER HAPPENED BEFORE!
Bitcoin closed the April 20, 2024 halving day at $64,940. Today, $BTC trades near $64.5K.
At a similar point in previous cycles:
• 2012 halving: +1,888%
• 2016 halving: +427%
• 2020 halving: +96%
• 2024 halving: ~0%
Bitcoin is also trading roughly 49% below its October 2025 all-time high of $126,199.
Here's another interesting detail:
In the previous three cycles, Bitcoin reached its bear market bottom 364–406 days after the peak.
We're now around day 407.
Is Bitcoin finally approaching a cycle bottom, or has the four-year cycle fundamentally changed? 👀
#Bitcoin #BTC
Bitcoin closed the April 20, 2024 halving day at $64,940. Today, $BTC trades near $64.5K.
At a similar point in previous cycles:
• 2012 halving: +1,888%
• 2016 halving: +427%
• 2020 halving: +96%
• 2024 halving: ~0%
Bitcoin is also trading roughly 49% below its October 2025 all-time high of $126,199.
Here's another interesting detail:
In the previous three cycles, Bitcoin reached its bear market bottom 364–406 days after the peak.
We're now around day 407.
Is Bitcoin finally approaching a cycle bottom, or has the four-year cycle fundamentally changed? 👀
#Bitcoin #BTC
harrat:
بتوفيق
1
4
1.1k

·
--
Bullish
🚀 $BTC LONG NOWWW! 🐂
Sometimes the best opportunities come when the market creates uncertainty. But smart trading is about managing risk, not chasing every green candle.
I'm watching BTC for bullish continuation with a disciplined approach. My focus is on the target zones and protecting capital if momentum changes.
💰 Trading Plan: 🟢 Direction: LONG 💵 Fund Allocation: 2% only
🎯 TAKE PROFIT (TP):
TP1: $63,000
TP2: $63,600
TP3: $64,400
TP4: $65,500
📌 My Strategy: Secure partial profits at each target and protect your position as price moves in your favor.
⚠️ Use proper risk management. Don't let leverage turn a good setup into a bad decision.
Question: Will BTC reach $65,500, or will sellers defend the resistance first?
#BTC #Bitcoin #CryptoTrading
$BTC
{future}(BTCUSDT)
🚀 $BTC LONG NOWWW! 🐂
Sometimes the best opportunities come when the market creates uncertainty. But smart trading is about managing risk, not chasing every green candle.
I'm watching BTC for bullish continuation with a disciplined approach. My focus is on the target zones and protecting capital if momentum changes.
💰 Trading Plan: 🟢 Direction: LONG 💵 Fund Allocation: 2% only
🎯 TAKE PROFIT (TP):
TP1: $63,000
TP2: $63,600
TP3: $64,400
TP4: $65,500
📌 My Strategy: Secure partial profits at each target and protect your position as price moves in your favor.
⚠️ Use proper risk management. Don't let leverage turn a good setup into a bad decision.
Question: Will BTC reach $65,500, or will sellers defend the resistance first?
#BTC #Bitcoin #CryptoTrading
$BTC
Sometimes the best opportunities come when the market creates uncertainty. But smart trading is about managing risk, not chasing every green candle.
I'm watching BTC for bullish continuation with a disciplined approach. My focus is on the target zones and protecting capital if momentum changes.
💰 Trading Plan: 🟢 Direction: LONG 💵 Fund Allocation: 2% only
🎯 TAKE PROFIT (TP):
TP1: $63,000
TP2: $63,600
TP3: $64,400
TP4: $65,500
📌 My Strategy: Secure partial profits at each target and protect your position as price moves in your favor.
⚠️ Use proper risk management. Don't let leverage turn a good setup into a bad decision.
Question: Will BTC reach $65,500, or will sellers defend the resistance first?
#BTC #Bitcoin #CryptoTrading
$BTC

Abu Fahadأ:
💛
1
6
894

·
--
Article
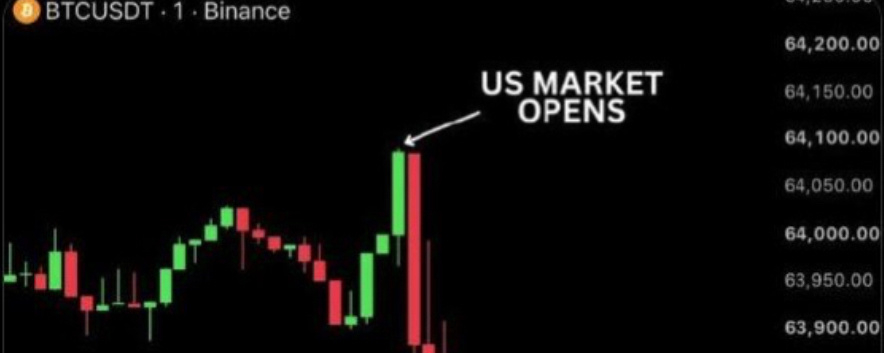
Is the Bitcoin Dump Timer Running Again?Crypto traders on X (Twitter) are once again raising suspicions about potential Bitcoin market manipulation involving Jane Street.
Jane Street is one of the world’s largest market makers and is involved in the spot Bitcoin ETF market, including BlackRock’s IBIT.
The alleged pattern:
➠ Shortly after the US stock market opens, Jane Street allegedly starts selling large amounts of BTC.
➠ Bitcoin’s price suddenly drops, triggering stop-loss orders and massive long liquidations.
➠ After the sell-off, the market maker allegedly buys BTC back at lower prices.
➠ Traders claim this pattern repeats almost every trading day.
Why is this attracting attention again?
Back in February, Jane Street was already suspected of repeatedly triggering Bitcoin sell-offs around 10:00 AM New York time.
Following the lawsuit filed by Terraform Labs against the company, these alleged sell-offs reportedly stopped.
⚠️ Important: There is currently no publicly established direct evidence proving that Jane Street manipulated Bitcoin’s price. These remain market suspicions and allegations circulating within the crypto community.
$BTC
#Bitcoin #BTC #Crypto #CryptoNews #MarketManipulation
{spot}(BTCUSDT)
Is the Bitcoin Dump Timer Running Again?
Crypto traders on X (Twitter) are once again raising suspicions about potential Bitcoin market manipulation involving Jane Street.
Jane Street is one of the world’s largest market makers and is involved in the spot Bitcoin ETF market, including BlackRock’s IBIT.
The alleged pattern:
➠ Shortly after the US stock market opens, Jane Street allegedly starts selling large amounts of BTC.
➠ Bitcoin’s price suddenly drops, triggering stop-loss orders and massive long liquidations.
➠ After the sell-off, the market maker allegedly buys BTC back at lower prices.
➠ Traders claim this pattern repeats almost every trading day.
Why is this attracting attention again?
Back in February, Jane Street was already suspected of repeatedly triggering Bitcoin sell-offs around 10:00 AM New York time.
Following the lawsuit filed by Terraform Labs against the company, these alleged sell-offs reportedly stopped.
⚠️ Important: There is currently no publicly established direct evidence proving that Jane Street manipulated Bitcoin’s price. These remain market suspicions and allegations circulating within the crypto community.
$BTC
#Bitcoin #BTC #Crypto #CryptoNews #MarketManipulation
Jane Street is one of the world’s largest market makers and is involved in the spot Bitcoin ETF market, including BlackRock’s IBIT.
The alleged pattern:
➠ Shortly after the US stock market opens, Jane Street allegedly starts selling large amounts of BTC.
➠ Bitcoin’s price suddenly drops, triggering stop-loss orders and massive long liquidations.
➠ After the sell-off, the market maker allegedly buys BTC back at lower prices.
➠ Traders claim this pattern repeats almost every trading day.
Why is this attracting attention again?
Back in February, Jane Street was already suspected of repeatedly triggering Bitcoin sell-offs around 10:00 AM New York time.
Following the lawsuit filed by Terraform Labs against the company, these alleged sell-offs reportedly stopped.
⚠️ Important: There is currently no publicly established direct evidence proving that Jane Street manipulated Bitcoin’s price. These remain market suspicions and allegations circulating within the crypto community.
$BTC
#Bitcoin #BTC #Crypto #CryptoNews #MarketManipulation
2
195

30D trade $BTC 1.6K USDT
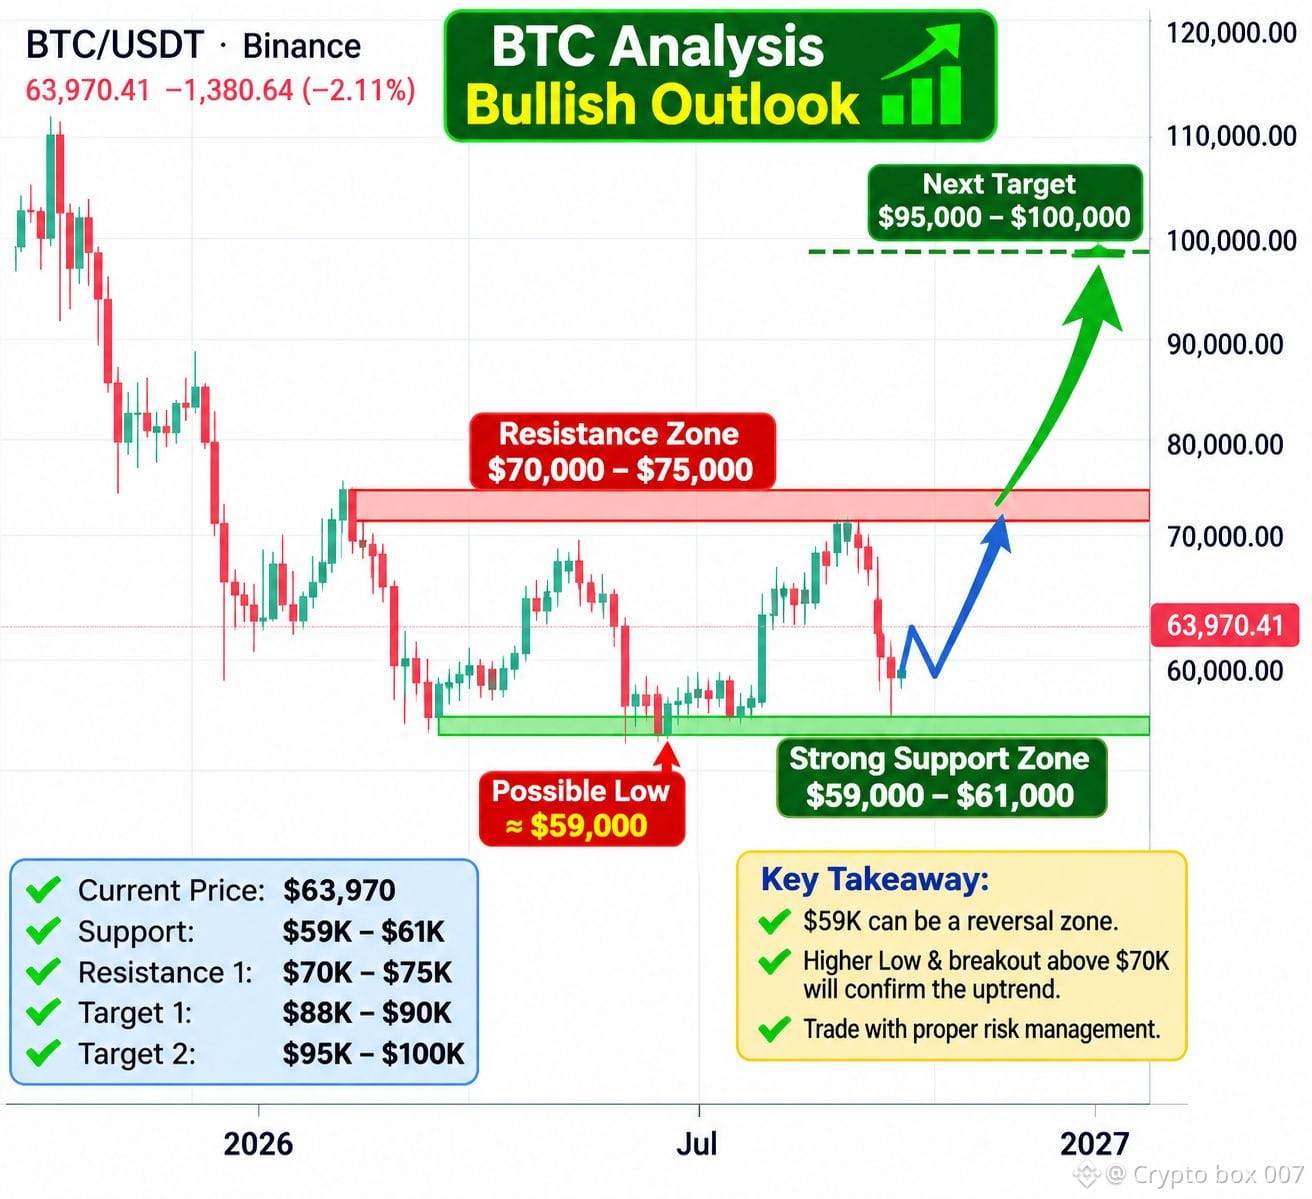
BTC/USDT Weekly Analysis: A Potential Bottom Near $59,000 Before the Next Uptrend?
Bitcoin is currently trading around $63,970, showing significant bearish pressure on the weekly timeframe.
Based on the provided Binance weekly chart, BTC remains in a broader downtrend, with lower highs and strong selling pressure.
Key Technical Levels
Current Price: $63,970
Major Support Zone: $59,000–$61,000
Potential Bottom: Around $59,000
Resistance 1: $70,000–$75,000
Upside Target 1: $88,000–$90,000
Upside Target 2: $95,000–$100,000
My Market Outlook
I believe Bitcoin could revisit the $59,000–$61,000 region before establishing a stronger recovery.
If buyers defend this support zone and BTC forms a confirmed higher low, a bullish reversal could develop.
The first major challenge would be reclaiming the $70,000–$75,000 resistance zone. A confirmed weekly breakout above this area could open the door toward $88,000–$90,000, followed by the $95,000–$100,000 region.
What Could Invalidate This Scenario?
A strong weekly close below $59,000 would weaken this bullish outlook and increase the risk of further downside.
My Strategy: Watch the $59K–$61K support zone closely. Wait for confirmation of buying pressure rather than entering blindly.
Bitcoin may be approaching an important turning point, but patience and risk management remain essential.
This is a technical market outlook, not a guaranteed price prediction or financial advice.
#BTC #BTC突破7万大关 #bitcoin $BTC
BTC/USDT Weekly Analysis: A Potential Bottom Near $59,000 Before the Next Uptrend?
Bitcoin is currently trading around $63,970, showing significant bearish pressure on the weekly timeframe.
Based on the provided Binance weekly chart, BTC remains in a broader downtrend, with lower highs and strong selling pressure.
Key Technical Levels
Current Price: $63,970
Major Support Zone: $59,000–$61,000
Potential Bottom: Around $59,000
Resistance 1: $70,000–$75,000
Upside Target 1: $88,000–$90,000
Upside Target 2: $95,000–$100,000
My Market Outlook
I believe Bitcoin could revisit the $59,000–$61,000 region before establishing a stronger recovery.
If buyers defend this support zone and BTC forms a confirmed higher low, a bullish reversal could develop.
The first major challenge would be reclaiming the $70,000–$75,000 resistance zone. A confirmed weekly breakout above this area could open the door toward $88,000–$90,000, followed by the $95,000–$100,000 region.
What Could Invalidate This Scenario?
A strong weekly close below $59,000 would weaken this bullish outlook and increase the risk of further downside.
My Strategy: Watch the $59K–$61K support zone closely. Wait for confirmation of buying pressure rather than entering blindly.
Bitcoin may be approaching an important turning point, but patience and risk management remain essential.
This is a technical market outlook, not a guaranteed price prediction or financial advice.
#BTC #BTC突破7万大关 #bitcoin $BTC
Bitcoin is currently trading around $63,970, showing significant bearish pressure on the weekly timeframe.
Based on the provided Binance weekly chart, BTC remains in a broader downtrend, with lower highs and strong selling pressure.
Key Technical Levels
Current Price: $63,970
Major Support Zone: $59,000–$61,000
Potential Bottom: Around $59,000
Resistance 1: $70,000–$75,000
Upside Target 1: $88,000–$90,000
Upside Target 2: $95,000–$100,000
My Market Outlook
I believe Bitcoin could revisit the $59,000–$61,000 region before establishing a stronger recovery.
If buyers defend this support zone and BTC forms a confirmed higher low, a bullish reversal could develop.
The first major challenge would be reclaiming the $70,000–$75,000 resistance zone. A confirmed weekly breakout above this area could open the door toward $88,000–$90,000, followed by the $95,000–$100,000 region.
What Could Invalidate This Scenario?
A strong weekly close below $59,000 would weaken this bullish outlook and increase the risk of further downside.
My Strategy: Watch the $59K–$61K support zone closely. Wait for confirmation of buying pressure rather than entering blindly.
Bitcoin may be approaching an important turning point, but patience and risk management remain essential.
This is a technical market outlook, not a guaranteed price prediction or financial advice.
#BTC #BTC突破7万大关 #bitcoin $BTC
1
315

·
--
🔴 $BTC - SHORT · score 92/100
Entry: 64572
Stop: 65614.3
Target: 62020.9 🎯
⚡ Longs are still crowded even as money drains out, so I am selling any bounce back to 64572.
🛑 A close back above 65614 and the short is wrong — I am out.
#BTC #Write2Earn
🔴 $BTC - SHORT · score 92/100
Entry: 64572
Stop: 65614.3
Target: 62020.9 🎯
⚡ Longs are still crowded even as money drains out, so I am selling any bounce back to 64572.
🛑 A close back above 65614 and the short is wrong — I am out.
#BTC #Write2Earn
Entry: 64572
Stop: 65614.3
Target: 62020.9 🎯
⚡ Longs are still crowded even as money drains out, so I am selling any bounce back to 64572.
🛑 A close back above 65614 and the short is wrong — I am out.
#BTC #Write2Earn
332

Article
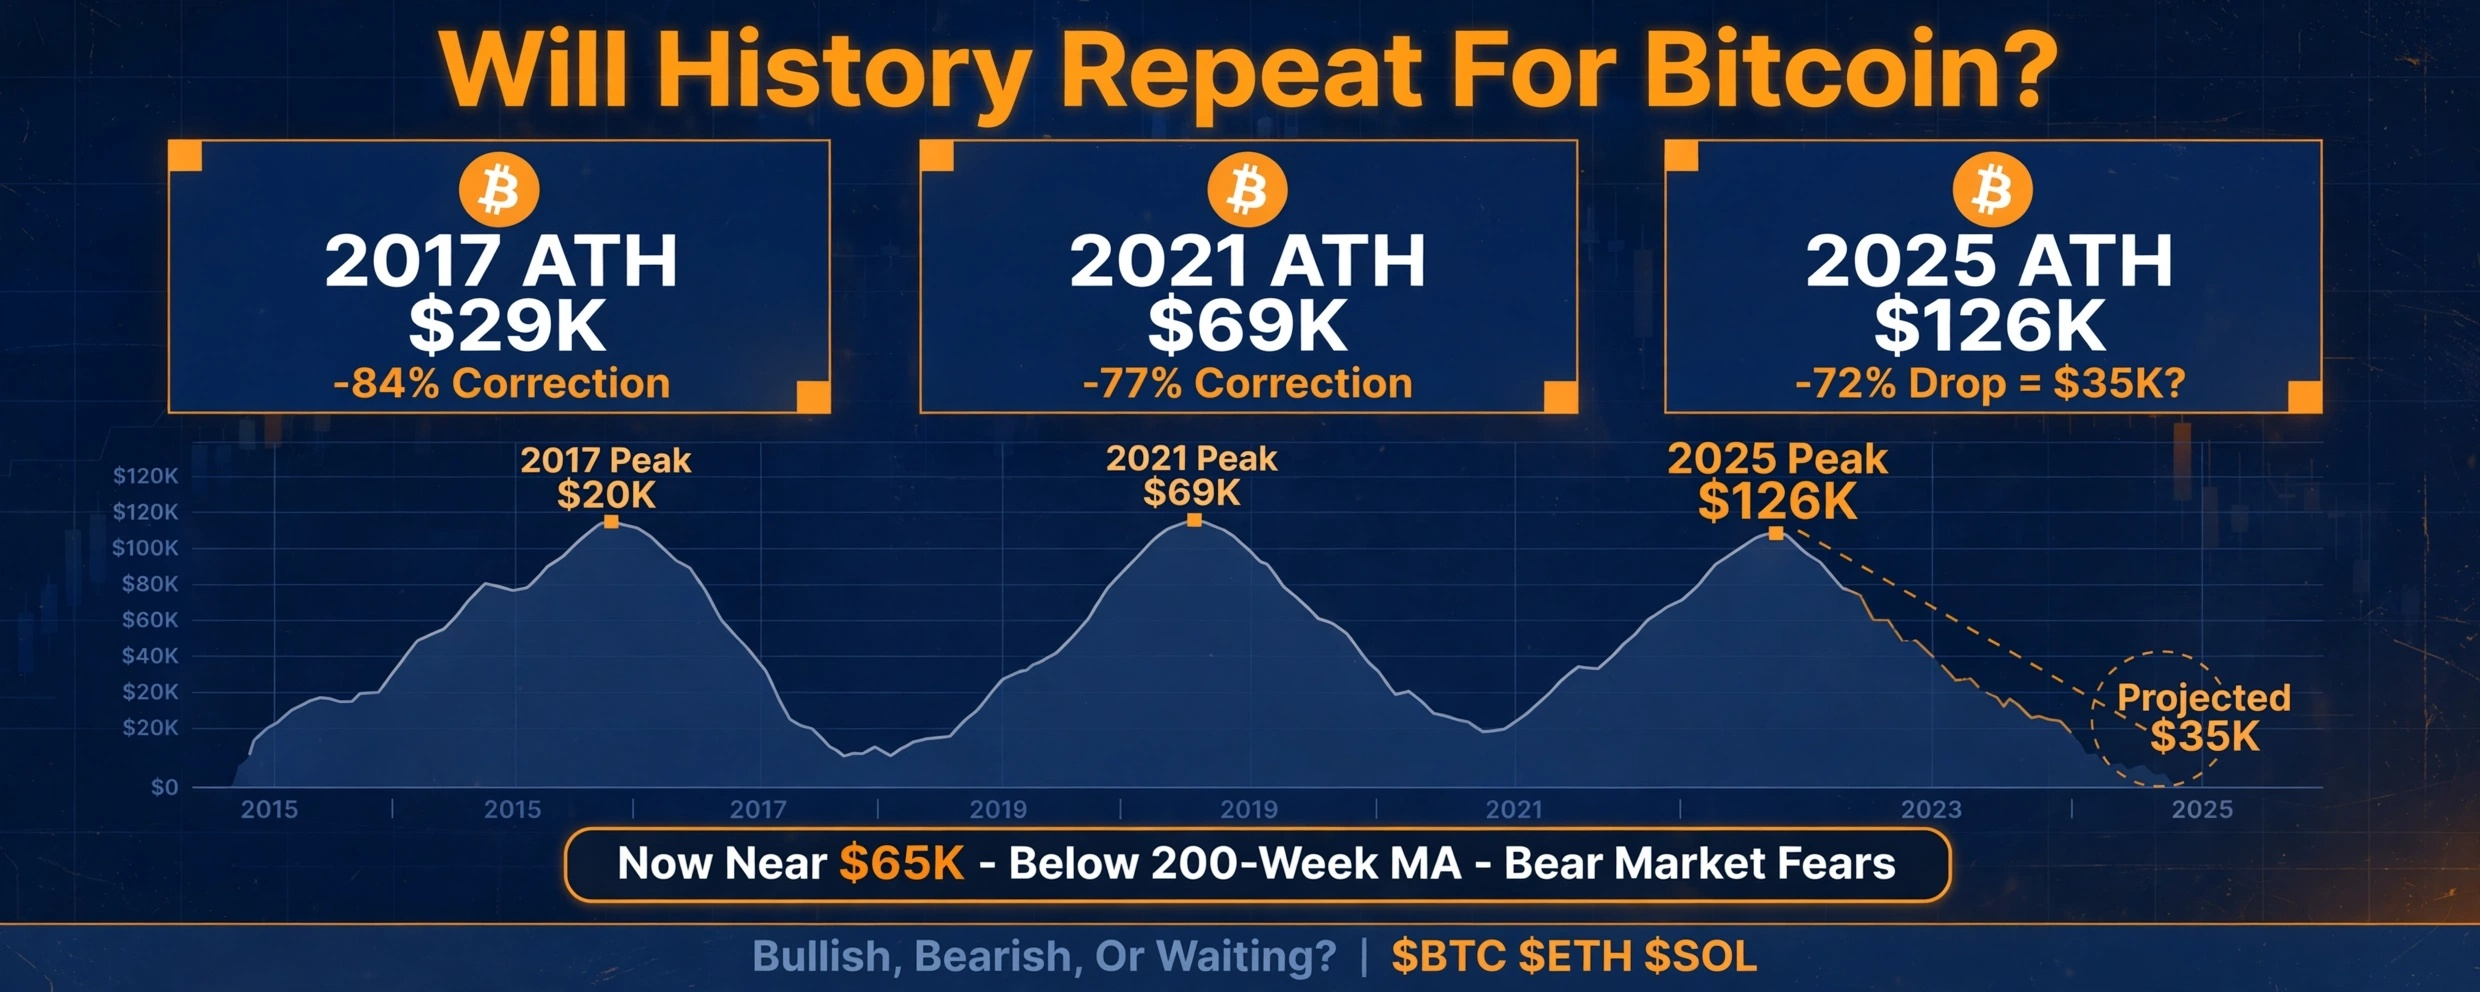
🚨 IS BITCOIN REPEATING HISTORY? BEAR MARKET AHEAD? 🚨Bitcoin’s previous cycles show a familiar pattern:
📉 2017 ATH: $20K → 84% correction
📉 2021 ATH: $69K → 77% correction
📉 2025 ATH: $126K → A similar 72% decline could bring BTC near $35K.
History suggests that every major Bitcoin bull cycle has been followed by a significant correction. But will this cycle follow the same pattern, or is the market entering a new phase?
My perspective: No panic, just patience. Market corrections are part of crypto’s volatility, and historical patterns don't guarantee future results.
What's your view? 👇
Are you Bullish, Bearish, or Waiting for the Next Move?
Bitcoin has recently traded near $65K after a sharp decline, while its break below the 200-week moving average has increased bear-market concerns.
$BTC $ETH $SOL
{spot}(BTCUSDT)
{spot}(ETHUSDT)
{spot}(SOLUSDT)
#Bitcoin #BTC #CryptoMarket #BearMarket #BullMarket
🚨 IS BITCOIN REPEATING HISTORY? BEAR MARKET AHEAD? 🚨
Bitcoin’s previous cycles show a familiar pattern:
📉 2017 ATH: $20K → 84% correction
📉 2021 ATH: $69K → 77% correction
📉 2025 ATH: $126K → A similar 72% decline could bring BTC near $35K.
History suggests that every major Bitcoin bull cycle has been followed by a significant correction. But will this cycle follow the same pattern, or is the market entering a new phase?
My perspective: No panic, just patience. Market corrections are part of crypto’s volatility, and historical patterns don't guarantee future results.
What's your view? 👇
Are you Bullish, Bearish, or Waiting for the Next Move?
Bitcoin has recently traded near $65K after a sharp decline, while its break below the 200-week moving average has increased bear-market concerns.
$BTC $ETH $SOL
#Bitcoin #BTC #CryptoMarket #BearMarket #BullMarket
📉 2017 ATH: $20K → 84% correction
📉 2021 ATH: $69K → 77% correction
📉 2025 ATH: $126K → A similar 72% decline could bring BTC near $35K.
History suggests that every major Bitcoin bull cycle has been followed by a significant correction. But will this cycle follow the same pattern, or is the market entering a new phase?
My perspective: No panic, just patience. Market corrections are part of crypto’s volatility, and historical patterns don't guarantee future results.
What's your view? 👇
Are you Bullish, Bearish, or Waiting for the Next Move?
Bitcoin has recently traded near $65K after a sharp decline, while its break below the 200-week moving average has increased bear-market concerns.
$BTC $ETH $SOL
#Bitcoin #BTC #CryptoMarket #BearMarket #BullMarket
1
304

₿ BITCOIN: 5 THINGS EVERY BEGINNER SHOULD KNOW!
Are you new to cryptocurrency? Start with these 5 important facts:
1️⃣ Bitcoin is the first major decentralized cryptocurrency.
2️⃣ Its maximum supply is 21 million BTC.
3️⃣ Bitcoin transactions are recorded on the blockchain.
4️⃣ Bitcoin's price can rise or fall significantly.
5️⃣ Always do your own research before investing.
💡 Knowledge is more valuable than hype.
Are you a Bitcoin beginner or an experienced crypto user?
#Bitcoin #BTC #Crypto #CryptoEducation
₿ BITCOIN: 5 THINGS EVERY BEGINNER SHOULD KNOW!
Are you new to cryptocurrency? Start with these 5 important facts:
1️⃣ Bitcoin is the first major decentralized cryptocurrency.
2️⃣ Its maximum supply is 21 million BTC.
3️⃣ Bitcoin transactions are recorded on the blockchain.
4️⃣ Bitcoin's price can rise or fall significantly.
5️⃣ Always do your own research before investing.
💡 Knowledge is more valuable than hype.
Are you a Bitcoin beginner or an experienced crypto user?
#Bitcoin #BTC #Crypto #CryptoEducation
Are you new to cryptocurrency? Start with these 5 important facts:
1️⃣ Bitcoin is the first major decentralized cryptocurrency.
2️⃣ Its maximum supply is 21 million BTC.
3️⃣ Bitcoin transactions are recorded on the blockchain.
4️⃣ Bitcoin's price can rise or fall significantly.
5️⃣ Always do your own research before investing.
💡 Knowledge is more valuable than hype.
Are you a Bitcoin beginner or an experienced crypto user?
#Bitcoin #BTC #Crypto #CryptoEducation

1
139

·
--
Bullish
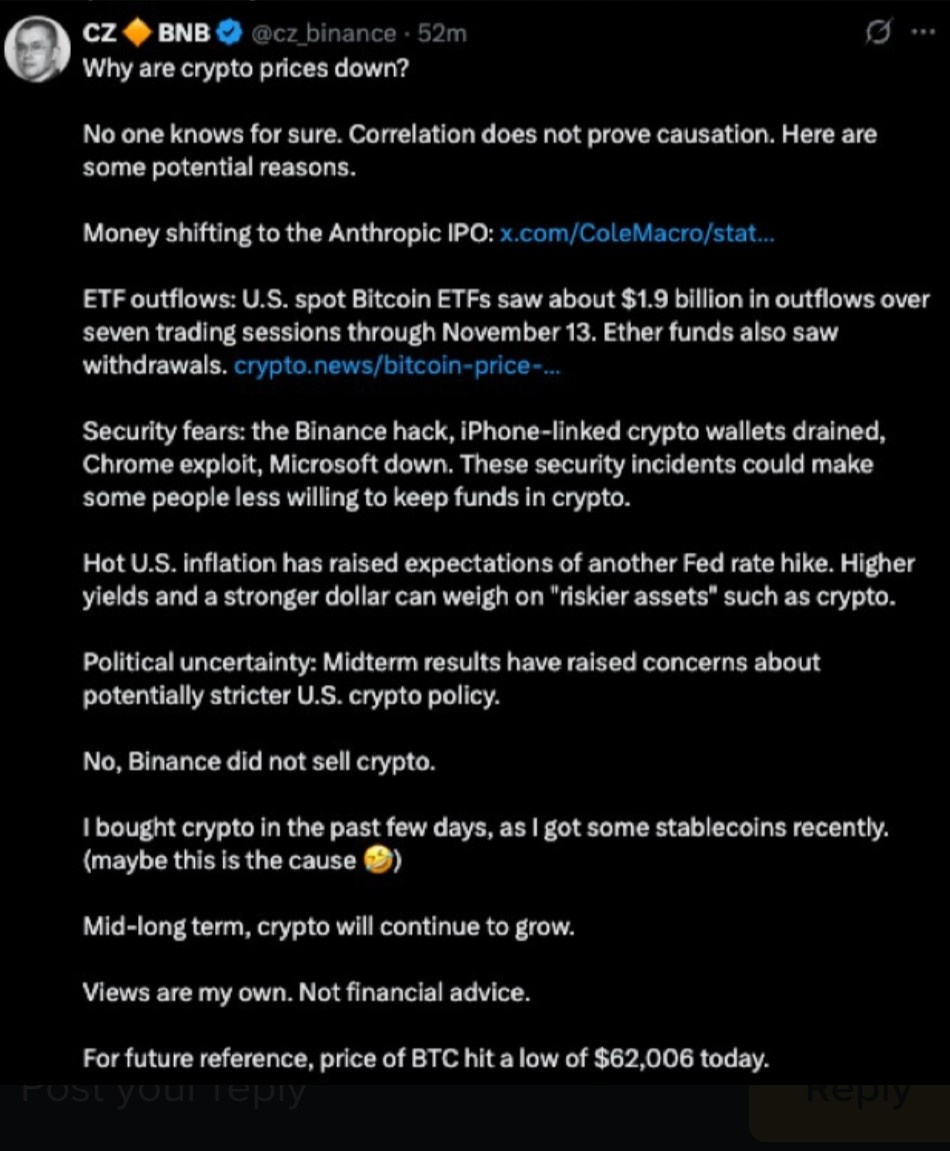
@CZ is buying this dip
what are you doing? 👀📉
While the market panics over Bitcoin dropping to $62,000, @CZ just confirmed two things:
1️⃣ Binance didn’t sell a single coin.
2️⃣ CZ is personally buying the dip. 💎🙌
He even joked that his recent buying might be why the market dipped—showing zero fear and pure long-term conviction. 📈
Smart money accumulates when fear is high. Are you stacking with CZ or sitting on the sidelines? Drop your move below! 👇
Buy $BTC and do nothing 🧘
#BTC #CZ #BuyTheDip $BTC
@CZ is buying this dip
what are you doing? 👀📉
While the market panics over Bitcoin dropping to $62,000, @CZ just confirmed two things:
1️⃣ Binance didn’t sell a single coin.
2️⃣ CZ is personally buying the dip. 💎🙌
He even joked that his recent buying might be why the market dipped—showing zero fear and pure long-term conviction. 📈
Smart money accumulates when fear is high. Are you stacking with CZ or sitting on the sidelines? Drop your move below! 👇
Buy $BTC and do nothing 🧘
#BTC #CZ #BuyTheDip $BTC
what are you doing? 👀📉
While the market panics over Bitcoin dropping to $62,000, @CZ just confirmed two things:
1️⃣ Binance didn’t sell a single coin.
2️⃣ CZ is personally buying the dip. 💎🙌
He even joked that his recent buying might be why the market dipped—showing zero fear and pure long-term conviction. 📈
Smart money accumulates when fear is high. Are you stacking with CZ or sitting on the sidelines? Drop your move below! 👇
Buy $BTC and do nothing 🧘
#BTC #CZ #BuyTheDip $BTC

136

🚨 THE BIGGEST BITCOIN WHALE ISN’T BLACKROCK, WALL STREET, OR EVEN THE U.S. GOVERNMENT… IT’S SATOSHI NAKAMOTO!
An estimated 1.1 MILLION BTC attributed to Bitcoin’s mysterious creator.
That’s more than the reported holdings of some of the biggest institutions and governments in the Bitcoin market.
Look at the numbers:
🥇 Satoshi Nakamoto — 1.1M $BTC
🥈 BlackRock — 801,403 BTC
🥉 Strategy — 640,031 $BTC
4️⃣ Fidelity — 205,888 BTC
5️⃣ U.S. Government — 198,012 $BTC
But here's the real question…
What happens if Satoshi’s Bitcoin ever moves?
Would it shake the entire crypto market, trigger massive speculation, or change nothing about Bitcoin’s long-term future?
And one more question:
Who do you think has the greatest influence over Bitcoin today: Satoshi, Wall Street, institutional investors, or governments?
I want to hear your take. 👇
Holdings shown are estimates and reported figures, not necessarily direct beneficial ownership. Institutional figures may include Bitcoin held on behalf of clients.
#CanNvidia’sDataCenterGrowthContinue? #LedgerHardwareImplantReportsExtendToDubai #Binance #BinanceSquareFamily #BTC
🚨 THE BIGGEST BITCOIN WHALE ISN’T BLACKROCK, WALL STREET, OR EVEN THE U.S. GOVERNMENT… IT’S SATOSHI NAKAMOTO!
An estimated 1.1 MILLION BTC attributed to Bitcoin’s mysterious creator.
That’s more than the reported holdings of some of the biggest institutions and governments in the Bitcoin market.
Look at the numbers:
🥇 Satoshi Nakamoto — 1.1M $BTC
🥈 BlackRock — 801,403 BTC
🥉 Strategy — 640,031 $BTC
4️⃣ Fidelity — 205,888 BTC
5️⃣ U.S. Government — 198,012 $BTC
But here's the real question…
What happens if Satoshi’s Bitcoin ever moves?
Would it shake the entire crypto market, trigger massive speculation, or change nothing about Bitcoin’s long-term future?
And one more question:
Who do you think has the greatest influence over Bitcoin today: Satoshi, Wall Street, institutional investors, or governments?
I want to hear your take. 👇
Holdings shown are estimates and reported figures, not necessarily direct beneficial ownership. Institutional figures may include Bitcoin held on behalf of clients.
#CanNvidia’sDataCenterGrowthContinue? #LedgerHardwareImplantReportsExtendToDubai #Binance #BinanceSquareFamily #BTC
An estimated 1.1 MILLION BTC attributed to Bitcoin’s mysterious creator.
That’s more than the reported holdings of some of the biggest institutions and governments in the Bitcoin market.
Look at the numbers:
🥇 Satoshi Nakamoto — 1.1M $BTC
🥈 BlackRock — 801,403 BTC
🥉 Strategy — 640,031 $BTC
4️⃣ Fidelity — 205,888 BTC
5️⃣ U.S. Government — 198,012 $BTC
But here's the real question…
What happens if Satoshi’s Bitcoin ever moves?
Would it shake the entire crypto market, trigger massive speculation, or change nothing about Bitcoin’s long-term future?
And one more question:
Who do you think has the greatest influence over Bitcoin today: Satoshi, Wall Street, institutional investors, or governments?
I want to hear your take. 👇
Holdings shown are estimates and reported figures, not necessarily direct beneficial ownership. Institutional figures may include Bitcoin held on behalf of clients.
#CanNvidia’sDataCenterGrowthContinue? #LedgerHardwareImplantReportsExtendToDubai #Binance #BinanceSquareFamily #BTC

1
372
🚨 BITCOIN HOLDERS — ARE YOU READY FOR WHAT COMES NEXT? ₿
Bitcoin is more than just a price chart. It's a market driven by supply, demand, investor sentiment, and global events.
🔥 3 things every BTC investor should watch:
1️⃣ Market volume — Is buying or selling activity increasing?
2️⃣ Key support and resistance — Where could price face pressure?
3️⃣ Market sentiment — Are investors becoming more confident or fearful?
💡 Remember: No one can predict Bitcoin's next move with certainty. Always do your own research.
👇 LET'S DISCUSS:
Are you BULLISH 📈 or BEARISH 📉 on Bitcoin right now? And WHY?
#Bitcoin #BTC #Crypto #Binance #CryptoEducation $BTC
{spot}(BTCUSDT)
🚨 BITCOIN HOLDERS — ARE YOU READY FOR WHAT COMES NEXT? ₿
Bitcoin is more than just a price chart. It's a market driven by supply, demand, investor sentiment, and global events.
🔥 3 things every BTC investor should watch:
1️⃣ Market volume — Is buying or selling activity increasing?
2️⃣ Key support and resistance — Where could price face pressure?
3️⃣ Market sentiment — Are investors becoming more confident or fearful?
💡 Remember: No one can predict Bitcoin's next move with certainty. Always do your own research.
👇 LET'S DISCUSS:
Are you BULLISH 📈 or BEARISH 📉 on Bitcoin right now? And WHY?
#Bitcoin #BTC #Crypto #Binance #CryptoEducation $BTC
Bitcoin is more than just a price chart. It's a market driven by supply, demand, investor sentiment, and global events.
🔥 3 things every BTC investor should watch:
1️⃣ Market volume — Is buying or selling activity increasing?
2️⃣ Key support and resistance — Where could price face pressure?
3️⃣ Market sentiment — Are investors becoming more confident or fearful?
💡 Remember: No one can predict Bitcoin's next move with certainty. Always do your own research.
👇 LET'S DISCUSS:
Are you BULLISH 📈 or BEARISH 📉 on Bitcoin right now? And WHY?
#Bitcoin #BTC #Crypto #Binance #CryptoEducation $BTC

1
58

·
--
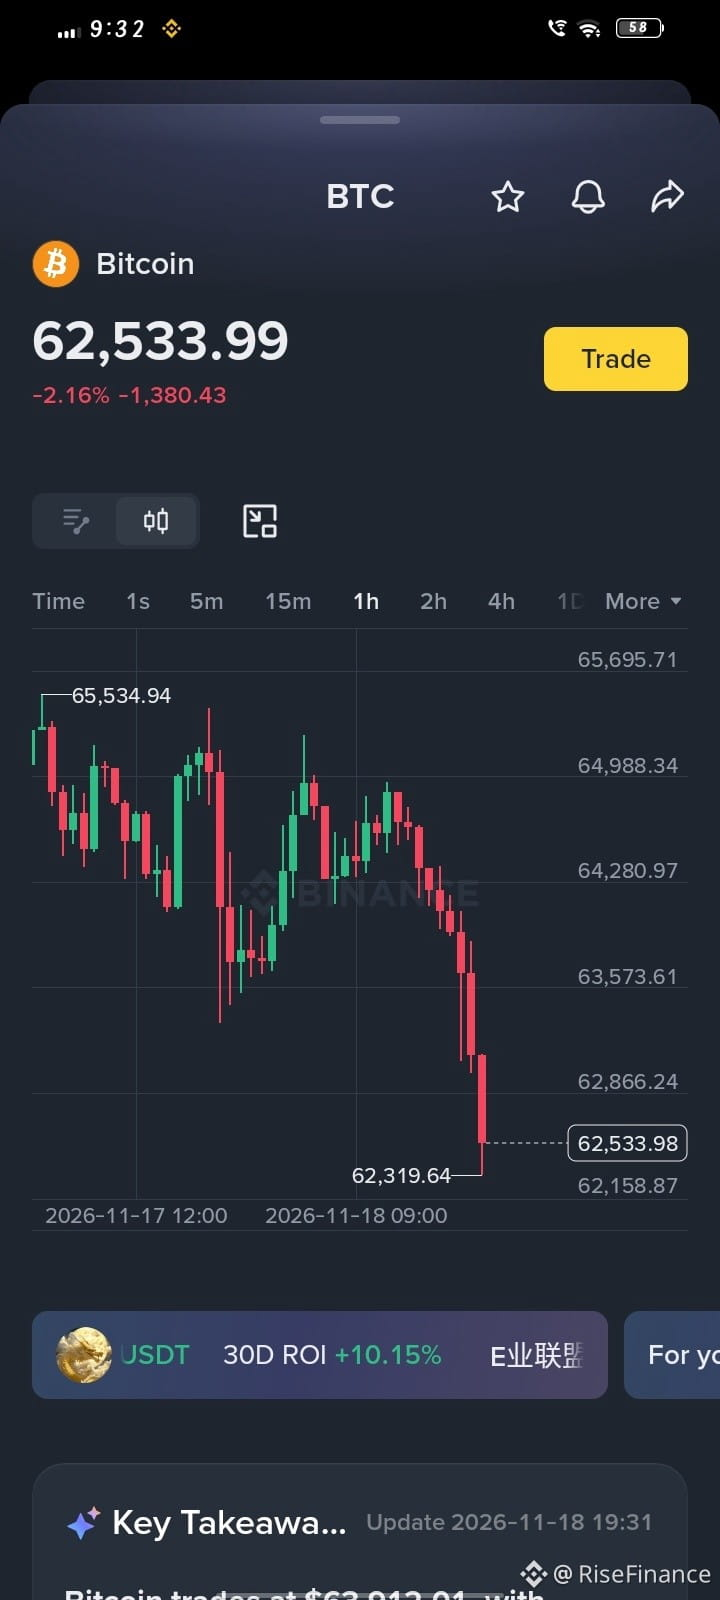
🚨 $BTC 1H Chart Check: Crucial Support Test! 📉
Bitcoin just took a sharp drop from $65,534 down to a low of $62,319, currently holding near $62,533 (-2.16%).
Right now, $62,300 is the make-or-break level on my radar:
🟢 Bounce scenario: If buyers defend this zone, we could see a quick relief push back toward $63,500+.
🔴 Breakdown risk: Losing $62,300 opens the door for further downside liquidity grabs.
Personally, I’m staying patient and waiting for a confirmed 1H green candle close before jumping into any position.
👇 What’s your game plan right now—buying this $BTC dip or waiting for lower entries? Let’s talk in the comments!
(Disclaimer: Personal chart observation only, not financial advice. Always manage your risk and DYOR.)
#BTC #Bitcoin #CryptoTrading
#CanNvidia’sDataCenterGrowthContinue? #LedgerHardwareImplantReportsExtendToDubai
{spot}(BTCUSDT)
🚨 $BTC 1H Chart Check: Crucial Support Test! 📉
Bitcoin just took a sharp drop from $65,534 down to a low of $62,319, currently holding near $62,533 (-2.16%).
Right now, $62,300 is the make-or-break level on my radar:
🟢 Bounce scenario: If buyers defend this zone, we could see a quick relief push back toward $63,500+.
🔴 Breakdown risk: Losing $62,300 opens the door for further downside liquidity grabs.
Personally, I’m staying patient and waiting for a confirmed 1H green candle close before jumping into any position.
👇 What’s your game plan right now—buying this $BTC dip or waiting for lower entries? Let’s talk in the comments!
(Disclaimer: Personal chart observation only, not financial advice. Always manage your risk and DYOR.)
#BTC #Bitcoin #CryptoTrading
#CanNvidia’sDataCenterGrowthContinue? #LedgerHardwareImplantReportsExtendToDubai
Bitcoin just took a sharp drop from $65,534 down to a low of $62,319, currently holding near $62,533 (-2.16%).
Right now, $62,300 is the make-or-break level on my radar:
🟢 Bounce scenario: If buyers defend this zone, we could see a quick relief push back toward $63,500+.
🔴 Breakdown risk: Losing $62,300 opens the door for further downside liquidity grabs.
Personally, I’m staying patient and waiting for a confirmed 1H green candle close before jumping into any position.
👇 What’s your game plan right now—buying this $BTC dip or waiting for lower entries? Let’s talk in the comments!
(Disclaimer: Personal chart observation only, not financial advice. Always manage your risk and DYOR.)
#BTC #Bitcoin #CryptoTrading
#CanNvidia’sDataCenterGrowthContinue? #LedgerHardwareImplantReportsExtendToDubai
1
62

·
--
#BTC
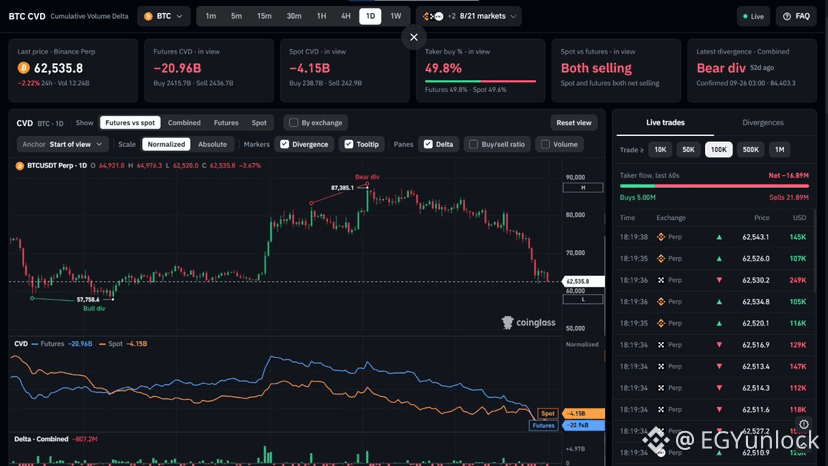
Bitcoin CVD (Cumulative Volume Delta) Liquidity Analysis
🔴 CVD Futures: -20.96B
🔴 CVD Spot: -4.15B
Bearish Divergence is present from the top
$62,000 is currently off-limits until the hold continues
A firm hold above $62,000 is preferred. An improvement in the CVD and a return of buying will pave the way for a move towards $63,000 and then $64,000.
Do not rush into entry. Wait for confirmation from the whales before entering with the trend.
#BTC
Bitcoin CVD (Cumulative Volume Delta) Liquidity Analysis
🔴 CVD Futures: -20.96B
🔴 CVD Spot: -4.15B
Bearish Divergence is present from the top
$62,000 is currently off-limits until the hold continues
A firm hold above $62,000 is preferred. An improvement in the CVD and a return of buying will pave the way for a move towards $63,000 and then $64,000.
Do not rush into entry. Wait for confirmation from the whales before entering with the trend.
Bitcoin CVD (Cumulative Volume Delta) Liquidity Analysis
🔴 CVD Futures: -20.96B
🔴 CVD Spot: -4.15B
Bearish Divergence is present from the top
$62,000 is currently off-limits until the hold continues
A firm hold above $62,000 is preferred. An improvement in the CVD and a return of buying will pave the way for a move towards $63,000 and then $64,000.
Do not rush into entry. Wait for confirmation from the whales before entering with the trend.
1
236

·
--
🔥 Is Bitcoin Preparing for Its Next Big Move?
Bitcoin is facing market pressure, but every dip brings new questions for traders.
The important things to watch:
📊 Market sentiment
📈 Trading volume
🐋 Whale activity
🔍 Key support levels
Patience and research matter more than emotional decisions.
Do you think $BTC will recover soon or see another correction?
#bitcoin #BTC #CryptoMarket #Binance #cryptotrading
🔥 Is Bitcoin Preparing for Its Next Big Move?
Bitcoin is facing market pressure, but every dip brings new questions for traders.
The important things to watch:
📊 Market sentiment
📈 Trading volume
🐋 Whale activity
🔍 Key support levels
Patience and research matter more than emotional decisions.
Do you think $BTC will recover soon or see another correction?
#bitcoin #BTC #CryptoMarket #Binance #cryptotrading
Bitcoin is facing market pressure, but every dip brings new questions for traders.
The important things to watch:
📊 Market sentiment
📈 Trading volume
🐋 Whale activity
🔍 Key support levels
Patience and research matter more than emotional decisions.
Do you think $BTC will recover soon or see another correction?
#bitcoin #BTC #CryptoMarket #Binance #cryptotrading
87

·
--
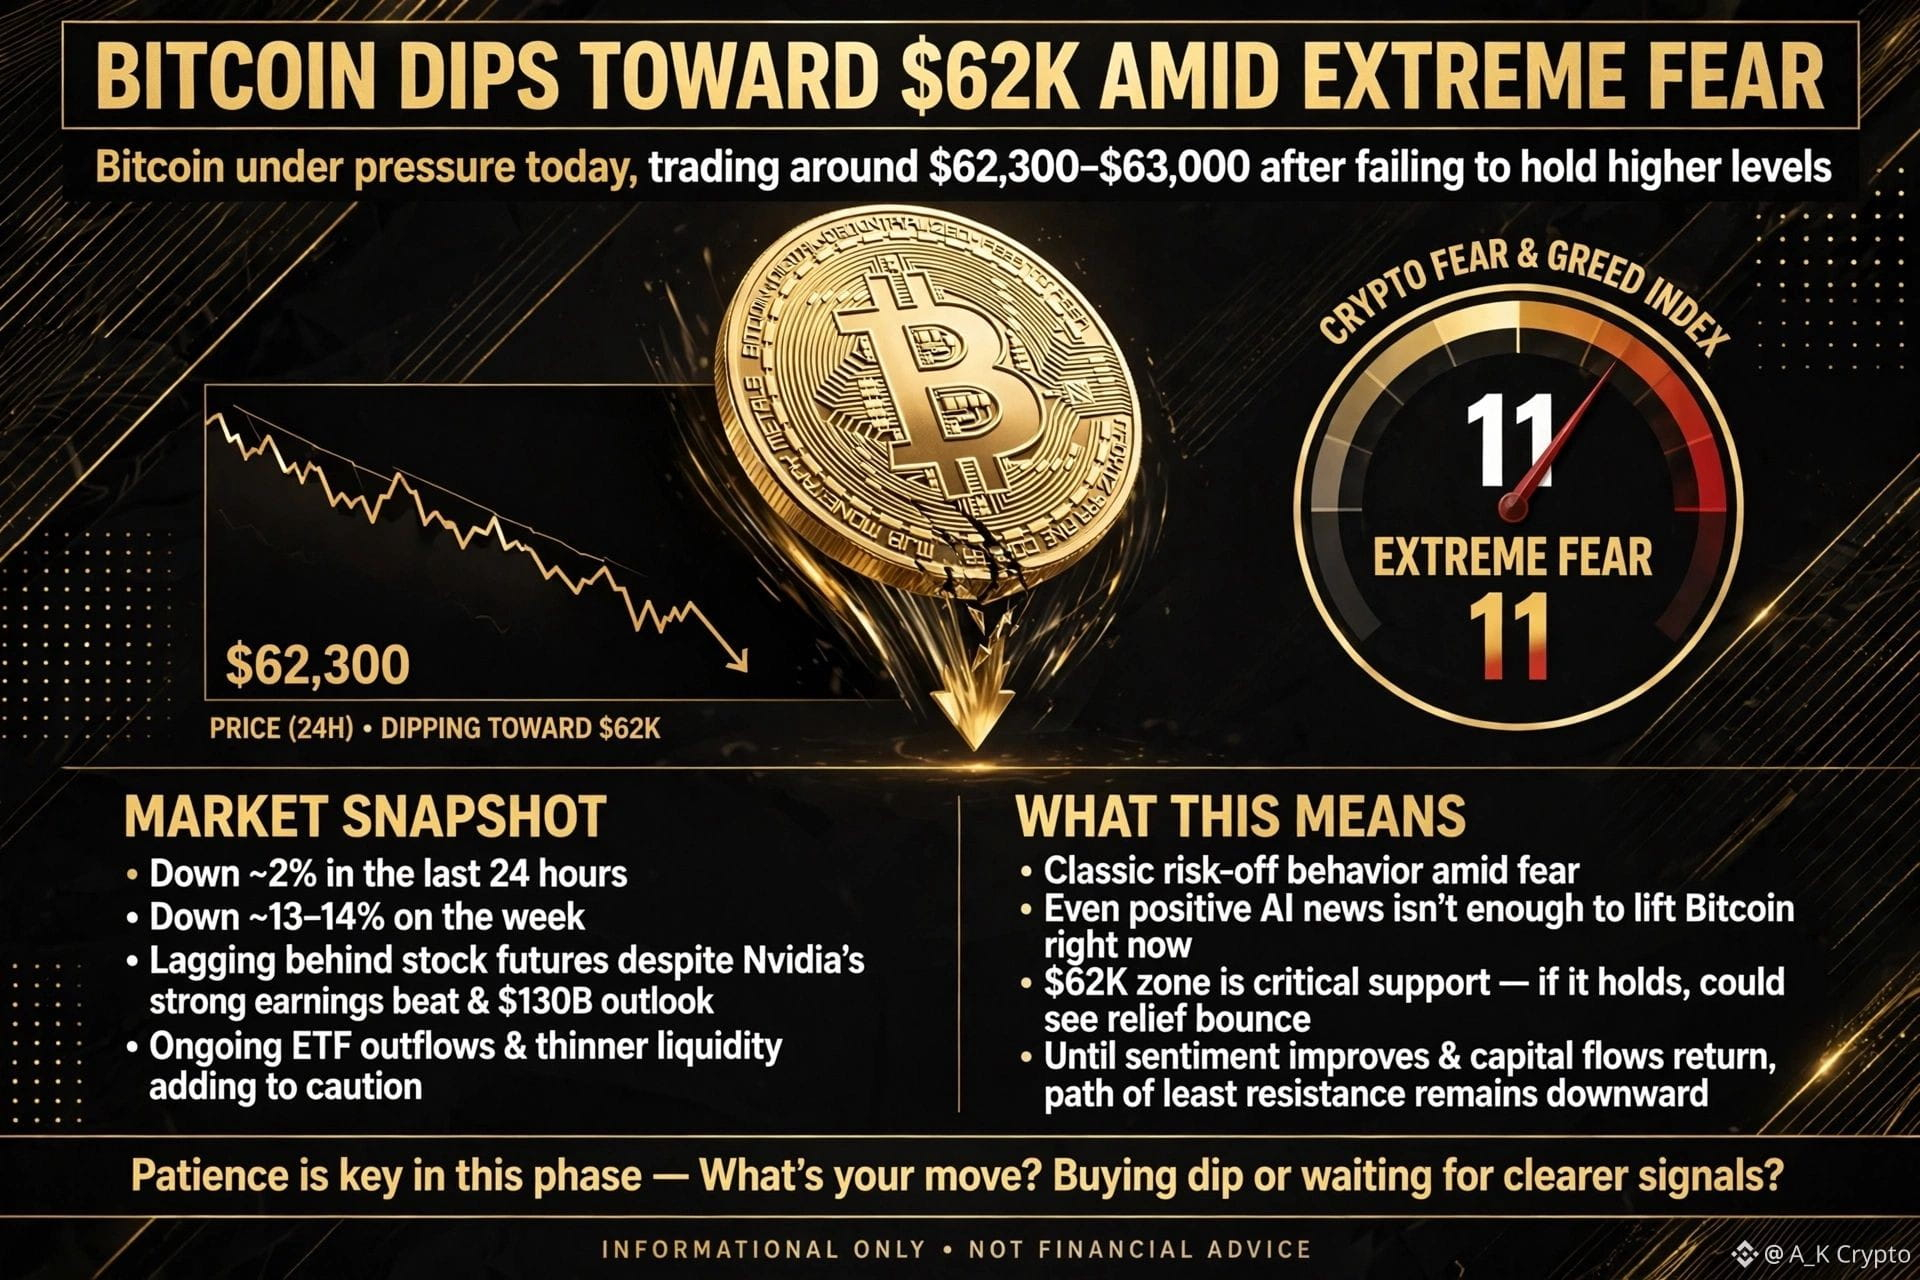
📉 $BTC Dips Toward $62K Amid Extreme Fear
$BTC is under pressure today, trading around**$62,300–$63,000** after failing to hold higher levels.
The world’s largest crypto is down roughly 2% in the last 24 hours and about 13–14% on the week. Despite Nvidia’s strong earnings beat and $130B outlook, BTC lagged behind stock futures. The Crypto Fear & Greed Index sits deep in Extreme Fear at 11, with ongoing ETF outflows and thinner liquidity adding to the caution.
This looks like classic risk-off behavior. Even positive AI news isn’t enough to lift Bitcoin right now. The $62K zone is critical support — if it holds, we could see a relief bounce. But until sentiment improves and capital flows return, the path of least resistance remains downward. Patience is key in this phase.
$BTC
What’s your move — buying the dip or waiting for clearer signals?
#Bitcoin #BTC #CryptoMarket #Crypto #Trading
{spot}(BTCUSDT)
📉 $BTC Dips Toward $62K Amid Extreme Fear
$BTC is under pressure today, trading around**$62,300–$63,000** after failing to hold higher levels.
The world’s largest crypto is down roughly 2% in the last 24 hours and about 13–14% on the week. Despite Nvidia’s strong earnings beat and $130B outlook, BTC lagged behind stock futures. The Crypto Fear & Greed Index sits deep in Extreme Fear at 11, with ongoing ETF outflows and thinner liquidity adding to the caution.
This looks like classic risk-off behavior. Even positive AI news isn’t enough to lift Bitcoin right now. The $62K zone is critical support — if it holds, we could see a relief bounce. But until sentiment improves and capital flows return, the path of least resistance remains downward. Patience is key in this phase.
$BTC
What’s your move — buying the dip or waiting for clearer signals?
#Bitcoin #BTC #CryptoMarket #Crypto #Trading
$BTC is under pressure today, trading around**$62,300–$63,000** after failing to hold higher levels.
The world’s largest crypto is down roughly 2% in the last 24 hours and about 13–14% on the week. Despite Nvidia’s strong earnings beat and $130B outlook, BTC lagged behind stock futures. The Crypto Fear & Greed Index sits deep in Extreme Fear at 11, with ongoing ETF outflows and thinner liquidity adding to the caution.
This looks like classic risk-off behavior. Even positive AI news isn’t enough to lift Bitcoin right now. The $62K zone is critical support — if it holds, we could see a relief bounce. But until sentiment improves and capital flows return, the path of least resistance remains downward. Patience is key in this phase.
$BTC
What’s your move — buying the dip or waiting for clearer signals?
#Bitcoin #BTC #CryptoMarket #Crypto #Trading
80

·
--
🔽Pushed down to the $62,500 level.
Buy-backs have weakened sharply.
🔍Keep in mind that if the $62,000 mark is broken and the price closes below it on the daily candle, it will confirm a continuation of the asset's correction down to its next support level, and this time without a local bounce.
#BTC
🔽Pushed down to the $62,500 level.
Buy-backs have weakened sharply.
🔍Keep in mind that if the $62,000 mark is broken and the price closes below it on the daily candle, it will confirm a continuation of the asset's correction down to its next support level, and this time without a local bounce.
#BTC
Buy-backs have weakened sharply.
🔍Keep in mind that if the $62,000 mark is broken and the price closes below it on the daily candle, it will confirm a continuation of the asset's correction down to its next support level, and this time without a local bounce.
#BTC
3
185
·
--
Proof of concept playing out in real time.
$BTC dropped -4.1%, yet our book is up +$32.37 (+1.9%).
Our short legs did exactly what they were engineered to do: provide immediate downside yield while retail gets flushed out of high-leverage perps.
Active hedges leading the book: • Short $ENA: +$32.30 (+33.8%) | • Short $FIL: +$30.94 (+29.3%)
This is how institutional desks trade crypto—hedging out market risk to let protocol outperformance compound.
Real-time position allocations & risk parameters on Binance Copy Trading:
https://www.binance.com/en/copy-trading/lead-details/4483279284065330433?timeRange=30D
#BTC #BinanceSquare #CopyTrading
Proof of concept playing out in real time.
$BTC dropped -4.1%, yet our book is up +$32.37 (+1.9%).
Our short legs did exactly what they were engineered to do: provide immediate downside yield while retail gets flushed out of high-leverage perps.
Active hedges leading the book: • Short $ENA : +$32.30 (+33.8%) | • Short $FIL : +$30.94 (+29.3%)
This is how institutional desks trade crypto—hedging out market risk to let protocol outperformance compound.
Real-time position allocations & risk parameters on Binance Copy Trading:
https://www.binance.com/en/copy-trading/lead-details/4483279284065330433?timeRange=30D
#BTC #BinanceSquare #CopyTrading
$BTC dropped -4.1%, yet our book is up +$32.37 (+1.9%).
Our short legs did exactly what they were engineered to do: provide immediate downside yield while retail gets flushed out of high-leverage perps.
Active hedges leading the book: • Short $ENA : +$32.30 (+33.8%) | • Short $FIL : +$30.94 (+29.3%)
This is how institutional desks trade crypto—hedging out market risk to let protocol outperformance compound.
Real-time position allocations & risk parameters on Binance Copy Trading:
https://www.binance.com/en/copy-trading/lead-details/4483279284065330433?timeRange=30D
#BTC #BinanceSquare #CopyTrading
367

·
--
Article
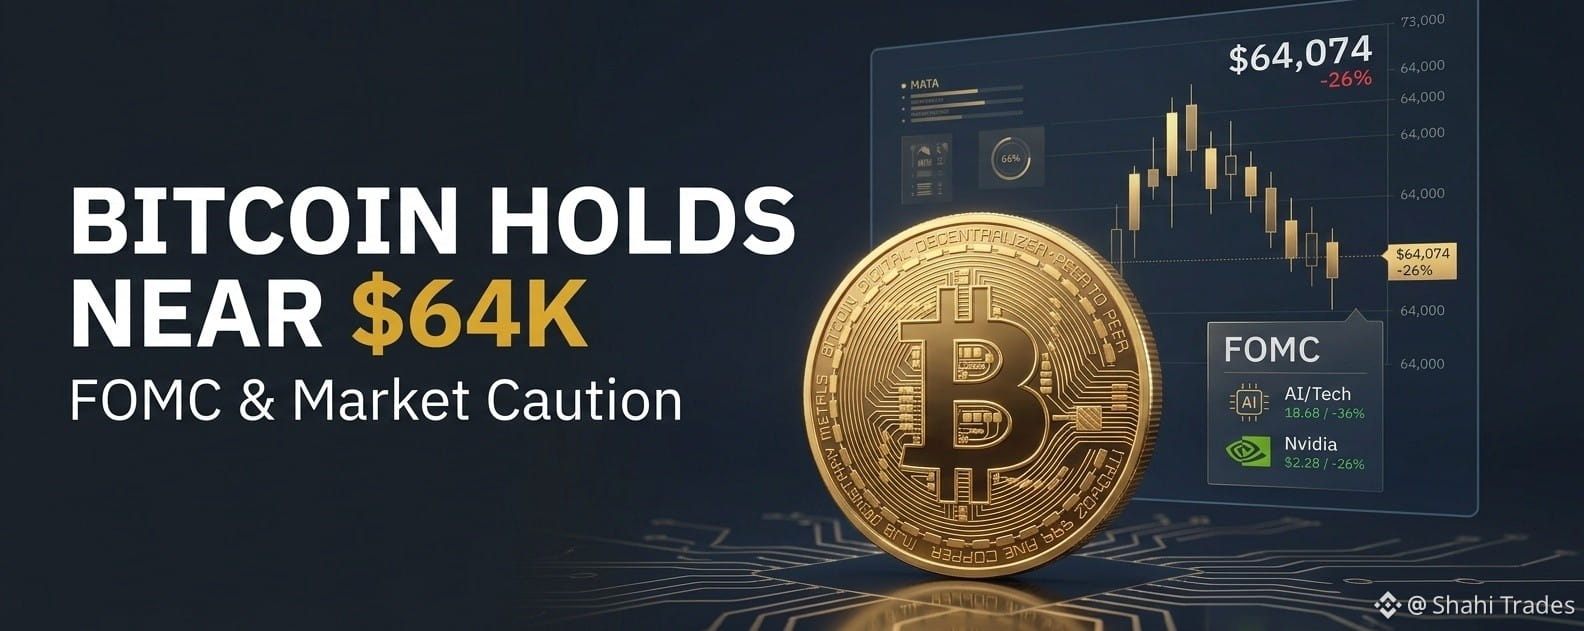
Bitcoin Holds Near $64K: Macro Caution & Post-Nvidia Jitters Weigh In 📉Bitcoin ($BTC ) is hovering around $64,074, marking a roughly 26% pullback from its October peak. Instead of panic, the market is showing classic macro caution.
Here is what is driving the current price action:
• Fed & FOMC Watch: Traders are staying defensive ahead of the upcoming FOMC minutes, weighing the odds of potential Federal Reserve rate hikes and tighter liquidity.
• Post-Nvidia Shift: After Nvidia’s earnings, investors are reassessing risk across tech and AI assets—and that cautious mood is spilling over into crypto.
• Key Zone: $BTC is currently consolidating as traders wait for clearer macro signals before making their next big move.
Smart money is watching the charts closely. Are you buying the dip or waiting on the sidelines? 👇
Disclaimer: Informational purposes only. Not financial advice. Always DYOR.
#FOMC #BinanceSquare #CryptoMarket #BTC
Bitcoin Holds Near $64K: Macro Caution & Post-Nvidia Jitters Weigh In 📉
Bitcoin ($BTC ) is hovering around $64,074, marking a roughly 26% pullback from its October peak. Instead of panic, the market is showing classic macro caution.
Here is what is driving the current price action:
• Fed & FOMC Watch: Traders are staying defensive ahead of the upcoming FOMC minutes, weighing the odds of potential Federal Reserve rate hikes and tighter liquidity.
• Post-Nvidia Shift: After Nvidia’s earnings, investors are reassessing risk across tech and AI assets—and that cautious mood is spilling over into crypto.
• Key Zone: $BTC is currently consolidating as traders wait for clearer macro signals before making their next big move.
Smart money is watching the charts closely. Are you buying the dip or waiting on the sidelines? 👇
Disclaimer: Informational purposes only. Not financial advice. Always DYOR.
#FOMC #BinanceSquare #CryptoMarket #BTC
Here is what is driving the current price action:
• Fed & FOMC Watch: Traders are staying defensive ahead of the upcoming FOMC minutes, weighing the odds of potential Federal Reserve rate hikes and tighter liquidity.
• Post-Nvidia Shift: After Nvidia’s earnings, investors are reassessing risk across tech and AI assets—and that cautious mood is spilling over into crypto.
• Key Zone: $BTC is currently consolidating as traders wait for clearer macro signals before making their next big move.
Smart money is watching the charts closely. Are you buying the dip or waiting on the sidelines? 👇
Disclaimer: Informational purposes only. Not financial advice. Always DYOR.
#FOMC #BinanceSquare #CryptoMarket #BTC
1
89

Log in to explore more content
Join global crypto users on Binance Square
⚡️ Get latest and useful information about crypto.
💬 Trusted by the world’s largest crypto exchange.
👍 Discover real insights from verified creators.
Email / Phone number
Trending Topics
1
#NvidiaBeatsEstimatesWith$130BQ4Outlook
53,888 views
276 Discussing
2
#AnthropicIPOPriceCouldExceed$80
54,874 views
236 Discussing
3
#RussiaCentralBankAddsAlfaBankToCryptoExchangeRegister
3,150 views
45 Discussing
4
#RussianCentralBankPlansToAllowFundsToHoldCryptoIn2027
2,110 views
35 Discussing
5
#VisaPlansStablecoinPrefundingForAPACCrossBorderPayments
3,561 views
36 Discussing
6
#CanNvidia’sDataCenterGrowthContinue?
144,306 views
1,419 Discussing
7
#CanadaAndUSLaunchOperationNiagaraAgainstApprovalPhishing
32,736 views
54 Discussing
8
#BankOfEnglandUnveilsClearingHousePathwayCoveringDLTFirms
4,224 views
66 Discussing
9
#DBSAndCirclePartnerToExpandAsianInstitutionsUSDCAccess
5,287 views
66 Discussing
10
#LedgerHardwareImplantReportsExtendToDubai
84,523 views
808 Discussing