
黑猫SabTheTrader
834 Posts

黑猫SabTheTrader
Report
Block User
👩💻4 Years NQ & Crypto Female Trader | 不管白猫黑猫,赚到钱的就是好猫 | X: SabTheTrader | Price action has the final say | 币安现货合约8折邀请码: SAB111
High-Frequency Trader
6.6 Years
213 Following
16.6K+ Followers
4.7K+ Liked
Posts
All
Quotes
Videos
Live
PINNED
Verified
#美国现货ethetf连续23日净流出 $ETH UP OR DOWN? 👀 ETF outflows continue?
From October 26–30, U.S. spot ETH ETFs saw net outflows for five consecutive trading days, totaling approximately $431 million. Outflows on October 30 alone were about $156 million.
Looking at the month as a whole, there were net outflows on 19 of October’s 22 trading days and net inflows on 3, for total monthly net outflows of approximately $1.6072 billion. Outflows narrowed at first during the final week, then increased noticeably on Thursday and Friday. On October 30, ETHA alone saw $76.6 million in outflows, making it one of the main sources of outflows that day.
ETF demand has been relatively weak, which is certainly worth watching. However, net outflow data reflects subscriptions and redemptions at the fund level; it doesn’t identify the end investors or their reasons for redeeming, nor does it show where the funds or assets go afterward. So it’s not enough on its own to conclude that institutions are all bearish on ETH. Prices are also affected by overall risk appetite, leveraged positions, and spot buying.
Going forward, it’s worth watching whether the price can hold above its previous low. If outflows continue and rebound highs keep falling, it will take more patience to go long. A rebound would be more convincing if funds flow back in and the price stabilizes.
*NFA, DYOR
{future}(ETHUSDT)
#美国现货ethetf连续23日净流出 $ETH UP OR DOWN? 👀 ETF outflows continue?
From October 26–30, U.S. spot ETH ETFs saw net outflows for five consecutive trading days, totaling approximately $431 million. Outflows on October 30 alone were about $156 million.
Looking at the month as a whole, there were net outflows on 19 of October’s 22 trading days and net inflows on 3, for total monthly net outflows of approximately $1.6072 billion. Outflows narrowed at first during the final week, then increased noticeably on Thursday and Friday. On October 30, ETHA alone saw $76.6 million in outflows, making it one of the main sources of outflows that day.
ETF demand has been relatively weak, which is certainly worth watching. However, net outflow data reflects subscriptions and redemptions at the fund level; it doesn’t identify the end investors or their reasons for redeeming, nor does it show where the funds or assets go afterward. So it’s not enough on its own to conclude that institutions are all bearish on ETH. Prices are also affected by overall risk appetite, leveraged positions, and spot buying.
Going forward, it’s worth watching whether the price can hold above its previous low. If outflows continue and rebound highs keep falling, it will take more patience to go long. A rebound would be more convincing if funds flow back in and the price stabilizes.
*NFA, DYOR
From October 26–30, U.S. spot ETH ETFs saw net outflows for five consecutive trading days, totaling approximately $431 million. Outflows on October 30 alone were about $156 million.
Looking at the month as a whole, there were net outflows on 19 of October’s 22 trading days and net inflows on 3, for total monthly net outflows of approximately $1.6072 billion. Outflows narrowed at first during the final week, then increased noticeably on Thursday and Friday. On October 30, ETHA alone saw $76.6 million in outflows, making it one of the main sources of outflows that day.
ETF demand has been relatively weak, which is certainly worth watching. However, net outflow data reflects subscriptions and redemptions at the fund level; it doesn’t identify the end investors or their reasons for redeeming, nor does it show where the funds or assets go afterward. So it’s not enough on its own to conclude that institutions are all bearish on ETH. Prices are also affected by overall risk appetite, leveraged positions, and spot buying.
Going forward, it’s worth watching whether the price can hold above its previous low. If outflows continue and rebound highs keep falling, it will take more patience to go long. A rebound would be more convincing if funds flow back in and the price stabilizes.
*NFA, DYOR

2.7k
13
168
2.7k
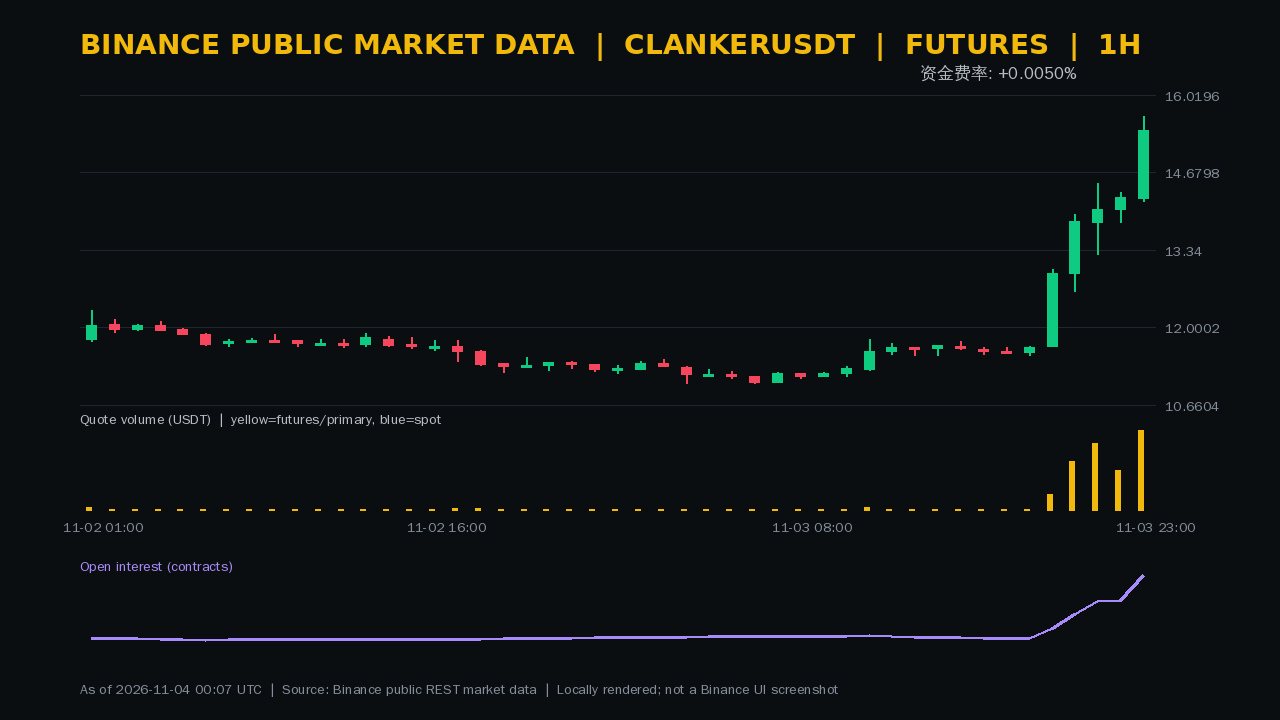
Up 19.09% in 4 hours, with trading volume expanding to 14.14 times that of the previous window and positions accelerating in tandem. According to public Binance data, as of 00:06 (UTC), $CLANKER perpetual was up 39.20% over 24 hours, last trading at 15.73 USDT; Binance has no spot market for this asset for cross-checking.
It rose another 8.29% in the last full hour, while trading volume increased 103.94% from the previous hour. Quantity-based OI rose 21.50% over the last hour and 79.21% over the 30-point window. The indicated and most recent settled funding rates are both around +0.0050%, with no sign yet of extreme costs for chasing longs.
However, rising OI does not reveal the direction of positions, and the convergence of price, volume, and positions in a single-sided perpetual market cannot prove that the rally will continue. With no spot-market confirmation and a sharp 4-hour surge behind it, the risk of concentrated deleveraging is now higher than during the initial move.
If a full hourly candle holds above 15.65 USDT, volume remains firm, and OI growth cools, I’ll continue watching for further upside. If price breaks below 14.18 USDT on rising volume while OI remains elevated, I’ll prioritize the risk of deleveraging and avoid chasing the price.
* NFA, DYOR
Up 19.09% in 4 hours, with trading volume expanding to 14.14 times that of the previous window and positions accelerating in tandem. According to public Binance data, as of 00:06 (UTC), $CLANKER perpetual was up 39.20% over 24 hours, last trading at 15.73 USDT; Binance has no spot market for this asset for cross-checking.
It rose another 8.29% in the last full hour, while trading volume increased 103.94% from the previous hour. Quantity-based OI rose 21.50% over the last hour and 79.21% over the 30-point window. The indicated and most recent settled funding rates are both around +0.0050%, with no sign yet of extreme costs for chasing longs.
However, rising OI does not reveal the direction of positions, and the convergence of price, volume, and positions in a single-sided perpetual market cannot prove that the rally will continue. With no spot-market confirmation and a sharp 4-hour surge behind it, the risk of concentrated deleveraging is now higher than during the initial move.
If a full hourly candle holds above 15.65 USDT, volume remains firm, and OI growth cools, I’ll continue watching for further upside. If price breaks below 14.18 USDT on rising volume while OI remains elevated, I’ll prioritize the risk of deleveraging and avoid chasing the price.
* NFA, DYOR
It rose another 8.29% in the last full hour, while trading volume increased 103.94% from the previous hour. Quantity-based OI rose 21.50% over the last hour and 79.21% over the 30-point window. The indicated and most recent settled funding rates are both around +0.0050%, with no sign yet of extreme costs for chasing longs.
However, rising OI does not reveal the direction of positions, and the convergence of price, volume, and positions in a single-sided perpetual market cannot prove that the rally will continue. With no spot-market confirmation and a sharp 4-hour surge behind it, the risk of concentrated deleveraging is now higher than during the initial move.
If a full hourly candle holds above 15.65 USDT, volume remains firm, and OI growth cools, I’ll continue watching for further upside. If price breaks below 14.18 USDT on rising volume while OI remains elevated, I’ll prioritize the risk of deleveraging and avoid chasing the price.
* NFA, DYOR
489
🧧🧧🧧
🧧🧧🧧
黑猫SabTheTrader
·
--
#美国现货ethetf连续23日净流出 $ETH UP OR DOWN? 👀 ETF outflows continue?
From October 26–30, U.S. spot ETH ETFs saw net outflows for five consecutive trading days, totaling approximately $431 million. Outflows on October 30 alone were about $156 million.
Looking at the month as a whole, there were net outflows on 19 of October’s 22 trading days and net inflows on 3, for total monthly net outflows of approximately $1.6072 billion. Outflows narrowed at first during the final week, then increased noticeably on Thursday and Friday. On October 30, ETHA alone saw $76.6 million in outflows, making it one of the main sources of outflows that day.
ETF demand has been relatively weak, which is certainly worth watching. However, net outflow data reflects subscriptions and redemptions at the fund level; it doesn’t identify the end investors or their reasons for redeeming, nor does it show where the funds or assets go afterward. So it’s not enough on its own to conclude that institutions are all bearish on ETH. Prices are also affected by overall risk appetite, leveraged positions, and spot buying.
Going forward, it’s worth watching whether the price can hold above its previous low. If outflows continue and rebound highs keep falling, it will take more patience to go long. A rebound would be more convincing if funds flow back in and the price stabilizes.
*NFA, DYOR
From October 26–30, U.S. spot ETH ETFs saw net outflows for five consecutive trading days, totaling approximately $431 million. Outflows on October 30 alone were about $156 million.
Looking at the month as a whole, there were net outflows on 19 of October’s 22 trading days and net inflows on 3, for total monthly net outflows of approximately $1.6072 billion. Outflows narrowed at first during the final week, then increased noticeably on Thursday and Friday. On October 30, ETHA alone saw $76.6 million in outflows, making it one of the main sources of outflows that day.
ETF demand has been relatively weak, which is certainly worth watching. However, net outflow data reflects subscriptions and redemptions at the fund level; it doesn’t identify the end investors or their reasons for redeeming, nor does it show where the funds or assets go afterward. So it’s not enough on its own to conclude that institutions are all bearish on ETH. Prices are also affected by overall risk appetite, leveraged positions, and spot buying.
Going forward, it’s worth watching whether the price can hold above its previous low. If outflows continue and rebound highs keep falling, it will take more patience to go long. A rebound would be more convincing if funds flow back in and the price stabilizes.
*NFA, DYOR

1
513


奋斗Hustle1688
·
--
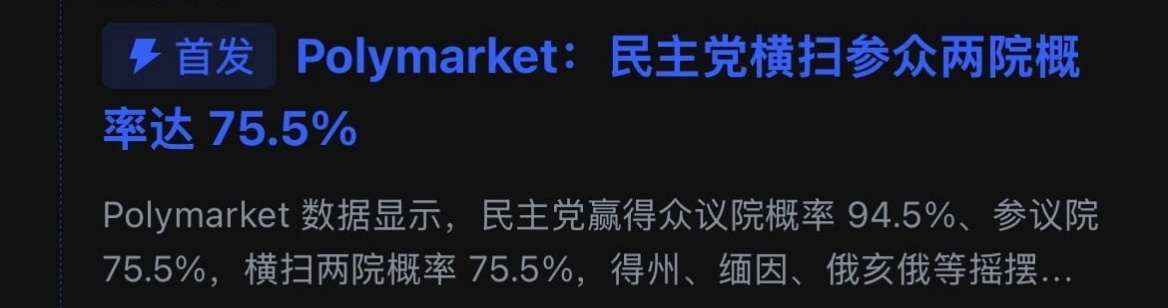
Actually, if Trump loses the midterm elections, it might not be a bad thing for crypto.
Look back at what happened after Trump won in 2024. He talked about supporting crypto, but then launched his own Trump coin, which kept plunging and dragged the whole market down with it. During his time in office, the crypto bull market’s gains have been downright lousy.
Now look at the previous cycle, when Biden was elected in 2021. That was a real bull market, and everyone made a fortune.
So if Trump ends up “lame-ducked” this time around, it might not be a bad thing at all. Who knows—maybe the altcoin season bull run will climb even higher! We’ll see.
Look back at what happened after Trump won in 2024. He talked about supporting crypto, but then launched his own Trump coin, which kept plunging and dragged the whole market down with it. During his time in office, the crypto bull market’s gains have been downright lousy.
Now look at the previous cycle, when Biden was elected in 2021. That was a real bull market, and everyone made a fortune.
So if Trump ends up “lame-ducked” this time around, it might not be a bad thing at all. Who knows—maybe the altcoin season bull run will climb even higher! We’ll see.
1
172
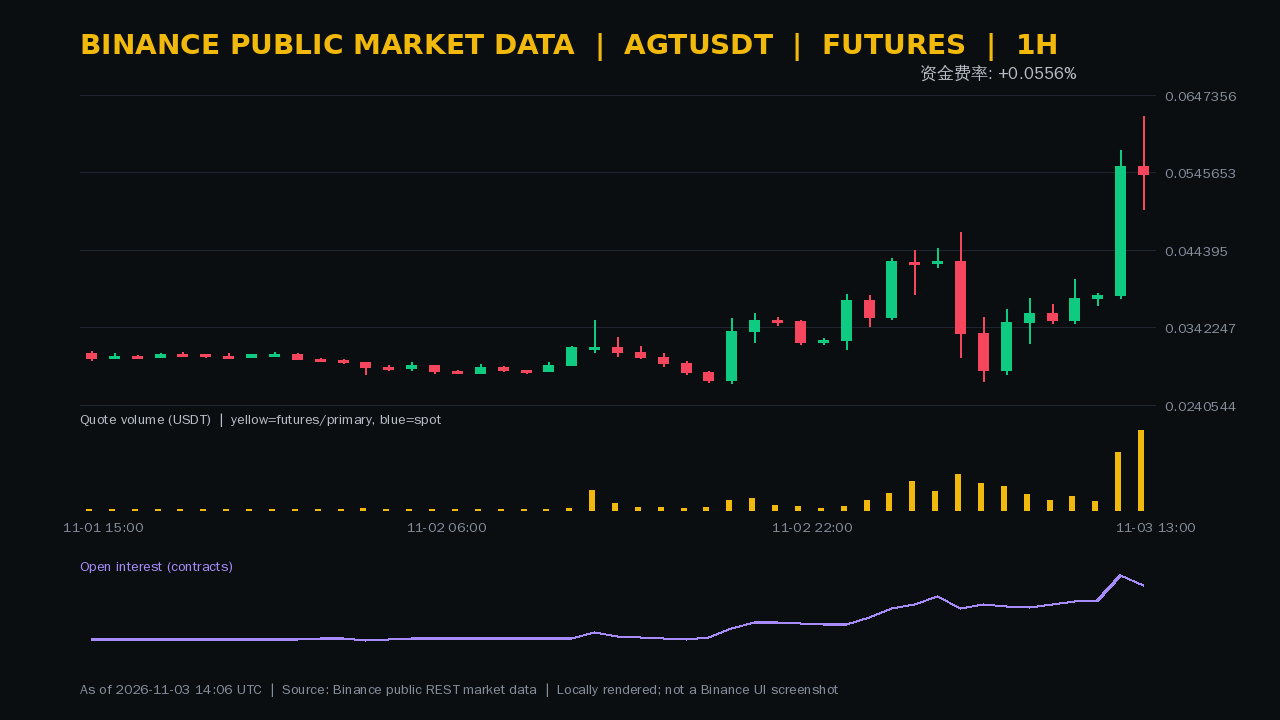
Up 54.96% in 4 hours, but pulled back in the last full hour as trading volume rose 38.02%—AGT’s acceleration phase is beginning to show signs of elevated turnover. As of 14:06 (UTC), public Binance data showed the $AGT perpetual contract up 73.16% over 24 hours, with the latest price at 0.05387 USDT; there is no Binance spot market for this asset to provide cross-verification.
Positioning has not continued to accelerate in tandem: OI by contract quantity is still up 22.58% across 30 data points, but fell 3.44% in the most recent hour. Meanwhile, the indicative funding rate is around +0.0556%, while the most recent actual settlement was around +0.0151%, raising the cost of chasing longs.
These figures confirm only a significant increase in medium-term leveraged participation. They cannot tell whether the short-term OI decline came from longs or shorts closing positions, nor prove that the 24-hour rally will continue. Trading volume over the last 4 full hours was 2.11 times that of the previous window, but the lack of spot-market cross-verification remains the main limitation.
I’ll treat 0.06193 USDT as the upside confirmation level: I’ll continue watching for further gains only if a full hourly candle closes back above it on higher volume and OI no longer surges. If the price falls below 0.04966 USDT on rising volume while OI remains high, I’ll treat it as a risk of concentrated deleveraging and avoid chasing after the acceleration.
* NFA, DYOR
Up 54.96% in 4 hours, but pulled back in the last full hour as trading volume rose 38.02%—AGT’s acceleration phase is beginning to show signs of elevated turnover. As of 14:06 (UTC), public Binance data showed the $AGT perpetual contract up 73.16% over 24 hours, with the latest price at 0.05387 USDT; there is no Binance spot market for this asset to provide cross-verification.
Positioning has not continued to accelerate in tandem: OI by contract quantity is still up 22.58% across 30 data points, but fell 3.44% in the most recent hour. Meanwhile, the indicative funding rate is around +0.0556%, while the most recent actual settlement was around +0.0151%, raising the cost of chasing longs.
These figures confirm only a significant increase in medium-term leveraged participation. They cannot tell whether the short-term OI decline came from longs or shorts closing positions, nor prove that the 24-hour rally will continue. Trading volume over the last 4 full hours was 2.11 times that of the previous window, but the lack of spot-market cross-verification remains the main limitation.
I’ll treat 0.06193 USDT as the upside confirmation level: I’ll continue watching for further gains only if a full hourly candle closes back above it on higher volume and OI no longer surges. If the price falls below 0.04966 USDT on rising volume while OI remains high, I’ll treat it as a risk of concentrated deleveraging and avoid chasing after the acceleration.
* NFA, DYOR
Positioning has not continued to accelerate in tandem: OI by contract quantity is still up 22.58% across 30 data points, but fell 3.44% in the most recent hour. Meanwhile, the indicative funding rate is around +0.0556%, while the most recent actual settlement was around +0.0151%, raising the cost of chasing longs.
These figures confirm only a significant increase in medium-term leveraged participation. They cannot tell whether the short-term OI decline came from longs or shorts closing positions, nor prove that the 24-hour rally will continue. Trading volume over the last 4 full hours was 2.11 times that of the previous window, but the lack of spot-market cross-verification remains the main limitation.
I’ll treat 0.06193 USDT as the upside confirmation level: I’ll continue watching for further gains only if a full hourly candle closes back above it on higher volume and OI no longer surges. If the price falls below 0.04966 USDT on rising volume while OI remains high, I’ll treat it as a risk of concentrated deleveraging and avoid chasing after the acceleration.
* NFA, DYOR
1
843

CJ_GraceWang1688
·
--
10h 🎁🎁🎁🎁🎁🎁
#币安恢复28种法币提现
$BTC
#币安恢复28种法币提现
$BTC
150

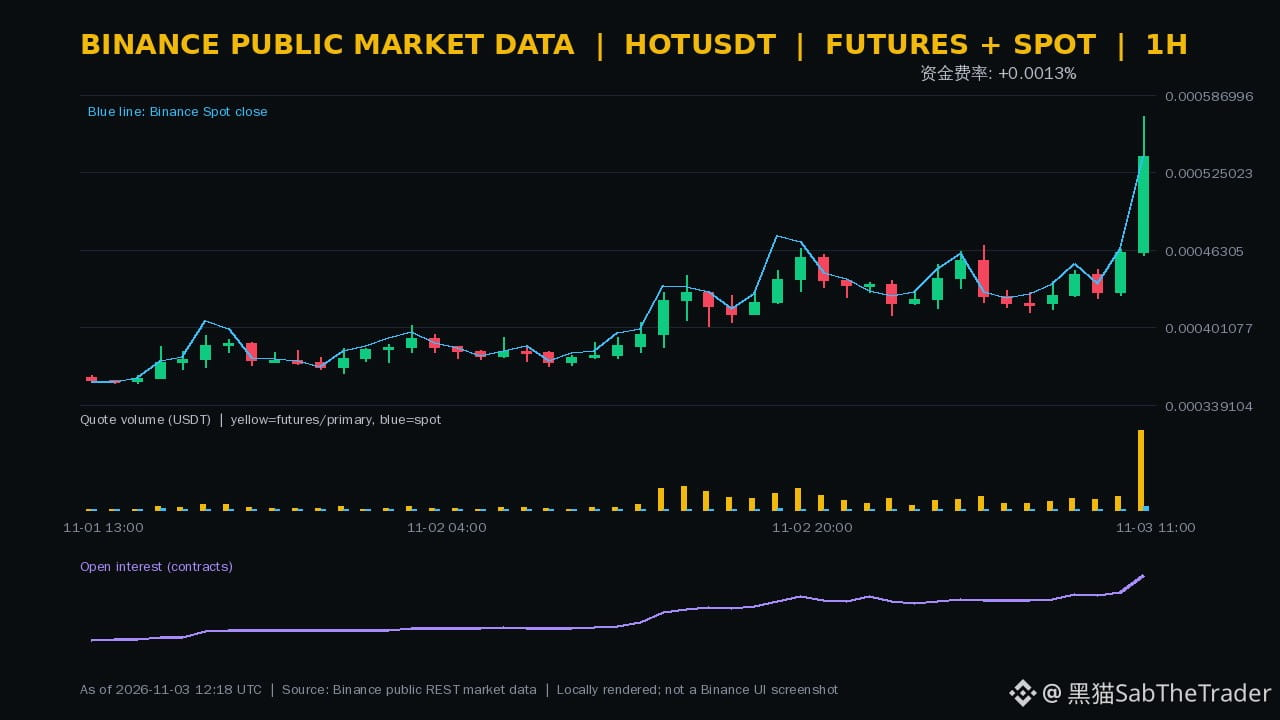
Up 26.08% in 4 hours, with another 16.70% gain in the latest complete hour—but price isn't the only thing surging. The spot and perpetual markets for $HOT rose 50.26% and 52.66%, respectively, over the rolling 24 hours, while hourly trading volume jumped 490.47% period over period and OI in contracts increased 27.58% over the same period.
Volume, price, and open interest are expanding together, suggesting that short-term leverage is building rapidly; the cumulative increase across 30 OI data points has reached 195.47%. However, both the indicative and most recently settled funding rates are around 0.00125%, showing no sign of extreme costs for long positions. Total OI also cannot prove that new positions are coming from longs, let alone confirm that the rally will continue based solely on these simultaneous increases.
I would view 0.0005699 USDT as the upside confirmation level: a breakout on rising volume with OI growth cooling would make the structure healthier. If the price pulls back below 0.0004586 USDT while OI continues expanding at elevated levels, crowded leverage could amplify volatility.
* NFA, DYOR
Up 26.08% in 4 hours, with another 16.70% gain in the latest complete hour—but price isn't the only thing surging. The spot and perpetual markets for $HOT rose 50.26% and 52.66%, respectively, over the rolling 24 hours, while hourly trading volume jumped 490.47% period over period and OI in contracts increased 27.58% over the same period.
Volume, price, and open interest are expanding together, suggesting that short-term leverage is building rapidly; the cumulative increase across 30 OI data points has reached 195.47%. However, both the indicative and most recently settled funding rates are around 0.00125%, showing no sign of extreme costs for long positions. Total OI also cannot prove that new positions are coming from longs, let alone confirm that the rally will continue based solely on these simultaneous increases.
I would view 0.0005699 USDT as the upside confirmation level: a breakout on rising volume with OI growth cooling would make the structure healthier. If the price pulls back below 0.0004586 USDT while OI continues expanding at elevated levels, crowded leverage could amplify volatility.
* NFA, DYOR
Volume, price, and open interest are expanding together, suggesting that short-term leverage is building rapidly; the cumulative increase across 30 OI data points has reached 195.47%. However, both the indicative and most recently settled funding rates are around 0.00125%, showing no sign of extreme costs for long positions. Total OI also cannot prove that new positions are coming from longs, let alone confirm that the rally will continue based solely on these simultaneous increases.
I would view 0.0005699 USDT as the upside confirmation level: a breakout on rising volume with OI growth cooling would make the structure healthier. If the price pulls back below 0.0004586 USDT while OI continues expanding at elevated levels, crowded leverage could amplify volatility.
* NFA, DYOR
197
#BinancePick Ding ding ding ding~ I placed this bet today; the odds of winning should be pretty good. Remember to check in.
#BinancePick Ding ding ding ding~ I placed this bet today; the odds of winning should be pretty good. Remember to check in.

2
1
253
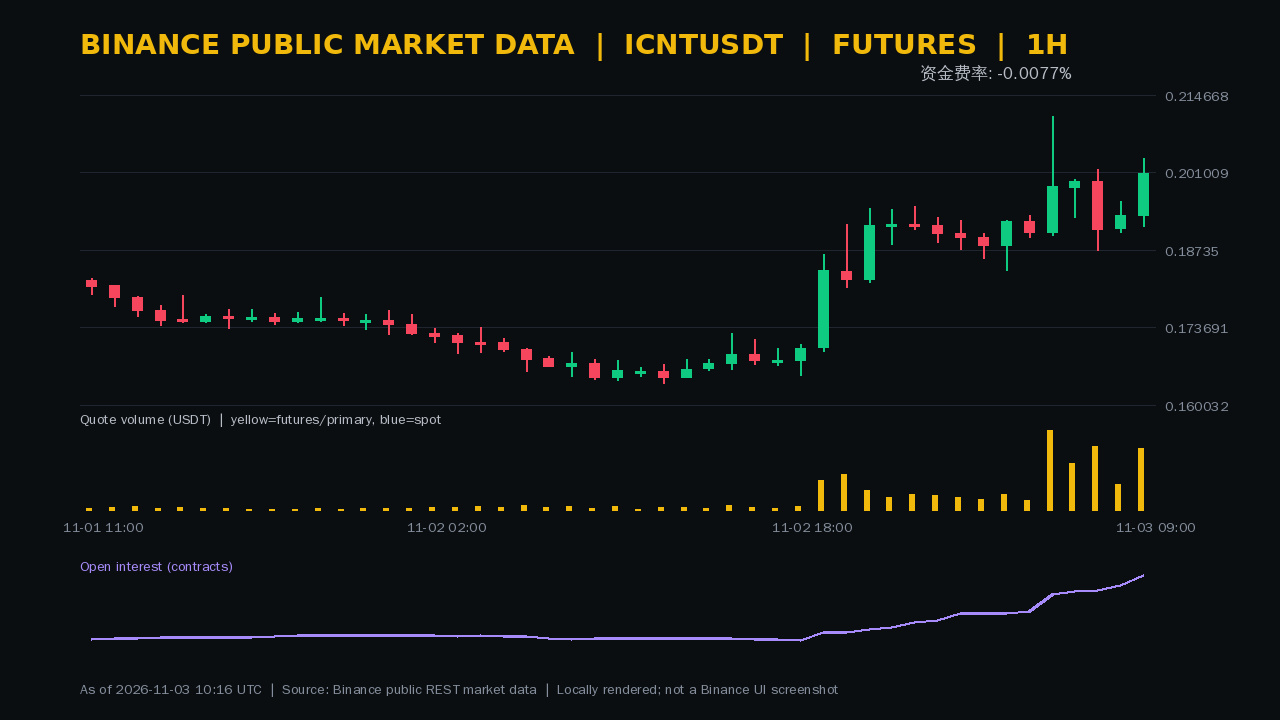
Turnover in the last complete hour increased 138.74% from the previous hour, open interest (OI) quantity rose 4.17%, and $ICNT gained 3.83% over the same period. As of 10:16 (UTC), the perpetual contract’s 24-hour gain had widened to 26.91%, with the latest price at 0.2113 USDT. Volume, price, and OI have suddenly accelerated in sync, but this pattern has not yet been confirmed over consecutive hourly periods.
Looking at a window of four complete hours, the price rose just 1.26%, even though turnover had reached 1.71 times that of the previous window; OI increased by a cumulative 31.18% across 30 data points. New leverage is entering, but the short-term price move relies mainly on the latest hourly surge, which does not prove that the trend is expanding steadily.
The indicative funding rate is about -0.0077%, while the latest actual settlement was about +0.0027%, putting holding costs near neutral. This offers no evidence of one-sided crowding, and OI growth alone cannot identify the direction of new positions.
If a complete hourly candle holds above 0.2034 USDT on increased volume, while OI growth remains moderate, that would support continuing to watch for further upside. If the price falls back below 0.2008 USDT while OI contracts, this acceleration may look more like a failed breakout. A drop below 0.1915 USDT would raise the risk of volatility amplifying as positions are deleveraged.
* NFA, DYOR
Turnover in the last complete hour increased 138.74% from the previous hour, open interest (OI) quantity rose 4.17%, and $ICNT gained 3.83% over the same period. As of 10:16 (UTC), the perpetual contract’s 24-hour gain had widened to 26.91%, with the latest price at 0.2113 USDT. Volume, price, and OI have suddenly accelerated in sync, but this pattern has not yet been confirmed over consecutive hourly periods.
Looking at a window of four complete hours, the price rose just 1.26%, even though turnover had reached 1.71 times that of the previous window; OI increased by a cumulative 31.18% across 30 data points. New leverage is entering, but the short-term price move relies mainly on the latest hourly surge, which does not prove that the trend is expanding steadily.
The indicative funding rate is about -0.0077%, while the latest actual settlement was about +0.0027%, putting holding costs near neutral. This offers no evidence of one-sided crowding, and OI growth alone cannot identify the direction of new positions.
If a complete hourly candle holds above 0.2034 USDT on increased volume, while OI growth remains moderate, that would support continuing to watch for further upside. If the price falls back below 0.2008 USDT while OI contracts, this acceleration may look more like a failed breakout. A drop below 0.1915 USDT would raise the risk of volatility amplifying as positions are deleveraged.
* NFA, DYOR
Looking at a window of four complete hours, the price rose just 1.26%, even though turnover had reached 1.71 times that of the previous window; OI increased by a cumulative 31.18% across 30 data points. New leverage is entering, but the short-term price move relies mainly on the latest hourly surge, which does not prove that the trend is expanding steadily.
The indicative funding rate is about -0.0077%, while the latest actual settlement was about +0.0027%, putting holding costs near neutral. This offers no evidence of one-sided crowding, and OI growth alone cannot identify the direction of new positions.
If a complete hourly candle holds above 0.2034 USDT on increased volume, while OI growth remains moderate, that would support continuing to watch for further upside. If the price falls back below 0.2008 USDT while OI contracts, this acceleration may look more like a failed breakout. A drop below 0.1915 USDT would raise the risk of volatility amplifying as positions are deleveraged.
* NFA, DYOR
307

阿婧1688
·
--
$SOL $BNB
May the flowers bloom brilliantly, and may every year bring peace.
Send your feelings with flowers and quietly enjoy the beauty!
May the flowers bloom brilliantly, and may every year bring peace.
Send your feelings with flowers and quietly enjoy the beauty!

1
181
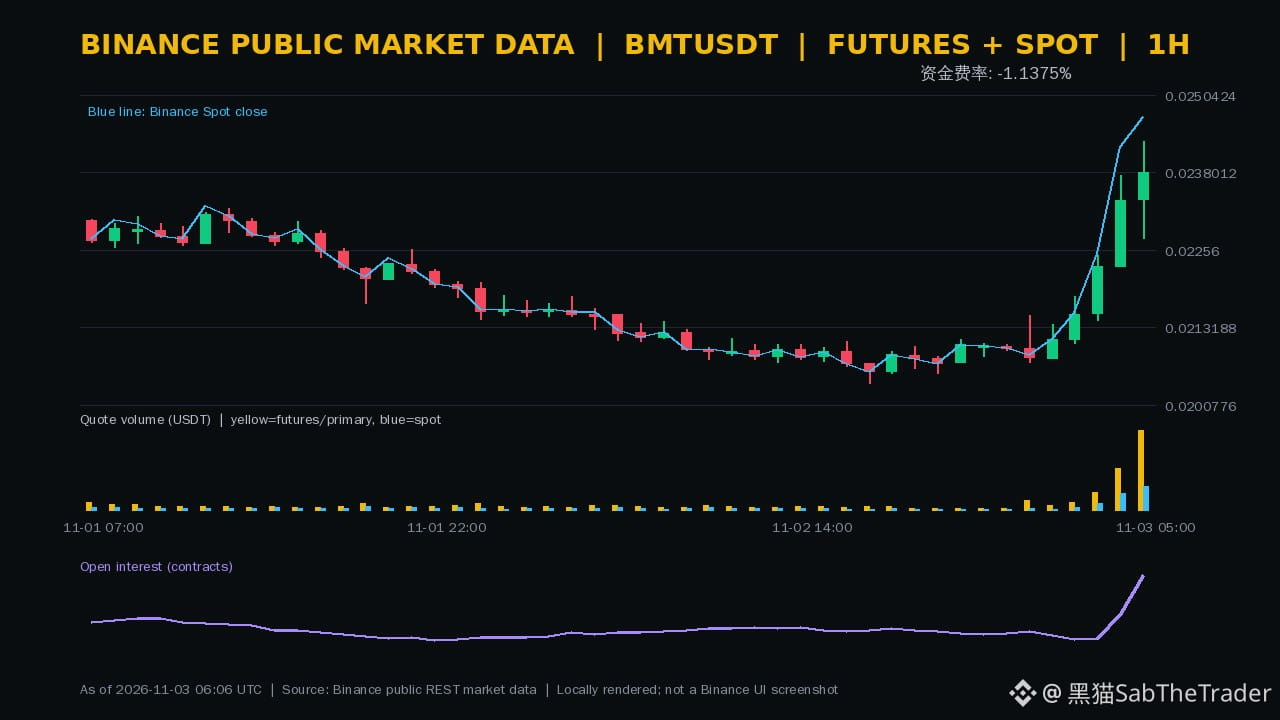
After the withdrawal resumption list was announced, both price and positioning costs moved to extremes. Binance announced that it would resume withdrawals for multiple assets in phases starting at 04:00 UTC on November 3, with $BMT included on the BSC and SOL lists. As of 06:06 UTC, its spot and perpetual prices were up 14.91% and 10.78%, respectively, over 24 hours.
It rose 12.69% over the last four full hours, with trading volume reaching 8.96 times that of the preceding window. In the most recent full hour, it gained another 1.84%, while trading volume increased 92.14% from the previous hour; OI in units then rose 13.33%. The announcement introduced a new variable, while price, volume, and open interest strengthened in tandem.
Binance also noted that resumption would proceed asset by asset, and advised users to check the withdrawal page or network status page to confirm availability. The list should not be taken to mean that all networks have reopened simultaneously. The indicative funding rate is around -1.1375%, while the most recent actual settlement was only -0.1482%. Deeply negative rates could amplify squeezes in either direction, but they do not prove that all new OI is from shorts or guarantee that the rally will continue.
If volume remains elevated and price holds above 0.02429 USDT for a full hour, while OI growth stays moderate, the event-driven move may have room to spread further. If price falls below 0.02275 USDT amid rising volume and contracting OI, treat it first as post-announcement deleveraging.
* NFA, DYOR
After the withdrawal resumption list was announced, both price and positioning costs moved to extremes. Binance announced that it would resume withdrawals for multiple assets in phases starting at 04:00 UTC on November 3, with $BMT included on the BSC and SOL lists. As of 06:06 UTC, its spot and perpetual prices were up 14.91% and 10.78%, respectively, over 24 hours.
It rose 12.69% over the last four full hours, with trading volume reaching 8.96 times that of the preceding window. In the most recent full hour, it gained another 1.84%, while trading volume increased 92.14% from the previous hour; OI in units then rose 13.33%. The announcement introduced a new variable, while price, volume, and open interest strengthened in tandem.
Binance also noted that resumption would proceed asset by asset, and advised users to check the withdrawal page or network status page to confirm availability. The list should not be taken to mean that all networks have reopened simultaneously. The indicative funding rate is around -1.1375%, while the most recent actual settlement was only -0.1482%. Deeply negative rates could amplify squeezes in either direction, but they do not prove that all new OI is from shorts or guarantee that the rally will continue.
If volume remains elevated and price holds above 0.02429 USDT for a full hour, while OI growth stays moderate, the event-driven move may have room to spread further. If price falls below 0.02275 USDT amid rising volume and contracting OI, treat it first as post-announcement deleveraging.
* NFA, DYOR
It rose 12.69% over the last four full hours, with trading volume reaching 8.96 times that of the preceding window. In the most recent full hour, it gained another 1.84%, while trading volume increased 92.14% from the previous hour; OI in units then rose 13.33%. The announcement introduced a new variable, while price, volume, and open interest strengthened in tandem.
Binance also noted that resumption would proceed asset by asset, and advised users to check the withdrawal page or network status page to confirm availability. The list should not be taken to mean that all networks have reopened simultaneously. The indicative funding rate is around -1.1375%, while the most recent actual settlement was only -0.1482%. Deeply negative rates could amplify squeezes in either direction, but they do not prove that all new OI is from shorts or guarantee that the rally will continue.
If volume remains elevated and price holds above 0.02429 USDT for a full hour, while OI growth stays moderate, the event-driven move may have room to spread further. If price falls below 0.02275 USDT amid rising volume and contracting OI, treat it first as post-announcement deleveraging.
* NFA, DYOR
328

小马哥哥啊
·
--
BullishSuddenly, I feel a little lost!
When will we meet again?
$BTC
When will we meet again?
$BTC
1
1
406
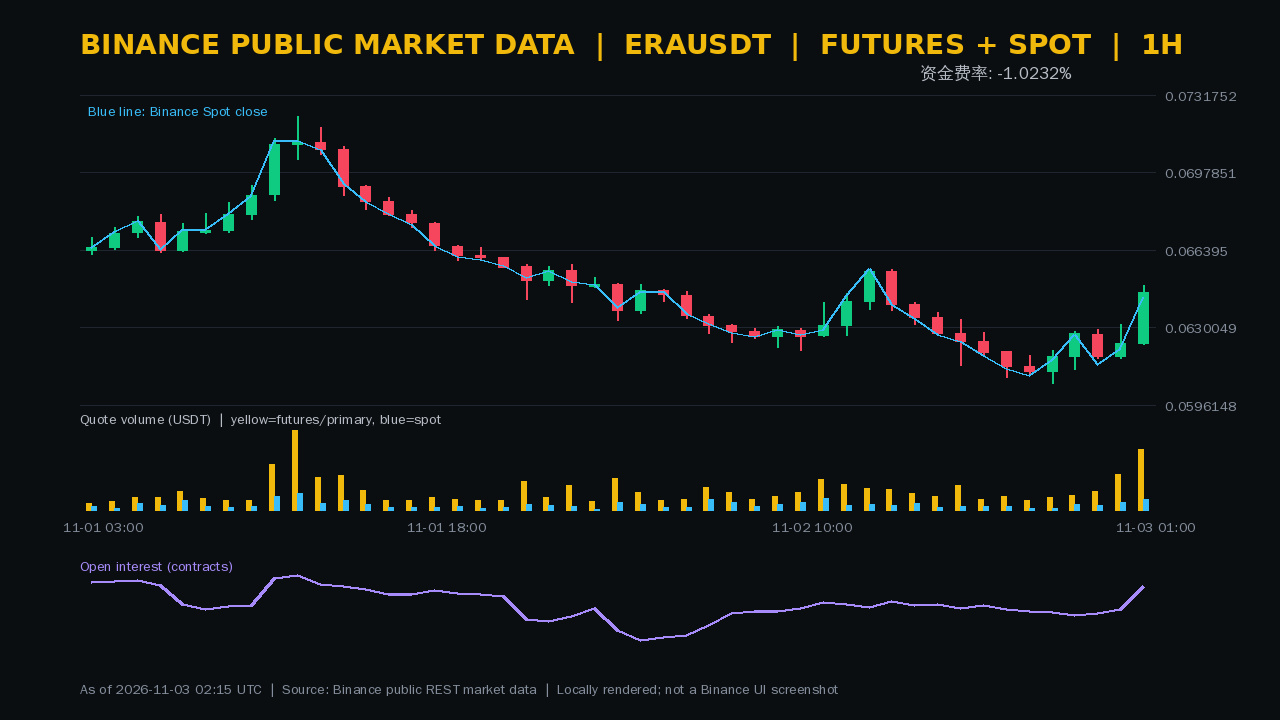
The funding rate fell below -1%, yet the price rose 4.54% over the last 4 complete hours. As of 02:16 (UTC), Binance public data showed that spot and perpetuals were up 2.01% and 2.76%, respectively, over 24 hours for $ERA , indicating a clear divergence between short-term pricing and holding costs.
Perpetuals rose 3.61% in the previous complete hour, while trading volume increased 71.23% from the prior hour; OI in contract units also rose 2.84%. Trading volume over the last 4 hours was 2.80 times that of the previous window, suggesting the rebound is accompanied by new leverage. However, OI increased by only 0.96% over the 30-point window, so confirmation from medium-term positioning remains weak.
⚠️ The indicative funding rate is approximately -1.0435%, while the latest actual settlement was only -0.2066%. The indicative rate can still change before settlement. A negative funding rate also does not prove that all new positions are shorts, nor does it alone imply that a short squeeze will continue.
A continued move higher is worth watching only if a complete hourly candle holds above 0.06484 USDT on increased volume and OI expands moderately. If the price falls below 0.06115 USDT on rising volume while OI does not contract, beware of a reversal unwinding crowded leverage. I don’t chase a rally after a single high-volume candle.
* NFA, DYOR
The funding rate fell below -1%, yet the price rose 4.54% over the last 4 complete hours. As of 02:16 (UTC), Binance public data showed that spot and perpetuals were up 2.01% and 2.76%, respectively, over 24 hours for $ERA , indicating a clear divergence between short-term pricing and holding costs.
Perpetuals rose 3.61% in the previous complete hour, while trading volume increased 71.23% from the prior hour; OI in contract units also rose 2.84%. Trading volume over the last 4 hours was 2.80 times that of the previous window, suggesting the rebound is accompanied by new leverage. However, OI increased by only 0.96% over the 30-point window, so confirmation from medium-term positioning remains weak.
⚠️ The indicative funding rate is approximately -1.0435%, while the latest actual settlement was only -0.2066%. The indicative rate can still change before settlement. A negative funding rate also does not prove that all new positions are shorts, nor does it alone imply that a short squeeze will continue.
A continued move higher is worth watching only if a complete hourly candle holds above 0.06484 USDT on increased volume and OI expands moderately. If the price falls below 0.06115 USDT on rising volume while OI does not contract, beware of a reversal unwinding crowded leverage. I don’t chase a rally after a single high-volume candle.
* NFA, DYOR
Perpetuals rose 3.61% in the previous complete hour, while trading volume increased 71.23% from the prior hour; OI in contract units also rose 2.84%. Trading volume over the last 4 hours was 2.80 times that of the previous window, suggesting the rebound is accompanied by new leverage. However, OI increased by only 0.96% over the 30-point window, so confirmation from medium-term positioning remains weak.
⚠️ The indicative funding rate is approximately -1.0435%, while the latest actual settlement was only -0.2066%. The indicative rate can still change before settlement. A negative funding rate also does not prove that all new positions are shorts, nor does it alone imply that a short squeeze will continue.
A continued move higher is worth watching only if a complete hourly candle holds above 0.06484 USDT on increased volume and OI expands moderately. If the price falls below 0.06115 USDT on rising volume while OI does not contract, beware of a reversal unwinding crowded leverage. I don’t chase a rally after a single high-volume candle.
* NFA, DYOR
279
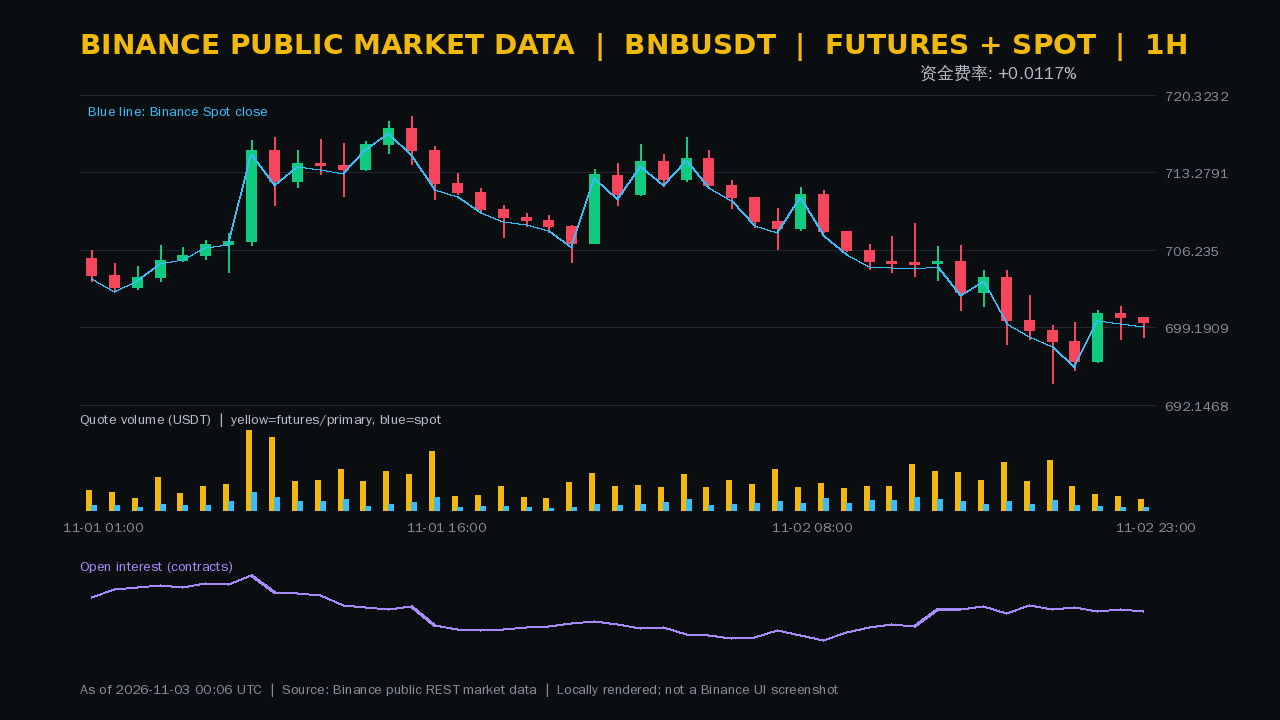
The complete ZK PoR proof has been generated, finally moving this recovery effort from “company assurances” to something users can independently verify. Binance said in Recovery Update #5 that zero-knowledge proofs have been completed for the reserve snapshot of 10 major assets taken at 00:00 UTC on October 31, and that users can verify their balances are backed at least 1:1; about 95% of the affected amount is covered. $BNB is one of these 10 assets.
The market has not priced in a corresponding removal of risk. As of 00:06 UTC, BNB spot and perpetuals were down 1.95% and 1.93% over 24 hours, respectively. Over the last four complete hours, perpetuals recovered just 0.26%, trading volume fell to 0.41 times that of the previous window, and the latest one-hour OI quantity declined 0.11%. The news is more concrete, but buying confirmation remains weak.
This proof applies only to the specified snapshot and 10 assets. It does not mean that all assets, real-time solvency, or the security incident have been fully resolved; about 5% remains to be covered. If BNB reclaims 716.48 USDT on increased volume and subsequent expanded snapshots are verifiable as scheduled, that would provide evidence for the risk premium to continue easing. If it falls below 693.77 USDT alongside an expansion in OI, first guard against the market continuing to price in uncertainty.
* NFA, DYOR
The complete ZK PoR proof has been generated, finally moving this recovery effort from “company assurances” to something users can independently verify. Binance said in Recovery Update #5 that zero-knowledge proofs have been completed for the reserve snapshot of 10 major assets taken at 00:00 UTC on October 31, and that users can verify their balances are backed at least 1:1; about 95% of the affected amount is covered. $BNB is one of these 10 assets.
The market has not priced in a corresponding removal of risk. As of 00:06 UTC, BNB spot and perpetuals were down 1.95% and 1.93% over 24 hours, respectively. Over the last four complete hours, perpetuals recovered just 0.26%, trading volume fell to 0.41 times that of the previous window, and the latest one-hour OI quantity declined 0.11%. The news is more concrete, but buying confirmation remains weak.
This proof applies only to the specified snapshot and 10 assets. It does not mean that all assets, real-time solvency, or the security incident have been fully resolved; about 5% remains to be covered. If BNB reclaims 716.48 USDT on increased volume and subsequent expanded snapshots are verifiable as scheduled, that would provide evidence for the risk premium to continue easing. If it falls below 693.77 USDT alongside an expansion in OI, first guard against the market continuing to price in uncertainty.
* NFA, DYOR
The market has not priced in a corresponding removal of risk. As of 00:06 UTC, BNB spot and perpetuals were down 1.95% and 1.93% over 24 hours, respectively. Over the last four complete hours, perpetuals recovered just 0.26%, trading volume fell to 0.41 times that of the previous window, and the latest one-hour OI quantity declined 0.11%. The news is more concrete, but buying confirmation remains weak.
This proof applies only to the specified snapshot and 10 assets. It does not mean that all assets, real-time solvency, or the security incident have been fully resolved; about 5% remains to be covered. If BNB reclaims 716.48 USDT on increased volume and subsequent expanded snapshots are verifiable as scheduled, that would provide evidence for the risk premium to continue easing. If it falls below 693.77 USDT alongside an expansion in OI, first guard against the market continuing to price in uncertainty.
* NFA, DYOR
529
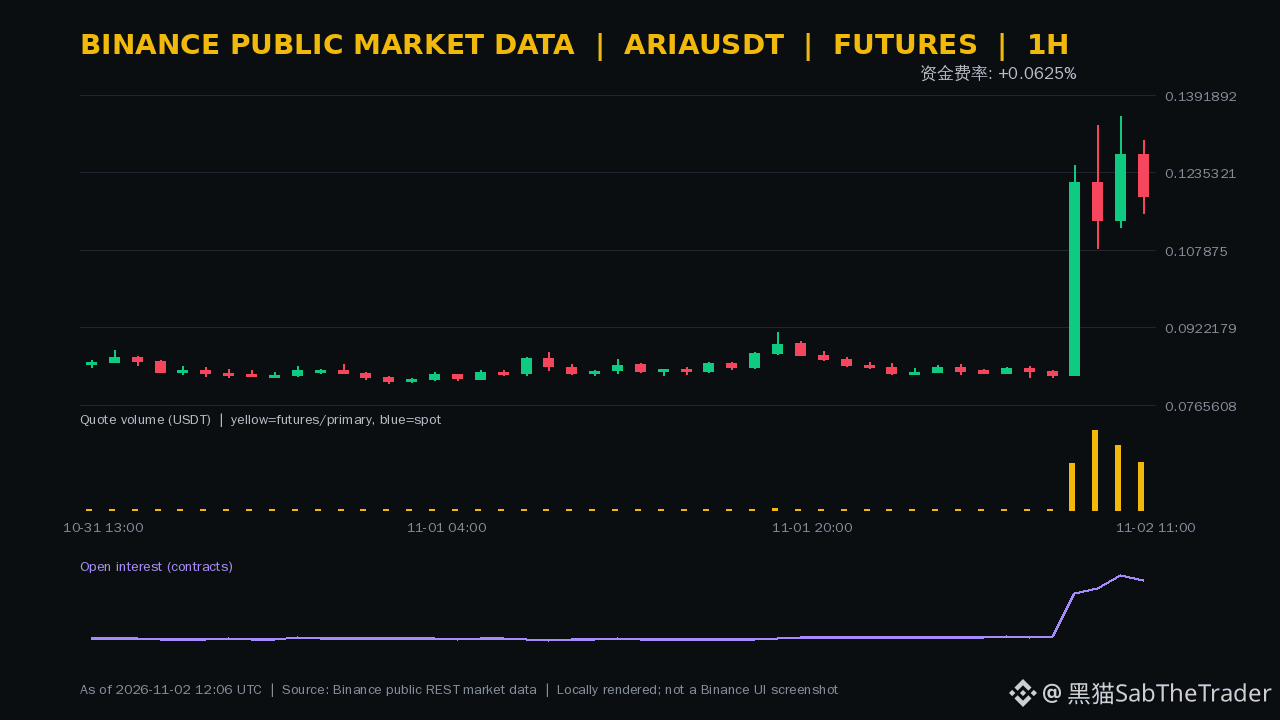
Up 43.80% in 4 hours, with trading volume expanding to 274.62 times that of the previous window, while the last full hour pulled back 6.68%. As of 12:06 (UTC), Binance public data showed $ARIA perpetual at approximately 0.12107 USDT, up 45.20% over 24 hours, but Binance spot trading was unavailable.
OI quantity increased 29.69% over the 30-point window, but fell 2.05% in the most recent hour. This indicates a significant build-up in leveraged positions over the medium term, with some positions already exiting during the short-term pullback. Without spot confirmation, OI cannot reveal the net long or short direction of newly opened positions.
⚠️ The indicative funding rate is approximately +0.0625%, while the most recent actual settlement was around +0.0635%. A positive rate raises the cost of holding long positions, but concurrent changes in price, volume, and OI still cannot prove that the rise will continue.
Only a high-volume breakout above 0.13487 in a full hour, accompanied by a moderation in OI growth, would support continuing to watch for further upside. If the price falls below 0.11528 on rising volume while OI remains high, prioritize guarding against a concentrated deleveraging event. I will not chase the rally while it remains unclear whether the pullback has ended.
* NFA, DYOR
Up 43.80% in 4 hours, with trading volume expanding to 274.62 times that of the previous window, while the last full hour pulled back 6.68%. As of 12:06 (UTC), Binance public data showed $ARIA perpetual at approximately 0.12107 USDT, up 45.20% over 24 hours, but Binance spot trading was unavailable.
OI quantity increased 29.69% over the 30-point window, but fell 2.05% in the most recent hour. This indicates a significant build-up in leveraged positions over the medium term, with some positions already exiting during the short-term pullback. Without spot confirmation, OI cannot reveal the net long or short direction of newly opened positions.
⚠️ The indicative funding rate is approximately +0.0625%, while the most recent actual settlement was around +0.0635%. A positive rate raises the cost of holding long positions, but concurrent changes in price, volume, and OI still cannot prove that the rise will continue.
Only a high-volume breakout above 0.13487 in a full hour, accompanied by a moderation in OI growth, would support continuing to watch for further upside. If the price falls below 0.11528 on rising volume while OI remains high, prioritize guarding against a concentrated deleveraging event. I will not chase the rally while it remains unclear whether the pullback has ended.
* NFA, DYOR
OI quantity increased 29.69% over the 30-point window, but fell 2.05% in the most recent hour. This indicates a significant build-up in leveraged positions over the medium term, with some positions already exiting during the short-term pullback. Without spot confirmation, OI cannot reveal the net long or short direction of newly opened positions.
⚠️ The indicative funding rate is approximately +0.0625%, while the most recent actual settlement was around +0.0635%. A positive rate raises the cost of holding long positions, but concurrent changes in price, volume, and OI still cannot prove that the rise will continue.
Only a high-volume breakout above 0.13487 in a full hour, accompanied by a moderation in OI growth, would support continuing to watch for further upside. If the price falls below 0.11528 on rising volume while OI remains high, prioritize guarding against a concentrated deleveraging event. I will not chase the rally while it remains unclear whether the pullback has ended.
* NFA, DYOR
284
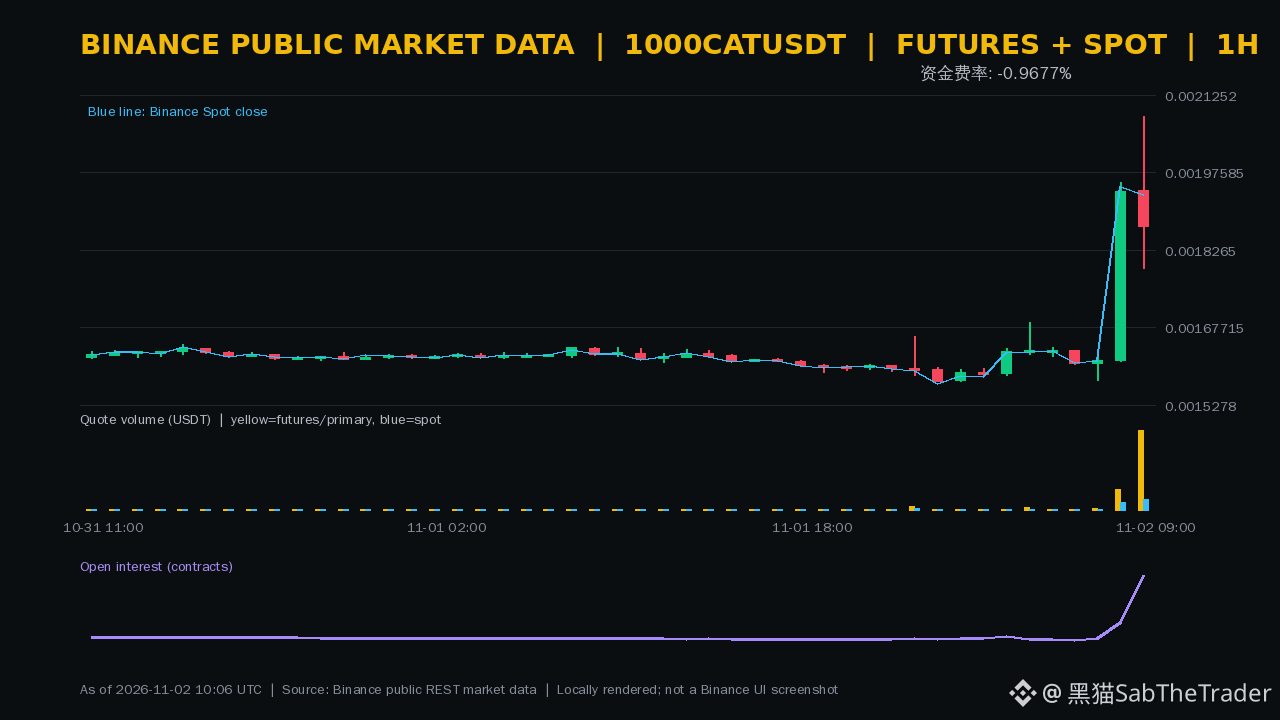
The funding rate indicator reading fell to -0.9677%, while the price rose 14.71% over the last 4 complete hours. As of 10:06 (UTC), Binance public data showed $1000CAT perpetuals at approximately 0.001866 USDT, with spot and perpetual prices up 21.00% and 14.69%, respectively, over 24 hours.
Perpetual trading volume over these 4 hours expanded to 28.47 times that of the previous window. Quantity-based OI increased 60.47% over the last hour and 102.86% over the 30-point window. Price, volume, and positions all expanded, but the larger gain in spot suggests this is not a simple structure driven solely by one-sided upward pressure from perpetuals.
⚠️ The last complete hour already saw a 3.55% pullback, while trading volume still increased 281.98% from the previous hour. At the same time, the latest actual settled funding rate remains +0.0050%. A deeply negative indicator reading could amplify a squeeze, but it does not prove the rally will continue. Rapid OI expansion could also intensify deleveraging during a reversal.
A breakout above 0.002084 on higher volume over a complete hour, with OI growth stabilizing, would support continuing to watch for further upside. A drop below 0.001791 alongside contracting OI would make guarding against a high-leverage unwind the priority. I would not chase the rally until the structure is confirmed.
* NFA, DYOR
The funding rate indicator reading fell to -0.9677%, while the price rose 14.71% over the last 4 complete hours. As of 10:06 (UTC), Binance public data showed $1000CAT perpetuals at approximately 0.001866 USDT, with spot and perpetual prices up 21.00% and 14.69%, respectively, over 24 hours.
Perpetual trading volume over these 4 hours expanded to 28.47 times that of the previous window. Quantity-based OI increased 60.47% over the last hour and 102.86% over the 30-point window. Price, volume, and positions all expanded, but the larger gain in spot suggests this is not a simple structure driven solely by one-sided upward pressure from perpetuals.
⚠️ The last complete hour already saw a 3.55% pullback, while trading volume still increased 281.98% from the previous hour. At the same time, the latest actual settled funding rate remains +0.0050%. A deeply negative indicator reading could amplify a squeeze, but it does not prove the rally will continue. Rapid OI expansion could also intensify deleveraging during a reversal.
A breakout above 0.002084 on higher volume over a complete hour, with OI growth stabilizing, would support continuing to watch for further upside. A drop below 0.001791 alongside contracting OI would make guarding against a high-leverage unwind the priority. I would not chase the rally until the structure is confirmed.
* NFA, DYOR
Perpetual trading volume over these 4 hours expanded to 28.47 times that of the previous window. Quantity-based OI increased 60.47% over the last hour and 102.86% over the 30-point window. Price, volume, and positions all expanded, but the larger gain in spot suggests this is not a simple structure driven solely by one-sided upward pressure from perpetuals.
⚠️ The last complete hour already saw a 3.55% pullback, while trading volume still increased 281.98% from the previous hour. At the same time, the latest actual settled funding rate remains +0.0050%. A deeply negative indicator reading could amplify a squeeze, but it does not prove the rally will continue. Rapid OI expansion could also intensify deleveraging during a reversal.
A breakout above 0.002084 on higher volume over a complete hour, with OI growth stabilizing, would support continuing to watch for further upside. A drop below 0.001791 alongside contracting OI would make guarding against a high-leverage unwind the priority. I would not chase the rally until the structure is confirmed.
* NFA, DYOR
523
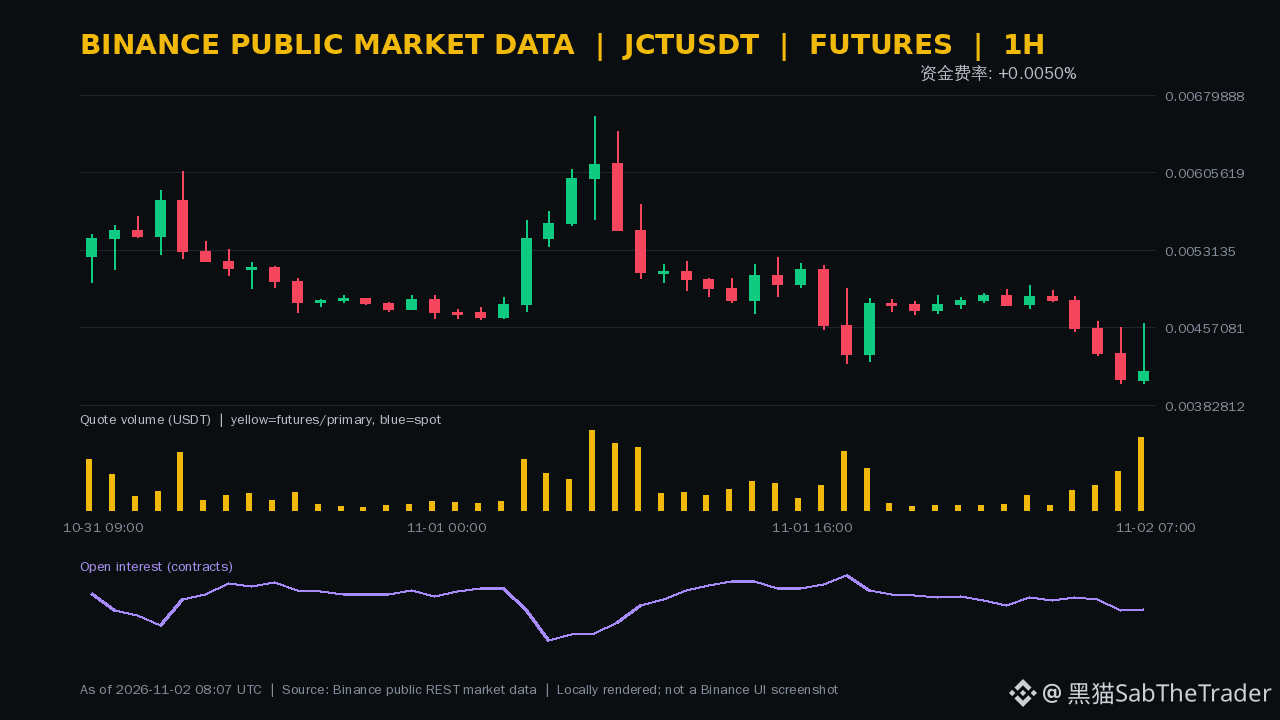
The 24-hour decline widened to 35.29%, with a further 14.25% drop over the last 4 full hours, while trading volume rose to 5.56 times that of the previous window. Public Binance data at 08:07 (UTC) showed $JCT perpetual trading at around 0.004063 USDT, with the market in a zone of sharp short-term declines and high turnover.
The previous full hour saw a 1.97% rebound, and trading volume increased 89.17% from the prior hour. However, OI by contracts rose only 0.03%, while the 30-point window actually declined 1.57%. With prices falling sharply but positions not expanding in tandem, this looks more like a concentrated exit from existing positions. The available data cannot prove that new shorts are persistently in control.
The funding rate indication and the latest settlement were both around +0.0050%, still neutral. JCT also lacks cross-confirmation from Binance spot markets, so the increase in perpetual trading volume alone cannot confirm that selling pressure has ended or that the downtrend will necessarily continue.
⚠️ If a full hourly candle breaks below 0.004014, volume continues to rise, and OI starts expanding, watch out for new leverage joining the downturn. A more credible short-term confirmation that the decline has stalled would require a move back above 0.004613 while OI remains stable. Until the volatility structure is confirmed, I won't chase shorts.
* NFA, DYOR
The 24-hour decline widened to 35.29%, with a further 14.25% drop over the last 4 full hours, while trading volume rose to 5.56 times that of the previous window. Public Binance data at 08:07 (UTC) showed $JCT perpetual trading at around 0.004063 USDT, with the market in a zone of sharp short-term declines and high turnover.
The previous full hour saw a 1.97% rebound, and trading volume increased 89.17% from the prior hour. However, OI by contracts rose only 0.03%, while the 30-point window actually declined 1.57%. With prices falling sharply but positions not expanding in tandem, this looks more like a concentrated exit from existing positions. The available data cannot prove that new shorts are persistently in control.
The funding rate indication and the latest settlement were both around +0.0050%, still neutral. JCT also lacks cross-confirmation from Binance spot markets, so the increase in perpetual trading volume alone cannot confirm that selling pressure has ended or that the downtrend will necessarily continue.
⚠️ If a full hourly candle breaks below 0.004014, volume continues to rise, and OI starts expanding, watch out for new leverage joining the downturn. A more credible short-term confirmation that the decline has stalled would require a move back above 0.004613 while OI remains stable. Until the volatility structure is confirmed, I won't chase shorts.
* NFA, DYOR
The previous full hour saw a 1.97% rebound, and trading volume increased 89.17% from the prior hour. However, OI by contracts rose only 0.03%, while the 30-point window actually declined 1.57%. With prices falling sharply but positions not expanding in tandem, this looks more like a concentrated exit from existing positions. The available data cannot prove that new shorts are persistently in control.
The funding rate indication and the latest settlement were both around +0.0050%, still neutral. JCT also lacks cross-confirmation from Binance spot markets, so the increase in perpetual trading volume alone cannot confirm that selling pressure has ended or that the downtrend will necessarily continue.
⚠️ If a full hourly candle breaks below 0.004014, volume continues to rise, and OI starts expanding, watch out for new leverage joining the downturn. A more credible short-term confirmation that the decline has stalled would require a move back above 0.004613 while OI remains stable. Until the volatility structure is confirmed, I won't chase shorts.
* NFA, DYOR
380
Log in to explore more content
Join global crypto users on Binance Square
⚡️ Get latest and useful information about crypto.
💬 Trusted by the world’s largest crypto exchange.
👍 Discover real insights from verified creators.
Email / Phone number
Trending Topics
BinanceIncidentReport
79,319 views
750 Discussing
29 October 2026 Binance Security Incident: Initial Findings and Response Update
Binance Blog
·400 Likes
·1.2M views
BinanceReopensWithdrawalsForMoreAssets
209,393 views
1,900 Discussing
BinanceHourlyDepositsExceedWithdrawals
95,640 views
902 Discussing