
Mek
917 Posts

Mek
Report
Block User
Trader Institutional & Analyst since 2018 · Binance KOL & BNBChain Martian. Building at Web3 and Sovereign Infrastructure.
Frequent Trader
5.3 Years
41 Following
2.8K+ Followers
1.7K+ Liked
Posts
All
Quotes
Videos
Live
PINNED
·
--

Article
I Gave Claude One Job: Read the Order Book Like an InstitutionThe five-tab problem every serious trader knows
Before I size a position, I run the same routine every time. Binance for the order book and open interest. A second tab for funding rate history. A third for long/short positioning. A fourth for ETF flow data, because that never lives on an exchange. A fifth if a filing from a company like Strategy dropped that week and moved the tape.
None of this is complicated. It is just scattered. And scattered means slow, sizing a position on a five-minute-old picture instead of a live one.
Binance Agent OS made a specific claim: connect an AI agent directly to Binance's trading and market data, under permissions you control, from inside the tools you already use. I wanted to know if it could actually collapse my five-tab routine into one conversation, with no loss of precision on the numbers that decide position size.
I tested it live, on my own account, this week. What I found is the closest thing to a genuine unlock I have seen in this space in a while — and I think most traders reading this should be setting it up today, not eventually.
Setup took less time than my coffee
The documentation points you toward Claude Code. I tried that first and hit a wall, no active paid setup configured, and I was not going to spin one up just to test a data connection.
The real path was faster than the documented one. Claude.ai supports custom connectors on the free plan, no terminal required. Settings → Connectors → Add custom connector, paste Binance's MCP endpoint into the URL field, authenticate through Binance's own OAuth screen. Two minutes, from a browser tab, done.
Two things on Binance's side, separate from the Claude connection: I opened and manually funded the Agentic sub-account (Profile → Dashboard → Sub-account → Asset Management → Transfer. The agent cannot pull funds there by itself), then set permissions deliberately conservative for the first run: market data plus account read, no trade execution yet. I wanted to see what it could show me before I let it touch anything.
If you have ever configured an API key manually, this is dramatically less friction than that.
What happened when I actually asked it something
Close to the literal prompt I ran:
"Pull the BTCUSDT order book, current open interest and its trend over the last six hours, recent funding rate history, and long/short account ratio. Then check my account balance so I can see live exposure alongside the market read."
The order book came back live, not delayed: a bid of $78,411.10 with 14.464 BTC sitting right at the top of the book, ask at $78,411.20, a genuinely tight spread with real size resting at the touch. That alone replaced a tab I open a dozen times a day.
Open interest sat at 107,141 BTC, roughly $8.4B notional. Pulling the trailing six-hour series showed it actually declining, from about 108,987 BTC down to 107,362, while funding rate over the same window climbed modestly, from roughly 0.00003 to 0.00009, and the long/short account ratio held at 1.28–1.32, around 56–57% net long.
That is a more precise read than the headline "everyone is long" story: leverage building modestly on funding while some positions were quietly closing on the open interest side. I would not have caught that nuance glancing at one number. The agent pulled the full set in one pass.
Then I asked it to check my balance. It came back empty. My first thought was that something had broken. It had not, the Agentic sub-account starts genuinely isolated, no access to my main holdings, until I move funds in myself. The agent cannot see or touch capital I have not explicitly placed within its reach.
That is the detail that sold me on the security model. Not the permissions page copy, watching it actually enforced, in real time, on my own account.
Where it already earns its place - and where it is about to get even better
Binance's MCP server currently covers trading and market data, which is exactly the half of my routine that used to eat the most clicks. For the macro side, I ran a live search alongside it: U.S. spot Bitcoin ETFs had just logged +$986.9M for the week, BlackRock's IBIT leading with roughly $691.5M, September 3 alone bringing in $730.9M, the strongest single day since mid-January. Strategy had just ended a ten-week pause with a $370M purchase in late August.
Laid next to the live exchange data, the picture sharpens fast: fresh institutional demand arriving through ETFs while exchange-side leverage stayed comparatively restrained. Two data sets, one conversation, a few seconds apart.
Binance has already flagged on-chain and payment capabilities as next on the MCP roadmap. If institutional flow data lands on that same roadmap, this stops being "one strong half of my workflow" and becomes the whole thing, in one place. I would rather be early to that than catch up later.
Why I am recommending this today, not eventually
Here is my honest verdict after actually running it: the exchange-side leg, order book, open interest, funding, long/short, is faster and more precise than clicking through Binance's own UI for the same four numbers, live and under your own permissions, set up in less time than it takes to make coffee. The sub-account isolation is real security, not a marketing line, and I watched it work against my own account before I trusted it.
If you trade on Binance and you are still checking these numbers one tab at a time, you are working harder than you need to. This is the first AI integration I have tested this year that actually removed steps from my routine instead of adding a new dashboard to check.
Set it up, connect your own account, and go find your own use case, this is exactly the kind of product that gets better the more people push on it in public.
Access Binance Agent OS: [https://www.binance.com/en/agent-os](https://www.binance.com/en/agent-os)
#Binance #AgentOS
I Gave Claude One Job: Read the Order Book Like an Institution
The five-tab problem every serious trader knows
Before I size a position, I run the same routine every time. Binance for the order book and open interest. A second tab for funding rate history. A third for long/short positioning. A fourth for ETF flow data, because that never lives on an exchange. A fifth if a filing from a company like Strategy dropped that week and moved the tape.
None of this is complicated. It is just scattered. And scattered means slow, sizing a position on a five-minute-old picture instead of a live one.
Binance Agent OS made a specific claim: connect an AI agent directly to Binance's trading and market data, under permissions you control, from inside the tools you already use. I wanted to know if it could actually collapse my five-tab routine into one conversation, with no loss of precision on the numbers that decide position size.
I tested it live, on my own account, this week. What I found is the closest thing to a genuine unlock I have seen in this space in a while — and I think most traders reading this should be setting it up today, not eventually.
Setup took less time than my coffee
The documentation points you toward Claude Code. I tried that first and hit a wall, no active paid setup configured, and I was not going to spin one up just to test a data connection.
The real path was faster than the documented one. Claude.ai supports custom connectors on the free plan, no terminal required. Settings → Connectors → Add custom connector, paste Binance's MCP endpoint into the URL field, authenticate through Binance's own OAuth screen. Two minutes, from a browser tab, done.
Two things on Binance's side, separate from the Claude connection: I opened and manually funded the Agentic sub-account (Profile → Dashboard → Sub-account → Asset Management → Transfer. The agent cannot pull funds there by itself), then set permissions deliberately conservative for the first run: market data plus account read, no trade execution yet. I wanted to see what it could show me before I let it touch anything.
If you have ever configured an API key manually, this is dramatically less friction than that.
What happened when I actually asked it something
Close to the literal prompt I ran:
"Pull the BTCUSDT order book, current open interest and its trend over the last six hours, recent funding rate history, and long/short account ratio. Then check my account balance so I can see live exposure alongside the market read."
The order book came back live, not delayed: a bid of $78,411.10 with 14.464 BTC sitting right at the top of the book, ask at $78,411.20, a genuinely tight spread with real size resting at the touch. That alone replaced a tab I open a dozen times a day.
Open interest sat at 107,141 BTC, roughly $8.4B notional. Pulling the trailing six-hour series showed it actually declining, from about 108,987 BTC down to 107,362, while funding rate over the same window climbed modestly, from roughly 0.00003 to 0.00009, and the long/short account ratio held at 1.28–1.32, around 56–57% net long.
That is a more precise read than the headline "everyone is long" story: leverage building modestly on funding while some positions were quietly closing on the open interest side. I would not have caught that nuance glancing at one number. The agent pulled the full set in one pass.
Then I asked it to check my balance. It came back empty. My first thought was that something had broken. It had not, the Agentic sub-account starts genuinely isolated, no access to my main holdings, until I move funds in myself. The agent cannot see or touch capital I have not explicitly placed within its reach.
That is the detail that sold me on the security model. Not the permissions page copy, watching it actually enforced, in real time, on my own account.
Where it already earns its place - and where it is about to get even better
Binance's MCP server currently covers trading and market data, which is exactly the half of my routine that used to eat the most clicks. For the macro side, I ran a live search alongside it: U.S. spot Bitcoin ETFs had just logged +$986.9M for the week, BlackRock's IBIT leading with roughly $691.5M, September 3 alone bringing in $730.9M, the strongest single day since mid-January. Strategy had just ended a ten-week pause with a $370M purchase in late August.
Laid next to the live exchange data, the picture sharpens fast: fresh institutional demand arriving through ETFs while exchange-side leverage stayed comparatively restrained. Two data sets, one conversation, a few seconds apart.
Binance has already flagged on-chain and payment capabilities as next on the MCP roadmap. If institutional flow data lands on that same roadmap, this stops being "one strong half of my workflow" and becomes the whole thing, in one place. I would rather be early to that than catch up later.
Why I am recommending this today, not eventually
Here is my honest verdict after actually running it: the exchange-side leg, order book, open interest, funding, long/short, is faster and more precise than clicking through Binance's own UI for the same four numbers, live and under your own permissions, set up in less time than it takes to make coffee. The sub-account isolation is real security, not a marketing line, and I watched it work against my own account before I trusted it.
If you trade on Binance and you are still checking these numbers one tab at a time, you are working harder than you need to. This is the first AI integration I have tested this year that actually removed steps from my routine instead of adding a new dashboard to check.
Set it up, connect your own account, and go find your own use case, this is exactly the kind of product that gets better the more people push on it in public.
Access Binance Agent OS: https://www.binance.com/en/agent-os
#Binance #AgentOS
Before I size a position, I run the same routine every time. Binance for the order book and open interest. A second tab for funding rate history. A third for long/short positioning. A fourth for ETF flow data, because that never lives on an exchange. A fifth if a filing from a company like Strategy dropped that week and moved the tape.
None of this is complicated. It is just scattered. And scattered means slow, sizing a position on a five-minute-old picture instead of a live one.
Binance Agent OS made a specific claim: connect an AI agent directly to Binance's trading and market data, under permissions you control, from inside the tools you already use. I wanted to know if it could actually collapse my five-tab routine into one conversation, with no loss of precision on the numbers that decide position size.
I tested it live, on my own account, this week. What I found is the closest thing to a genuine unlock I have seen in this space in a while — and I think most traders reading this should be setting it up today, not eventually.
Setup took less time than my coffee
The documentation points you toward Claude Code. I tried that first and hit a wall, no active paid setup configured, and I was not going to spin one up just to test a data connection.
The real path was faster than the documented one. Claude.ai supports custom connectors on the free plan, no terminal required. Settings → Connectors → Add custom connector, paste Binance's MCP endpoint into the URL field, authenticate through Binance's own OAuth screen. Two minutes, from a browser tab, done.
Two things on Binance's side, separate from the Claude connection: I opened and manually funded the Agentic sub-account (Profile → Dashboard → Sub-account → Asset Management → Transfer. The agent cannot pull funds there by itself), then set permissions deliberately conservative for the first run: market data plus account read, no trade execution yet. I wanted to see what it could show me before I let it touch anything.
If you have ever configured an API key manually, this is dramatically less friction than that.
What happened when I actually asked it something
Close to the literal prompt I ran:
"Pull the BTCUSDT order book, current open interest and its trend over the last six hours, recent funding rate history, and long/short account ratio. Then check my account balance so I can see live exposure alongside the market read."
The order book came back live, not delayed: a bid of $78,411.10 with 14.464 BTC sitting right at the top of the book, ask at $78,411.20, a genuinely tight spread with real size resting at the touch. That alone replaced a tab I open a dozen times a day.
Open interest sat at 107,141 BTC, roughly $8.4B notional. Pulling the trailing six-hour series showed it actually declining, from about 108,987 BTC down to 107,362, while funding rate over the same window climbed modestly, from roughly 0.00003 to 0.00009, and the long/short account ratio held at 1.28–1.32, around 56–57% net long.
That is a more precise read than the headline "everyone is long" story: leverage building modestly on funding while some positions were quietly closing on the open interest side. I would not have caught that nuance glancing at one number. The agent pulled the full set in one pass.
Then I asked it to check my balance. It came back empty. My first thought was that something had broken. It had not, the Agentic sub-account starts genuinely isolated, no access to my main holdings, until I move funds in myself. The agent cannot see or touch capital I have not explicitly placed within its reach.
That is the detail that sold me on the security model. Not the permissions page copy, watching it actually enforced, in real time, on my own account.
Where it already earns its place - and where it is about to get even better
Binance's MCP server currently covers trading and market data, which is exactly the half of my routine that used to eat the most clicks. For the macro side, I ran a live search alongside it: U.S. spot Bitcoin ETFs had just logged +$986.9M for the week, BlackRock's IBIT leading with roughly $691.5M, September 3 alone bringing in $730.9M, the strongest single day since mid-January. Strategy had just ended a ten-week pause with a $370M purchase in late August.
Laid next to the live exchange data, the picture sharpens fast: fresh institutional demand arriving through ETFs while exchange-side leverage stayed comparatively restrained. Two data sets, one conversation, a few seconds apart.
Binance has already flagged on-chain and payment capabilities as next on the MCP roadmap. If institutional flow data lands on that same roadmap, this stops being "one strong half of my workflow" and becomes the whole thing, in one place. I would rather be early to that than catch up later.
Why I am recommending this today, not eventually
Here is my honest verdict after actually running it: the exchange-side leg, order book, open interest, funding, long/short, is faster and more precise than clicking through Binance's own UI for the same four numbers, live and under your own permissions, set up in less time than it takes to make coffee. The sub-account isolation is real security, not a marketing line, and I watched it work against my own account before I trusted it.
If you trade on Binance and you are still checking these numbers one tab at a time, you are working harder than you need to. This is the first AI integration I have tested this year that actually removed steps from my routine instead of adding a new dashboard to check.
Set it up, connect your own account, and go find your own use case, this is exactly the kind of product that gets better the more people push on it in public.
Access Binance Agent OS: https://www.binance.com/en/agent-os
#Binance #AgentOS
BTC-0.15%
IBITETF+0.36%
1
199
·
--
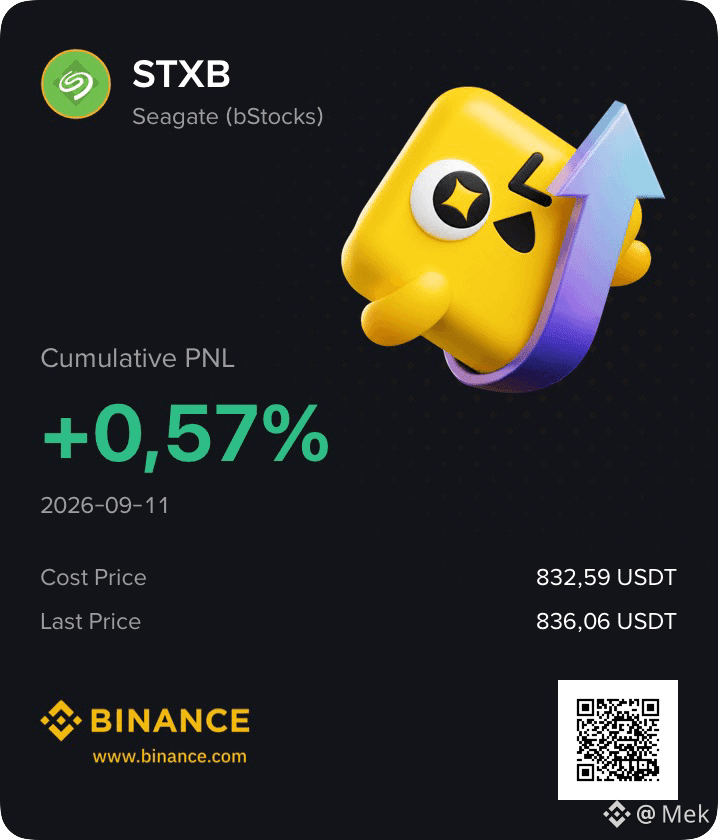
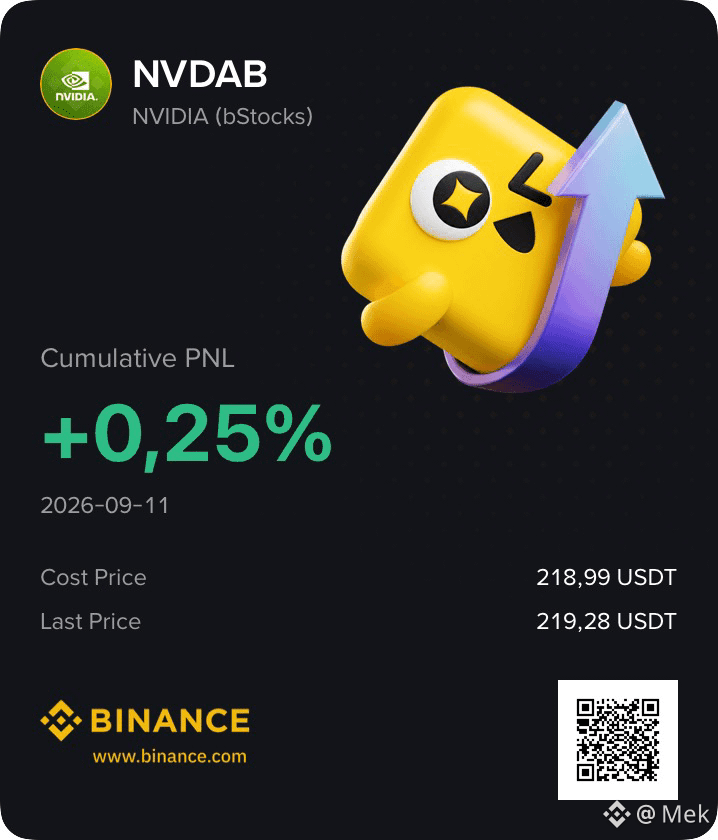
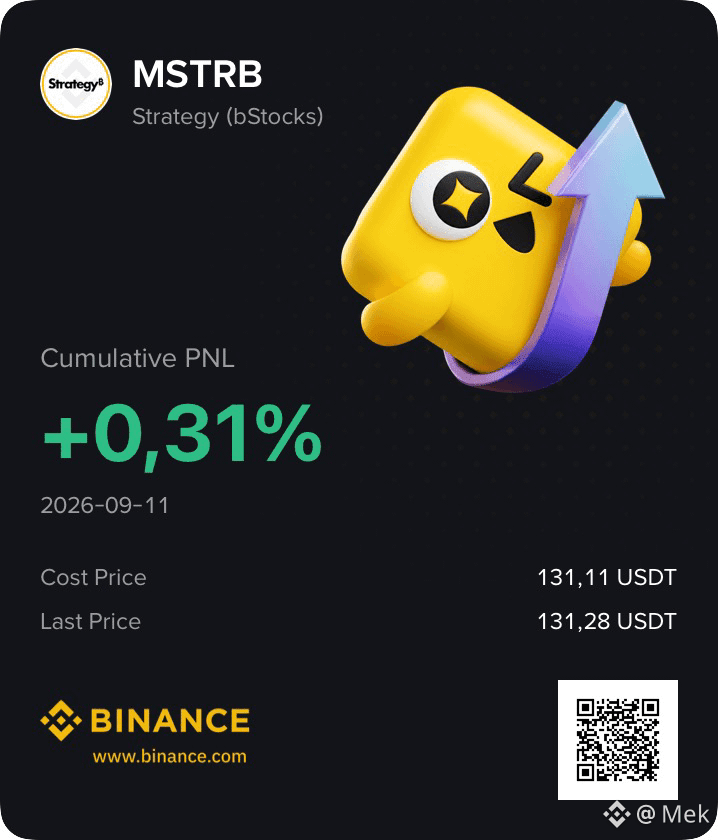
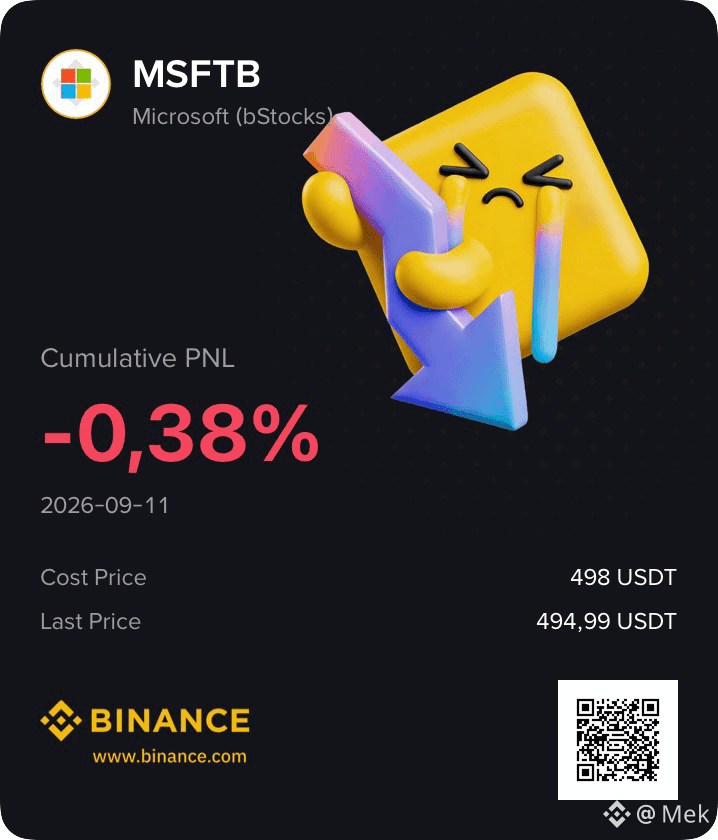
My weekly investments in DCA in bStocks, Binance is really making this investment easier right in the palm of our hand.
HODL, not financial advice.
{spot}(NVDABUSDT)
{spot}(STXBUSDT)
{spot}(MSTRBUSDT)
My weekly investments in DCA in bStocks, Binance is really making this investment easier right in the palm of our hand.
HODL, not financial advice.
HODL, not financial advice.
1
122
·
--

Article
US equities just closed at record highs. Bitcoin is still working its way back from October's peak.Same macro backdrop. Two completely different stories.
I built a three-asset [bStocks](https://www.binance.com/en/bstocks-landing) portfolio that trades both sides of that divergence.
The allocation:
40% NVDAB (Nvidia)35% MSTRB (Strategy)25% CRCLB (Circle)
Not a diversified basket. A thesis on where capital is actually moving this cycle.
1. NVDAB, 40%.
Nvidia just moved to acquire Hugging Face for roughly $13 billion. Data center capex keeps compounding, not slowing. This is the infrastructure position, the closest thing to owning the AI buildout itself.
2. MSTRB, 35%.
Strategy is the closest thing traditional markets offer to leveraged Bitcoin exposure inside an equity wrapper. I already hold BTC directly. This is the bridge position, same conviction, different rail, tradable 24/7 alongside the rest of my book.
3. CRCLB, 25%.
Circle sits at the center of stablecoin infrastructure. That capital pool is sitting near record size, waiting on the sidelines. Owning the rails that move that liquidity is a different bet than owning what it eventually buys.
Why bStocks and not the underlying shares.
Fractional access from around $5. On-chain settlement in under a second. Self-custody to a BNB Chain wallet if I want it. Same portfolio logic I already apply to crypto, extended to equities. No separate broker, no market hours.
Over half of bStocks volume already happens while U.S. markets are closed, according to Binance Research. The 24/7 structure isn't a gimmick. It's the point.
100% to allocate. Three bStocks. That's the challenge.
Mine leans into AI infrastructure, Bitcoin's equity bridge, and stablecoin rails.
What's yours. Build it, post it, reply below.
My allocation, not financial advice.
{spot}(NVDABUSDT)
{spot}(MSTRBUSDT)
{spot}(CRCLBUSDT)
US equities just closed at record highs. Bitcoin is still working its way back from October's peak.
Same macro backdrop. Two completely different stories.
I built a three-asset bStocks portfolio that trades both sides of that divergence.
The allocation:
40% NVDAB (Nvidia)35% MSTRB (Strategy)25% CRCLB (Circle)
Not a diversified basket. A thesis on where capital is actually moving this cycle.
1. NVDAB, 40%.
Nvidia just moved to acquire Hugging Face for roughly $13 billion. Data center capex keeps compounding, not slowing. This is the infrastructure position, the closest thing to owning the AI buildout itself.
2. MSTRB, 35%.
Strategy is the closest thing traditional markets offer to leveraged Bitcoin exposure inside an equity wrapper. I already hold BTC directly. This is the bridge position, same conviction, different rail, tradable 24/7 alongside the rest of my book.
3. CRCLB, 25%.
Circle sits at the center of stablecoin infrastructure. That capital pool is sitting near record size, waiting on the sidelines. Owning the rails that move that liquidity is a different bet than owning what it eventually buys.
Why bStocks and not the underlying shares.
Fractional access from around $5. On-chain settlement in under a second. Self-custody to a BNB Chain wallet if I want it. Same portfolio logic I already apply to crypto, extended to equities. No separate broker, no market hours.
Over half of bStocks volume already happens while U.S. markets are closed, according to Binance Research. The 24/7 structure isn't a gimmick. It's the point.
100% to allocate. Three bStocks. That's the challenge.
Mine leans into AI infrastructure, Bitcoin's equity bridge, and stablecoin rails.
What's yours. Build it, post it, reply below.
My allocation, not financial advice.
I built a three-asset bStocks portfolio that trades both sides of that divergence.
The allocation:
40% NVDAB (Nvidia)35% MSTRB (Strategy)25% CRCLB (Circle)
Not a diversified basket. A thesis on where capital is actually moving this cycle.
1. NVDAB, 40%.
Nvidia just moved to acquire Hugging Face for roughly $13 billion. Data center capex keeps compounding, not slowing. This is the infrastructure position, the closest thing to owning the AI buildout itself.
2. MSTRB, 35%.
Strategy is the closest thing traditional markets offer to leveraged Bitcoin exposure inside an equity wrapper. I already hold BTC directly. This is the bridge position, same conviction, different rail, tradable 24/7 alongside the rest of my book.
3. CRCLB, 25%.
Circle sits at the center of stablecoin infrastructure. That capital pool is sitting near record size, waiting on the sidelines. Owning the rails that move that liquidity is a different bet than owning what it eventually buys.
Why bStocks and not the underlying shares.
Fractional access from around $5. On-chain settlement in under a second. Self-custody to a BNB Chain wallet if I want it. Same portfolio logic I already apply to crypto, extended to equities. No separate broker, no market hours.
Over half of bStocks volume already happens while U.S. markets are closed, according to Binance Research. The 24/7 structure isn't a gimmick. It's the point.
100% to allocate. Three bStocks. That's the challenge.
Mine leans into AI infrastructure, Bitcoin's equity bridge, and stablecoin rails.
What's yours. Build it, post it, reply below.
My allocation, not financial advice.
1
52
·
--
Partly True

Article
Here’s an article about U.S. inflation and my take on the next FOMC.The inflation data that made the market start repricing rate hikes in September was, for the most part, its phone bill.
I'm not being ironic. The core of the U.S. CPI rose 0.29% in August.
Mobile telephony and lodging accounted for 14 of those 29 basis points.
All the rest of the American economy, taken together, came to about 15.
Two of the noisiest categories in the index did half the work on their own.
In the supercore it was worse. Up 0.51% over the month, with 29 basis points coming only from telephony. More than half of a single item.
Here’s an article about U.S. inflation and my take on the next FOMC.
The inflation data that made the market start repricing rate hikes in September was, for the most part, its phone bill.
I'm not being ironic. The core of the U.S. CPI rose 0.29% in August.
Mobile telephony and lodging accounted for 14 of those 29 basis points.
All the rest of the American economy, taken together, came to about 15.
Two of the noisiest categories in the index did half the work on their own.
In the supercore it was worse. Up 0.51% over the month, with 29 basis points coming only from telephony. More than half of a single item.
I'm not being ironic. The core of the U.S. CPI rose 0.29% in August.
Mobile telephony and lodging accounted for 14 of those 29 basis points.
All the rest of the American economy, taken together, came to about 15.
Two of the noisiest categories in the index did half the work on their own.
In the supercore it was worse. Up 0.51% over the month, with 29 basis points coming only from telephony. More than half of a single item.
1
833
·
--
🎙️ 📈 Trading & Coffee - Institutional Analysis (Pt-BR)

End
01 h 11 m 34 s
44
ETHUSDT
Perp
Market/Long
3
0
·
--
Verified
The US CPI for August came out at 3.4% year-over-year over the past 12 months, in line with expectations and the same as the previous month. 🚨
Core CPI fell to 2.4%, also in line, down from 2.5%.
On the monthly change, headline CPI rose 0.4%. Biggest monthly increase since May 2026.
Note that the core trend is still DECELERATION.
Even with the doomers saying there would now be a new upswing in inflation. Always remember to understand the data, not just Twitter narratives.
Overall, the numbers are pretty neutral. It should increase the market’s uncertainty about interest rates, and the real effect will be the middle path.
In other words, rates unchanged. I’ll bring an analysis on this later. #CPIWatch
The US CPI for August came out at 3.4% year-over-year over the past 12 months, in line with expectations and the same as the previous month. 🚨
Core CPI fell to 2.4%, also in line, down from 2.5%.
On the monthly change, headline CPI rose 0.4%. Biggest monthly increase since May 2026.
Note that the core trend is still DECELERATION.
Even with the doomers saying there would now be a new upswing in inflation. Always remember to understand the data, not just Twitter narratives.
Overall, the numbers are pretty neutral. It should increase the market’s uncertainty about interest rates, and the real effect will be the middle path.
In other words, rates unchanged. I’ll bring an analysis on this later. #CPIWatch
Core CPI fell to 2.4%, also in line, down from 2.5%.
On the monthly change, headline CPI rose 0.4%. Biggest monthly increase since May 2026.
Note that the core trend is still DECELERATION.
Even with the doomers saying there would now be a new upswing in inflation. Always remember to understand the data, not just Twitter narratives.
Overall, the numbers are pretty neutral. It should increase the market’s uncertainty about interest rates, and the real effect will be the middle path.
In other words, rates unchanged. I’ll bring an analysis on this later. #CPIWatch

2
2
1.5k
·
--
Bullish
Retail sold early in 2023. And it seems to be doing exactly the same thing now. 🔥
The realized profit momentum from short-term investors has surged to the highest peak since the beginning of 2024.
Anyone who bought bitcoin in recent months rushed to sell when the price neared ~US$ 79 thousand.
This has happened before, and in the same way.
January 2023. Bitcoin leaving US$ 16 thousand, with the FTX corpse still on the ground.
The same indicator exploded. Retail handed over coins on the first decent rally, convinced it was a bear market bounce.
A little more than two years later, the price was at US$ 120 thousand.
Will we see something similar again now?
{future}(BTCUSDT)
Retail sold early in 2023. And it seems to be doing exactly the same thing now. 🔥
The realized profit momentum from short-term investors has surged to the highest peak since the beginning of 2024.
Anyone who bought bitcoin in recent months rushed to sell when the price neared ~US$ 79 thousand.
This has happened before, and in the same way.
January 2023. Bitcoin leaving US$ 16 thousand, with the FTX corpse still on the ground.
The same indicator exploded. Retail handed over coins on the first decent rally, convinced it was a bear market bounce.
A little more than two years later, the price was at US$ 120 thousand.
Will we see something similar again now?
The realized profit momentum from short-term investors has surged to the highest peak since the beginning of 2024.
Anyone who bought bitcoin in recent months rushed to sell when the price neared ~US$ 79 thousand.
This has happened before, and in the same way.
January 2023. Bitcoin leaving US$ 16 thousand, with the FTX corpse still on the ground.
The same indicator exploded. Retail handed over coins on the first decent rally, convinced it was a bear market bounce.
A little more than two years later, the price was at US$ 120 thousand.
Will we see something similar again now?

1
780
·
--
Verified
The global commodities index is up 30% since the end of February and is at its highest level in 18 years.🚨
It’s only 10% below the 2008 record. And it’s not just energy.
International oil is more than 30% above Iran’s pre-war level.
European and Asian natural gas has more than doubled. Copper hit a 7-month high.
The easy reading here would be to say that this forces the Fed to raise interest rates. But interest rates don’t fix a logistics chain broken by war.
A supply shock doesn’t respond to monetary policy—it only shows up in the index and disappears when supply normalizes.
And there’s a detail that almost nobody is considering.
The cost of capital is already high on its own, with the 30-year yield near the highest since 2007.
The long-end curve is already doing the tightening the Fed would have to do.
Rates are not going to fall now, but the room to rise is getting more and more limited. Higher for longer.
The global commodities index is up 30% since the end of February and is at its highest level in 18 years.🚨
It’s only 10% below the 2008 record. And it’s not just energy.
International oil is more than 30% above Iran’s pre-war level.
European and Asian natural gas has more than doubled. Copper hit a 7-month high.
The easy reading here would be to say that this forces the Fed to raise interest rates. But interest rates don’t fix a logistics chain broken by war.
A supply shock doesn’t respond to monetary policy—it only shows up in the index and disappears when supply normalizes.
And there’s a detail that almost nobody is considering.
The cost of capital is already high on its own, with the 30-year yield near the highest since 2007.
The long-end curve is already doing the tightening the Fed would have to do.
Rates are not going to fall now, but the room to rise is getting more and more limited. Higher for longer.
It’s only 10% below the 2008 record. And it’s not just energy.
International oil is more than 30% above Iran’s pre-war level.
European and Asian natural gas has more than doubled. Copper hit a 7-month high.
The easy reading here would be to say that this forces the Fed to raise interest rates. But interest rates don’t fix a logistics chain broken by war.
A supply shock doesn’t respond to monetary policy—it only shows up in the index and disappears when supply normalizes.
And there’s a detail that almost nobody is considering.
The cost of capital is already high on its own, with the 30-year yield near the highest since 2007.
The long-end curve is already doing the tightening the Fed would have to do.
Rates are not going to fall now, but the room to rise is getting more and more limited. Higher for longer.

1
1.3k
·
--
Bearish
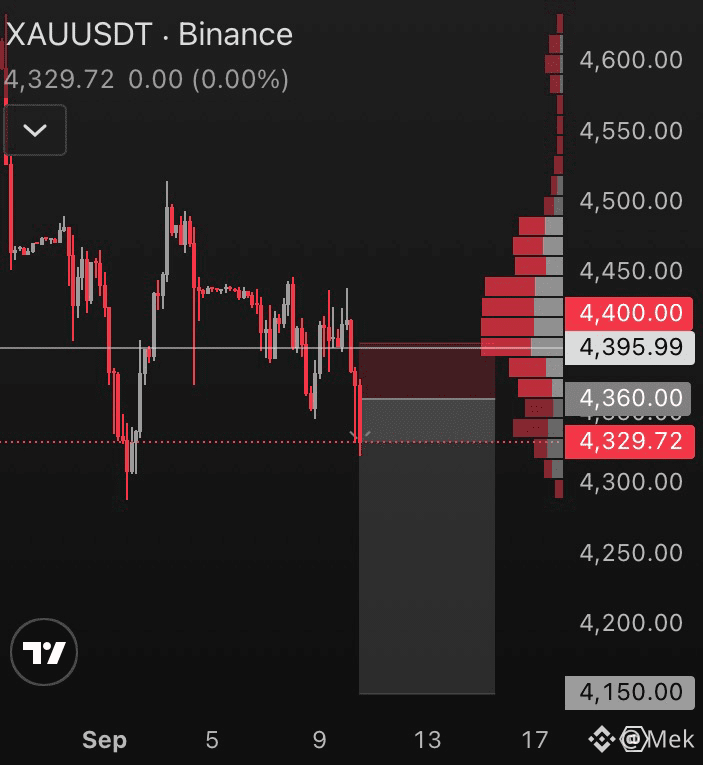
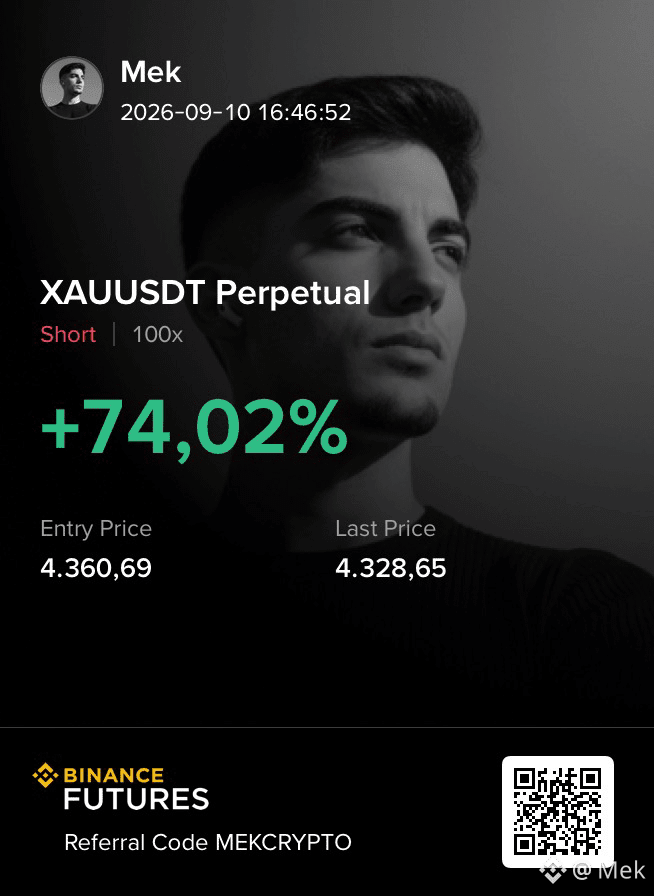
I notified about the fall of $XAU at the moment I opened the operation.
+ 74% profit in a few hours..
Now, following the management I mentioned in the other post, I’m positioning my SL in profit, in the US$ 4350.0 area. It’s the famous break-even!
So this operation is profit or profit, I’ll keep surfing and moving my stop lower as gold drops.
{future}(XAUUSDT)
I notified about the fall of $XAU at the moment I opened the operation.
+ 74% profit in a few hours..
Now, following the management I mentioned in the other post, I’m positioning my SL in profit, in the US$ 4350.0 area. It’s the famous break-even!
So this operation is profit or profit, I’ll keep surfing and moving my stop lower as gold drops.
+ 74% profit in a few hours..
Now, following the management I mentioned in the other post, I’m positioning my SL in profit, in the US$ 4350.0 area. It’s the famous break-even!
So this operation is profit or profit, I’ll keep surfing and moving my stop lower as gold drops.
Mek
·
--
My strategy for this short in $XAU ..
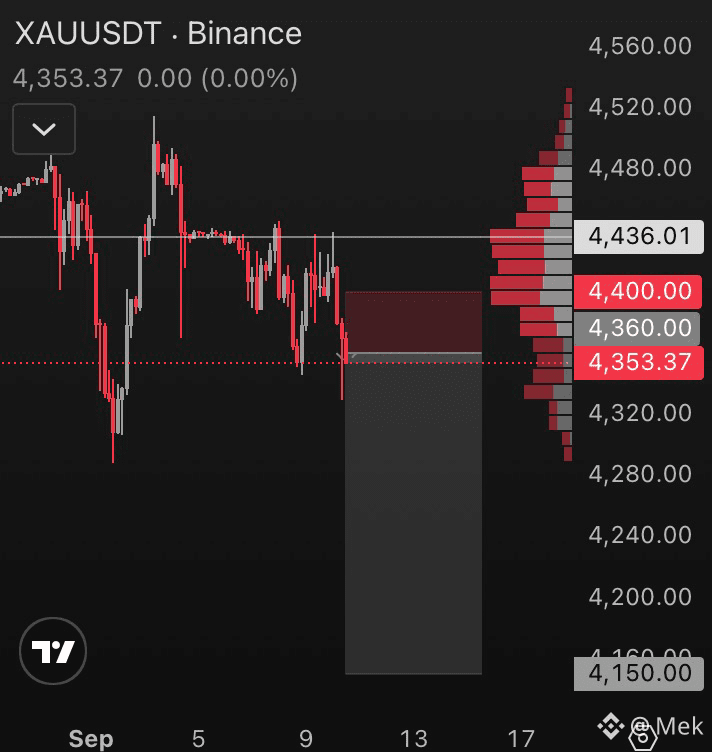
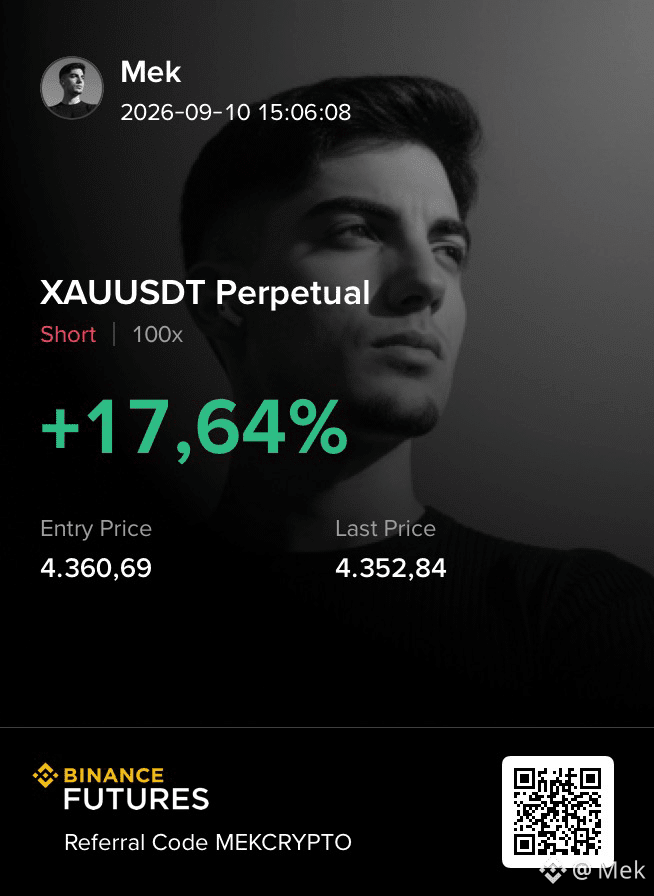
I opened the trade for US$ 4360.0, placed a low-risk stop at US$ 4400.0, and my take profit is based on liquidity of US$ 4150.0.
Already riding +17% profit at the moment, when it reaches +50% I will do break-even and protect my stop from $XAU at the entry point / 10% profit.
That way I eliminate my risk—if the market goes back, I exit with a small profit; if it keeps going, I capture a bigger profit at my take.
I opened the trade for US$ 4360.0, placed a low-risk stop at US$ 4400.0, and my take profit is based on liquidity of US$ 4150.0.
Already riding +17% profit at the moment, when it reaches +50% I will do break-even and protect my stop from $XAU at the entry point / 10% profit.
That way I eliminate my risk—if the market goes back, I exit with a small profit; if it keeps going, I capture a bigger profit at my take.
1
23
·
--
Verified
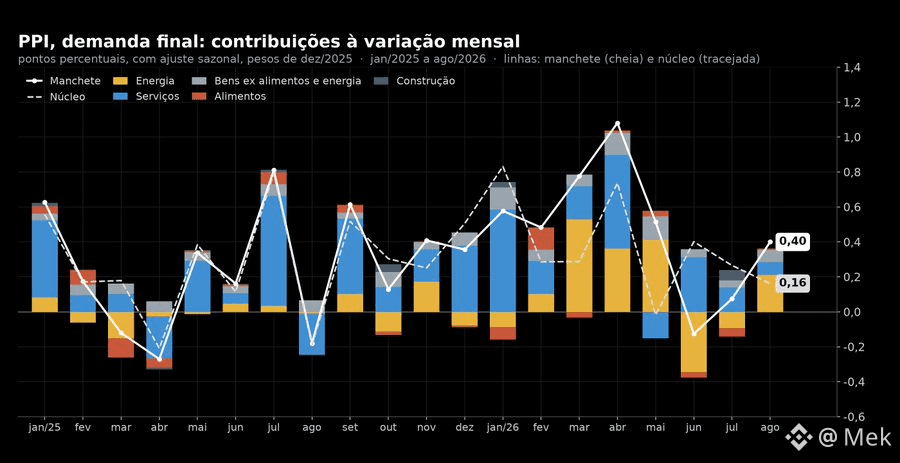
The PPI has three readings. The full PPI is the index of final demand, at 5.4% in the headlines. The core PPI excludes food and energy; it’s what appears on-screen as “Core PPI” and what the consensus is targeting. The core PPI ex margins excludes, in addition to food and energy, wholesale and retail margins; the official name is “final demand less foods, energy, and trade services”, and it’s the line the BLS highlights in the release, because trade margin is the most volatile component of the index. I will consider “core” to be the second one and “core ex margins” to be the third.
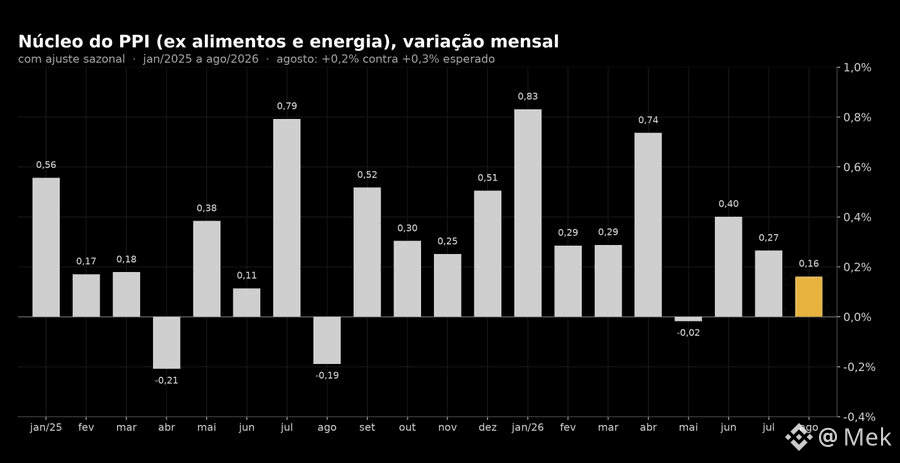
In August, core and core ex margins did not tell the same story. Core rose 0.16% versus 0.3% expected, the third month in a row of deceleration: 0.40 in June, 0.27 in July, and 0.16 now. Core ex margins rose 0.27%, in line with consensus of 0.3%, after 0.4% in July. The difference between the two lies in the trade margin, which fell 0.2% in the month and took about 0.04 of a point off core. The fuel retail margin collapsed 11.3%, and this is mechanical: when fuel rises at wholesale, retail takes time to pass it through, so the margin shrinks before it recomposes. Over twelve months, 4.6% in core, as expected, and 4.7% in core ex margins, unchanged from July. The 4.6% came from 4.3% due to base arithmetic: the −0.2% from August 2025 left the window and the +0.16% from August 2026 entered. The peak was 4.9% in April.
The same applies to the acceleration headline that the full PPI gained today. Over twelve months it went from 4.8% to 5.4%, but August 2025 had been −0.2% and August 2026 was +0.4%; swapping a negative month for a positive one accounts for the full 0.6 percentage points. The monthly pace of 0.4% was in line with/under the average monthly pace from the last year (0.44%).
In other words, today’s reading did not bring acceleration (only energy, for obvious reasons). Core has been decelerating for three months, core ex margins came in at consensus, and the full PPI’s 5.4% is a base swap: a −0.2 that exited and a +0.4 that entered.
The PPI has three readings. The full PPI is the index of final demand, at 5.4% in the headlines. The core PPI excludes food and energy; it’s what appears on-screen as “Core PPI” and what the consensus is targeting. The core PPI ex margins excludes, in addition to food and energy, wholesale and retail margins; the official name is “final demand less foods, energy, and trade services”, and it’s the line the BLS highlights in the release, because trade margin is the most volatile component of the index. I will consider “core” to be the second one and “core ex margins” to be the third.
In August, core and core ex margins did not tell the same story. Core rose 0.16% versus 0.3% expected, the third month in a row of deceleration: 0.40 in June, 0.27 in July, and 0.16 now. Core ex margins rose 0.27%, in line with consensus of 0.3%, after 0.4% in July. The difference between the two lies in the trade margin, which fell 0.2% in the month and took about 0.04 of a point off core. The fuel retail margin collapsed 11.3%, and this is mechanical: when fuel rises at wholesale, retail takes time to pass it through, so the margin shrinks before it recomposes. Over twelve months, 4.6% in core, as expected, and 4.7% in core ex margins, unchanged from July. The 4.6% came from 4.3% due to base arithmetic: the −0.2% from August 2025 left the window and the +0.16% from August 2026 entered. The peak was 4.9% in April.
The same applies to the acceleration headline that the full PPI gained today. Over twelve months it went from 4.8% to 5.4%, but August 2025 had been −0.2% and August 2026 was +0.4%; swapping a negative month for a positive one accounts for the full 0.6 percentage points. The monthly pace of 0.4% was in line with/under the average monthly pace from the last year (0.44%).
In other words, today’s reading did not bring acceleration (only energy, for obvious reasons). Core has been decelerating for three months, core ex margins came in at consensus, and the full PPI’s 5.4% is a base swap: a −0.2 that exited and a +0.4 that entered.
In August, core and core ex margins did not tell the same story. Core rose 0.16% versus 0.3% expected, the third month in a row of deceleration: 0.40 in June, 0.27 in July, and 0.16 now. Core ex margins rose 0.27%, in line with consensus of 0.3%, after 0.4% in July. The difference between the two lies in the trade margin, which fell 0.2% in the month and took about 0.04 of a point off core. The fuel retail margin collapsed 11.3%, and this is mechanical: when fuel rises at wholesale, retail takes time to pass it through, so the margin shrinks before it recomposes. Over twelve months, 4.6% in core, as expected, and 4.7% in core ex margins, unchanged from July. The 4.6% came from 4.3% due to base arithmetic: the −0.2% from August 2025 left the window and the +0.16% from August 2026 entered. The peak was 4.9% in April.
The same applies to the acceleration headline that the full PPI gained today. Over twelve months it went from 4.8% to 5.4%, but August 2025 had been −0.2% and August 2026 was +0.4%; swapping a negative month for a positive one accounts for the full 0.6 percentage points. The monthly pace of 0.4% was in line with/under the average monthly pace from the last year (0.44%).
In other words, today’s reading did not bring acceleration (only energy, for obvious reasons). Core has been decelerating for three months, core ex margins came in at consensus, and the full PPI’s 5.4% is a base swap: a −0.2 that exited and a +0.4 that entered.
1
828
·
--
My strategy for this short in $XAU ..
I opened the trade for US$ 4360.0, placed a low-risk stop at US$ 4400.0, and my take profit is based on liquidity of US$ 4150.0.
Already riding +17% profit at the moment, when it reaches +50% I will do break-even and protect my stop from $XAU at the entry point / 10% profit.
That way I eliminate my risk—if the market goes back, I exit with a small profit; if it keeps going, I capture a bigger profit at my take.
{future}(XAUUSDT)
My strategy for this short in $XAU ..
I opened the trade for US$ 4360.0, placed a low-risk stop at US$ 4400.0, and my take profit is based on liquidity of US$ 4150.0.
Already riding +17% profit at the moment, when it reaches +50% I will do break-even and protect my stop from $XAU at the entry point / 10% profit.
That way I eliminate my risk—if the market goes back, I exit with a small profit; if it keeps going, I capture a bigger profit at my take.
I opened the trade for US$ 4360.0, placed a low-risk stop at US$ 4400.0, and my take profit is based on liquidity of US$ 4150.0.
Already riding +17% profit at the moment, when it reaches +50% I will do break-even and protect my stop from $XAU at the entry point / 10% profit.
That way I eliminate my risk—if the market goes back, I exit with a small profit; if it keeps going, I capture a bigger profit at my take.
1
1
26
·
--
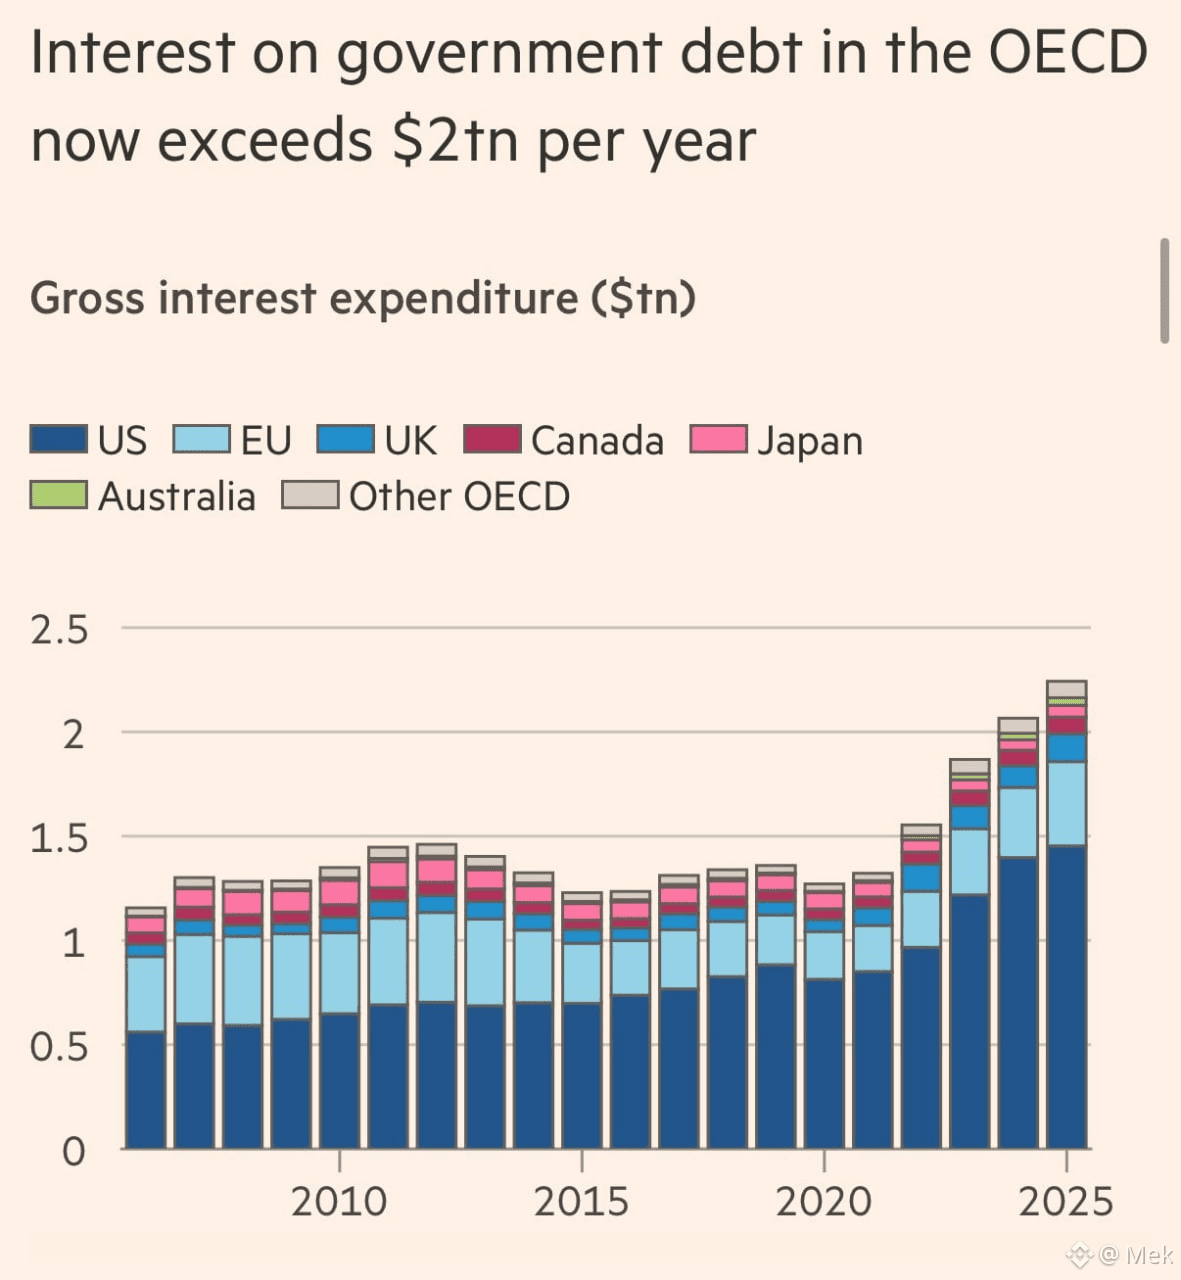
📊 The OECD countries now pay more than US$ 2 trillion per year in just PUBLIC DEBT INTEREST.
This figure has stayed flat near US$ 1.2 trillion for more than a decade.
It doubled in about 4 years.
And the US alone accounts for US$ 1.5 trillion of that total.
What stands out is not the level, but the curve.
Each year of deficit becomes a new stock of debt, which needs to be rolled at today’s rate, not the one from 2015.
As long as the US 30-year yield is near its highest level since 2007, this bar can only go in one direction.
That’s exactly why the Treasury doubled its long-term debt buybacks last month.
You have a small window of time—and one that’s getting shorter—to understand what this really means.
The race for scarce assets is going to intensify!
📊 The OECD countries now pay more than US$ 2 trillion per year in just PUBLIC DEBT INTEREST.
This figure has stayed flat near US$ 1.2 trillion for more than a decade.
It doubled in about 4 years.
And the US alone accounts for US$ 1.5 trillion of that total.
What stands out is not the level, but the curve.
Each year of deficit becomes a new stock of debt, which needs to be rolled at today’s rate, not the one from 2015.
As long as the US 30-year yield is near its highest level since 2007, this bar can only go in one direction.
That’s exactly why the Treasury doubled its long-term debt buybacks last month.
You have a small window of time—and one that’s getting shorter—to understand what this really means.
The race for scarce assets is going to intensify!
This figure has stayed flat near US$ 1.2 trillion for more than a decade.
It doubled in about 4 years.
And the US alone accounts for US$ 1.5 trillion of that total.
What stands out is not the level, but the curve.
Each year of deficit becomes a new stock of debt, which needs to be rolled at today’s rate, not the one from 2015.
As long as the US 30-year yield is near its highest level since 2007, this bar can only go in one direction.
That’s exactly why the Treasury doubled its long-term debt buybacks last month.
You have a small window of time—and one that’s getting shorter—to understand what this really means.
The race for scarce assets is going to intensify!
1
241

·
--
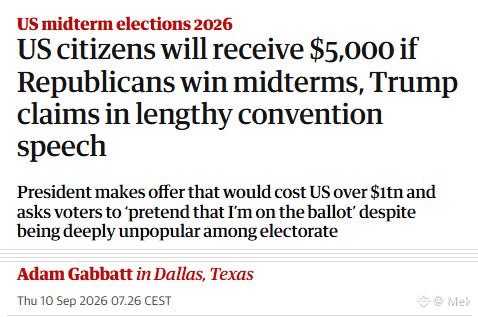
Trump promised US$ 5.000 for each adult American citizen if Republicans keep the House and the Senate.🤡
He called it the "Trump dividend".
The bill goes from US$ 1 trillion, according to estimates based on the census. It was not said where the money would come from.
Now put this into context.
The US already has US$ 40 trillion in gross debt, about 123% of GDP.
Annual spending just on interest hits US$ 1,25 trillion.
And the Treasury needed to double long-term debt buybacks last month just to keep the financing cost under control.
In other words: a US$ 1 trillion check would cost almost the same as the US already pays in interest in an entire year.
No matter who is in power, the direction is the same as what I’ve been showing here.
More spending, more debt, more issuance.
Are you sure you have enough scarce assets?
Trump promised US$ 5.000 for each adult American citizen if Republicans keep the House and the Senate.🤡
He called it the "Trump dividend".
The bill goes from US$ 1 trillion, according to estimates based on the census. It was not said where the money would come from.
Now put this into context.
The US already has US$ 40 trillion in gross debt, about 123% of GDP.
Annual spending just on interest hits US$ 1,25 trillion.
And the Treasury needed to double long-term debt buybacks last month just to keep the financing cost under control.
In other words: a US$ 1 trillion check would cost almost the same as the US already pays in interest in an entire year.
No matter who is in power, the direction is the same as what I’ve been showing here.
More spending, more debt, more issuance.
Are you sure you have enough scarce assets?
He called it the "Trump dividend".
The bill goes from US$ 1 trillion, according to estimates based on the census. It was not said where the money would come from.
Now put this into context.
The US already has US$ 40 trillion in gross debt, about 123% of GDP.
Annual spending just on interest hits US$ 1,25 trillion.
And the Treasury needed to double long-term debt buybacks last month just to keep the financing cost under control.
In other words: a US$ 1 trillion check would cost almost the same as the US already pays in interest in an entire year.
No matter who is in power, the direction is the same as what I’ve been showing here.
More spending, more debt, more issuance.
Are you sure you have enough scarce assets?
1
257
·
--
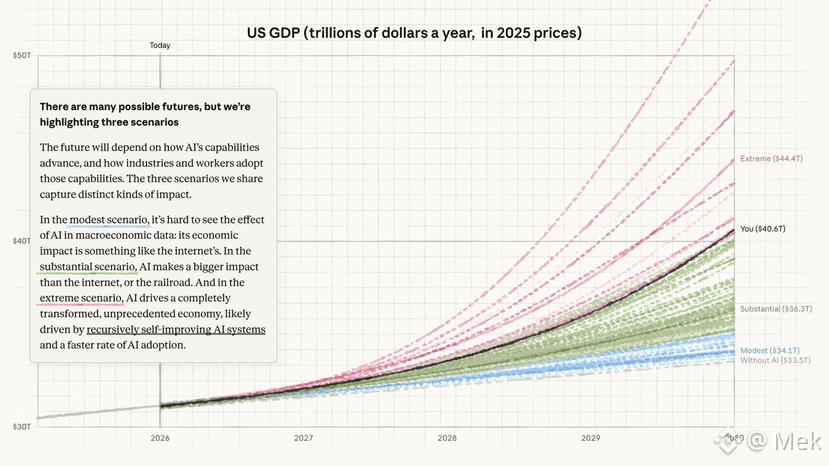
🚨 Anthropic released a projection of the impact of AI on the American economy through 2030.
And the difference between the scenarios is absurd.
In the scenario without AI, US GDP reaches US$ 33,5 trillion by 2030.
In the extreme scenario, it reaches US$ 44,4 trillion.
Nearly US$ 11 trillion in difference. An entire economy depending on which curve plays out.
But the most important detail is something else.
In the modest scenario, GDP reaches US$ 34,1 trillion.
That is, practically nothing above the scenario with no AI at all.
In that case, the impact of AI would be invisible in macro data. Similar to what the internet did.
Now connect this with debt.
The US has US$ 40 trillion in gross debt today. About 123% of GDP.
In the extreme scenario, GDP grows 32% in four years and the fiscal problem dilutes on its own.
In the modest scenario, it stays exactly the same.
And this is where the market’s silent bet is.
Bond investors demanding high yields and the stock market pricing in record productivity can’t both be right at the same time.
If the modest scenario wins, there will be taxes left over, spending cuts, or inflation.
None of the three is good for someone holding wealth in fiat currency.
🚨 Anthropic released a projection of the impact of AI on the American economy through 2030.
And the difference between the scenarios is absurd.
In the scenario without AI, US GDP reaches US$ 33,5 trillion by 2030.
In the extreme scenario, it reaches US$ 44,4 trillion.
Nearly US$ 11 trillion in difference. An entire economy depending on which curve plays out.
But the most important detail is something else.
In the modest scenario, GDP reaches US$ 34,1 trillion.
That is, practically nothing above the scenario with no AI at all.
In that case, the impact of AI would be invisible in macro data. Similar to what the internet did.
Now connect this with debt.
The US has US$ 40 trillion in gross debt today. About 123% of GDP.
In the extreme scenario, GDP grows 32% in four years and the fiscal problem dilutes on its own.
In the modest scenario, it stays exactly the same.
And this is where the market’s silent bet is.
Bond investors demanding high yields and the stock market pricing in record productivity can’t both be right at the same time.
If the modest scenario wins, there will be taxes left over, spending cuts, or inflation.
None of the three is good for someone holding wealth in fiat currency.
And the difference between the scenarios is absurd.
In the scenario without AI, US GDP reaches US$ 33,5 trillion by 2030.
In the extreme scenario, it reaches US$ 44,4 trillion.
Nearly US$ 11 trillion in difference. An entire economy depending on which curve plays out.
But the most important detail is something else.
In the modest scenario, GDP reaches US$ 34,1 trillion.
That is, practically nothing above the scenario with no AI at all.
In that case, the impact of AI would be invisible in macro data. Similar to what the internet did.
Now connect this with debt.
The US has US$ 40 trillion in gross debt today. About 123% of GDP.
In the extreme scenario, GDP grows 32% in four years and the fiscal problem dilutes on its own.
In the modest scenario, it stays exactly the same.
And this is where the market’s silent bet is.
Bond investors demanding high yields and the stock market pricing in record productivity can’t both be right at the same time.
If the modest scenario wins, there will be taxes left over, spending cuts, or inflation.
None of the three is good for someone holding wealth in fiat currency.
1
195
·
--
Verified
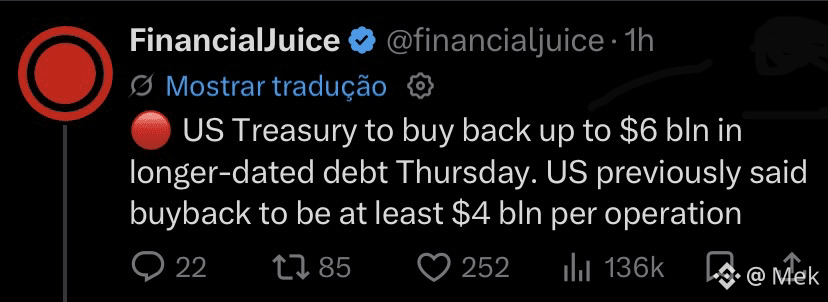
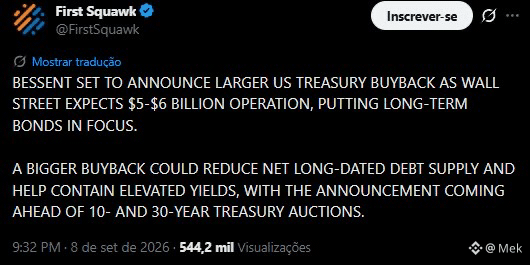
🚨 TREASURY ANNOUNCES $6 BILLION BUYBACKS THIS THURSDAY
This only scratches the surface of this current long-term debt. The volume will keep rising until it actually has some effect on the long end.
Hopefully by then you’ll already know what this means.
🚨 TREASURY ANNOUNCES $6 BILLION BUYBACKS THIS THURSDAY
This only scratches the surface of this current long-term debt. The volume will keep rising until it actually has some effect on the long end.
Hopefully by then you’ll already know what this means.
This only scratches the surface of this current long-term debt. The volume will keep rising until it actually has some effect on the long end.
Hopefully by then you’ll already know what this means.
2
1
308
·
--
Verified
And even so, there are still many investors looking only at the FED’s interest rate to understand the market.
They couldn’t be more out of touch. A tunnel vision, perhaps.
The name of the game now is duration.
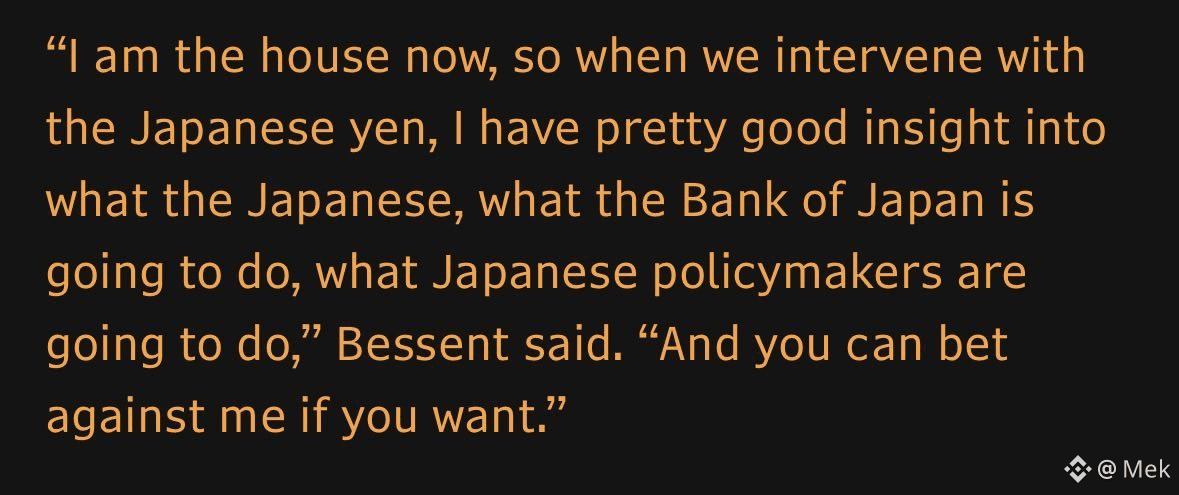
The intervention Bessent is making on the long end happens precisely when central banks—like Japan—continue to be offloading treasuries.
The $4 BILLION that were announced are just the tip of the iceberg. Much more issuance of t-bills will be needed (maybe triple, quadruple?).
And when t-bills are issued to buy long-dated securities, that’s a duration swap in the collateral.
Mainly in MMFs and shadow banking, they’ll feel this effect. Assets that work "almost like money".
So you’re following an analyst trying to figure out only what the FED will do with rates at the next meeting? Then just know you’re looking at half the market.
And even so, there are still many investors looking only at the FED’s interest rate to understand the market.
They couldn’t be more out of touch. A tunnel vision, perhaps.
The name of the game now is duration.
The intervention Bessent is making on the long end happens precisely when central banks—like Japan—continue to be offloading treasuries.
The $4 BILLION that were announced are just the tip of the iceberg. Much more issuance of t-bills will be needed (maybe triple, quadruple?).
And when t-bills are issued to buy long-dated securities, that’s a duration swap in the collateral.
Mainly in MMFs and shadow banking, they’ll feel this effect. Assets that work "almost like money".
So you’re following an analyst trying to figure out only what the FED will do with rates at the next meeting? Then just know you’re looking at half the market.
They couldn’t be more out of touch. A tunnel vision, perhaps.
The name of the game now is duration.
The intervention Bessent is making on the long end happens precisely when central banks—like Japan—continue to be offloading treasuries.
The $4 BILLION that were announced are just the tip of the iceberg. Much more issuance of t-bills will be needed (maybe triple, quadruple?).
And when t-bills are issued to buy long-dated securities, that’s a duration swap in the collateral.
Mainly in MMFs and shadow banking, they’ll feel this effect. Assets that work "almost like money".
So you’re following an analyst trying to figure out only what the FED will do with rates at the next meeting? Then just know you’re looking at half the market.
1
573
·
--
Verified
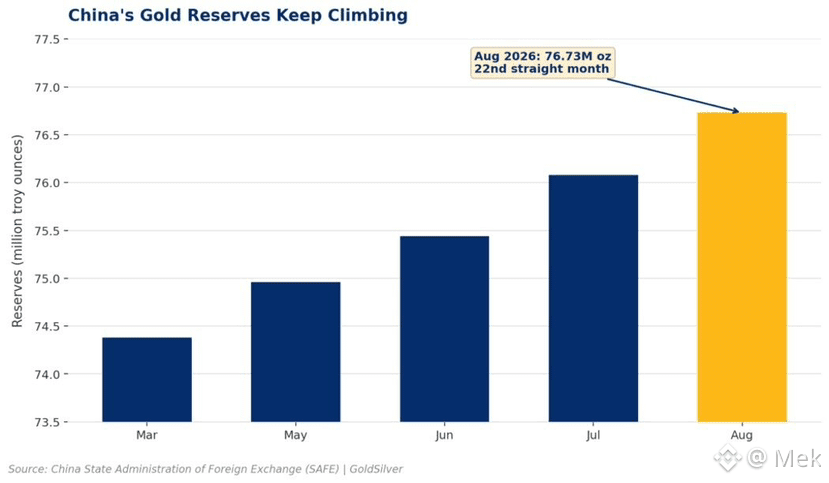
China has already bought more gold in 8 months of 2026 than in all of 2025.🚨
It was 80 tons versus 29 in the entire previous year.
Just in August, it was 20 tons—matching the highest monthly purchase since October 2023—and marking the 22nd consecutive month of buying.
Total reserves hit a record of 2,387 tons, or 76.73 million troy ounces.
And this is only the official figure.
Goldman Sachs estimates via the London OTC market suggest that the actual purchase is more than double what has been reported in some months.
The race for scarce assets continues to intensify.
China has already bought more gold in 8 months of 2026 than in all of 2025.🚨
It was 80 tons versus 29 in the entire previous year.
Just in August, it was 20 tons—matching the highest monthly purchase since October 2023—and marking the 22nd consecutive month of buying.
Total reserves hit a record of 2,387 tons, or 76.73 million troy ounces.
And this is only the official figure.
Goldman Sachs estimates via the London OTC market suggest that the actual purchase is more than double what has been reported in some months.
The race for scarce assets continues to intensify.
It was 80 tons versus 29 in the entire previous year.
Just in August, it was 20 tons—matching the highest monthly purchase since October 2023—and marking the 22nd consecutive month of buying.
Total reserves hit a record of 2,387 tons, or 76.73 million troy ounces.
And this is only the official figure.
Goldman Sachs estimates via the London OTC market suggest that the actual purchase is more than double what has been reported in some months.
The race for scarce assets continues to intensify.
2
1.2k
·
--
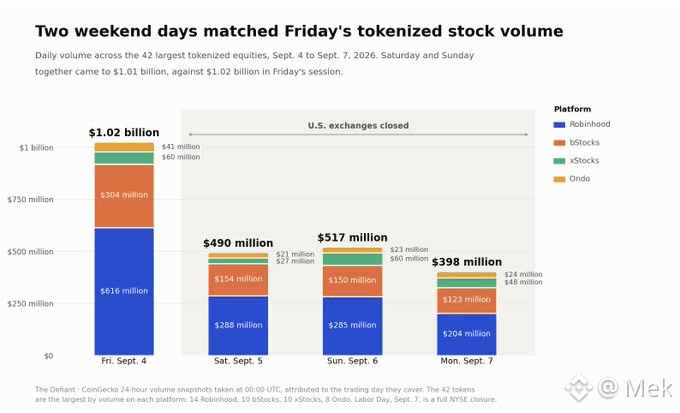
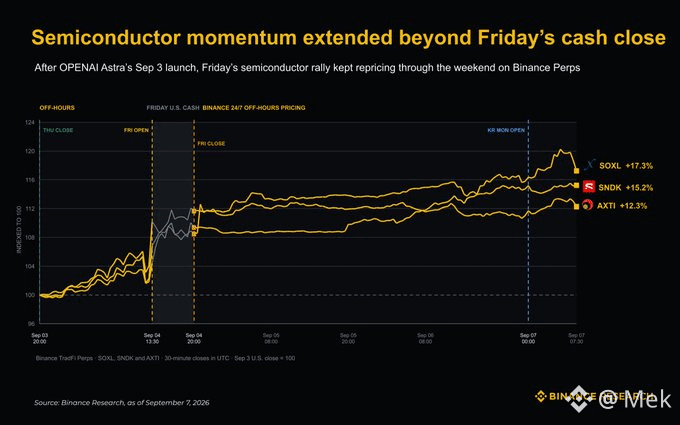
Astra didn’t pull the whole tape. It pulled the part that was most tight.
On September 3rd, OpenAI’s launch shifted the discourse from a token-generating model to an agent that closes a task. This expands the bill: compute, memory, storage, network, equipment.
Friday’s tape showed where the money really went. Leadership in memory, equipment, and interconnect. The GPU lagged behind. This isn’t an agent narrative. It’s short NAND and DRAM, tight HBM4 without spare capacity, yield easing, and the position that was flattened starting to regain ground.
$SOXL +9.6% and $SNDK +11.7% in Friday’s cash. When Korea opened on Monday, Binance’s Perps were still adding +5.9% and +2.8%. The price didn’t wait for the bell.
The useful data isn’t the percentage. It’s the clock. The U.S. session closes. The 24h book keeps showing the same move all weekend.
Anyone who reads only Friday’s cash is one session behind.
Astra didn’t pull the whole tape. It pulled the part that was most tight.
On September 3rd, OpenAI’s launch shifted the discourse from a token-generating model to an agent that closes a task. This expands the bill: compute, memory, storage, network, equipment.
Friday’s tape showed where the money really went. Leadership in memory, equipment, and interconnect. The GPU lagged behind. This isn’t an agent narrative. It’s short NAND and DRAM, tight HBM4 without spare capacity, yield easing, and the position that was flattened starting to regain ground.
$SOXL +9.6% and $SNDK +11.7% in Friday’s cash. When Korea opened on Monday, Binance’s Perps were still adding +5.9% and +2.8%. The price didn’t wait for the bell.
The useful data isn’t the percentage. It’s the clock. The U.S. session closes. The 24h book keeps showing the same move all weekend.
Anyone who reads only Friday’s cash is one session behind.
On September 3rd, OpenAI’s launch shifted the discourse from a token-generating model to an agent that closes a task. This expands the bill: compute, memory, storage, network, equipment.
Friday’s tape showed where the money really went. Leadership in memory, equipment, and interconnect. The GPU lagged behind. This isn’t an agent narrative. It’s short NAND and DRAM, tight HBM4 without spare capacity, yield easing, and the position that was flattened starting to regain ground.
$SOXL +9.6% and $SNDK +11.7% in Friday’s cash. When Korea opened on Monday, Binance’s Perps were still adding +5.9% and +2.8%. The price didn’t wait for the bell.
The useful data isn’t the percentage. It’s the clock. The U.S. session closes. The 24h book keeps showing the same move all weekend.
Anyone who reads only Friday’s cash is one session behind.
1
230
Log in to explore more content
Join global crypto users on Binance Square
⚡️ Get latest and useful information about crypto.
💬 Trusted by the world’s largest crypto exchange.
👍 Discover real insights from verified creators.
Email / Phone number
Trending Topics
ClarityActFacesProceduralVoteSept15
44,864 views
670 Discussing
Tuesday, September 15, 2:15pm ET. Mark it. 🗓️
The Senate votes on whether to even debate the CLARITY Act, the bill that would finally define which coins are securities vs commodities under US law.
Needs 60 votes. Republicans have 53. Several Democrats need to cross over, and it's not guaranteed.
Fail this vote = the bill is dead for 2026, likely until 2029 (midterms eat the calendar after this).
Pass this vote = doors open to real debate, still a long way to actual law.
Biggest crypto regulation moment of the year happens in a few days.
#ClarityActFacesProceduralVoteSept15
NewbieToNode
·3 Likes
·4.5k views
US2YearYieldRisesTo4.61%
33,629 views
645 Discussing
US10YearTreasuryYieldNears5%
20,172 views
377 Discussing