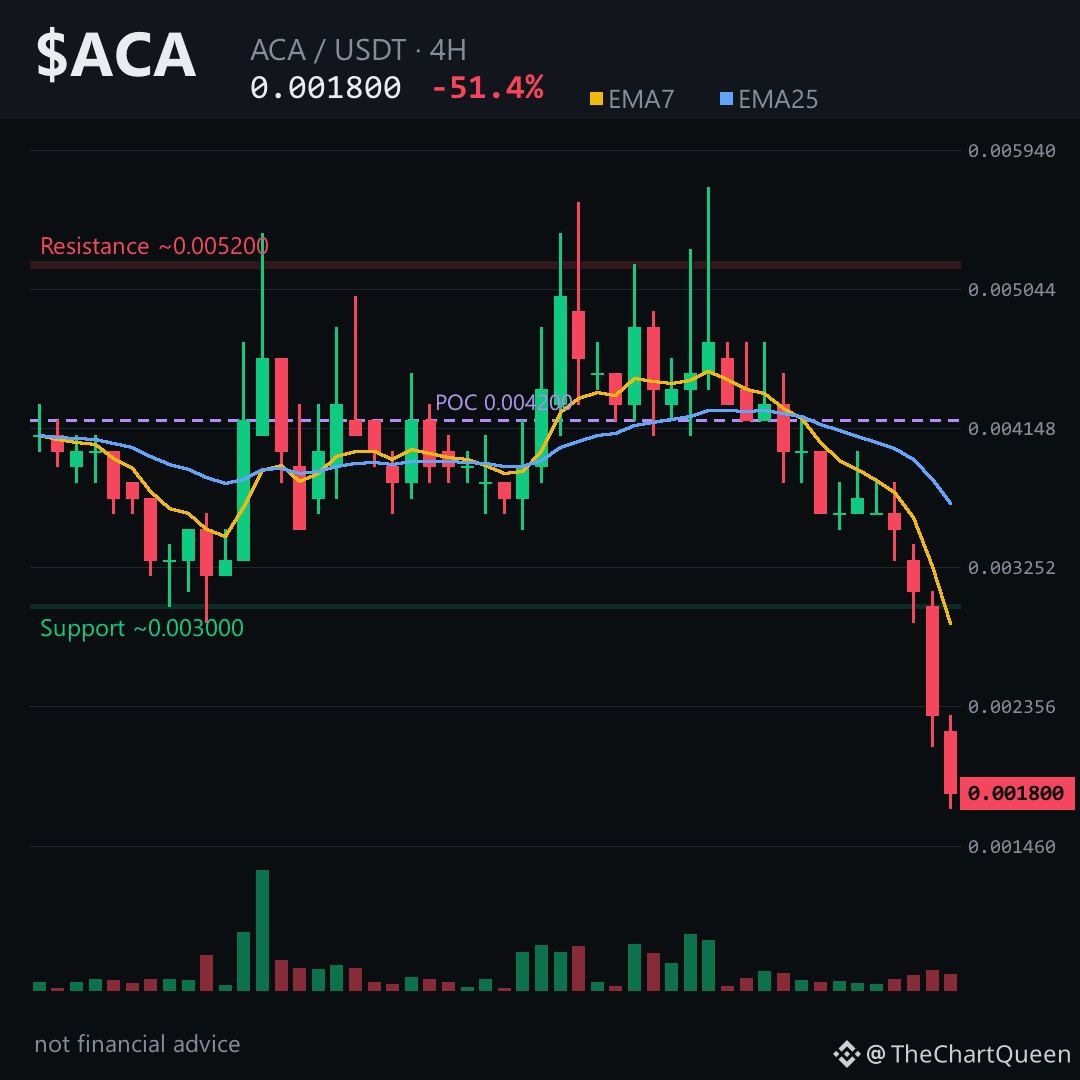
$ACA just lost half its value in a day. Not a dip. A structural break.
And here's the part most will miss — the 4H chart is still bleeding without any meaningful bounce.
RSI is buried near 22. EMA7 is miles below EMA25. Price is carving lower highs and lower lows with zero hesitation.
The 4H candles tell the story clean: a slow bleed from the 0.0042 area, then a -23% candle, then another -18% candle. That's not normal selling. That's abandonment.
The only honest read? Weakness isn't done until price reclaims something.
My read: the ~0.0019 area is the line that matters on $ACA. As long as price stays below it, the path of least resistance remains lower. A 4H close back above that zone and this whole bearish structure starts to crack.
The objective below sits around the 0.0016 area — that's where the next liquidity pocket likely lives. Losing that opens the door to the macro lows near 0.0011.
The trap here? Volume is thin. A bounce from these depths can be violent and fake. Don't confuse a dead-cat bounce with a reversal.
Tap $ACA to pull up the chart and read these levels yourself.
Follow me — I'll keep tracking this one because a -51% day always leaves a story behind. What level are you watching on ACA right now? 👇
⚠️ Not financial advice. DYOR.
#ACA #Crypto #BinanceSquare #Altcoins
And here's the part most will miss — the 4H chart is still bleeding without any meaningful bounce.
RSI is buried near 22. EMA7 is miles below EMA25. Price is carving lower highs and lower lows with zero hesitation.
The 4H candles tell the story clean: a slow bleed from the 0.0042 area, then a -23% candle, then another -18% candle. That's not normal selling. That's abandonment.
The only honest read? Weakness isn't done until price reclaims something.
My read: the ~0.0019 area is the line that matters on $ACA. As long as price stays below it, the path of least resistance remains lower. A 4H close back above that zone and this whole bearish structure starts to crack.
The objective below sits around the 0.0016 area — that's where the next liquidity pocket likely lives. Losing that opens the door to the macro lows near 0.0011.
The trap here? Volume is thin. A bounce from these depths can be violent and fake. Don't confuse a dead-cat bounce with a reversal.
Tap $ACA to pull up the chart and read these levels yourself.
Follow me — I'll keep tracking this one because a -51% day always leaves a story behind. What level are you watching on ACA right now? 👇
⚠️ Not financial advice. DYOR.
#ACA #Crypto #BinanceSquare #Altcoins