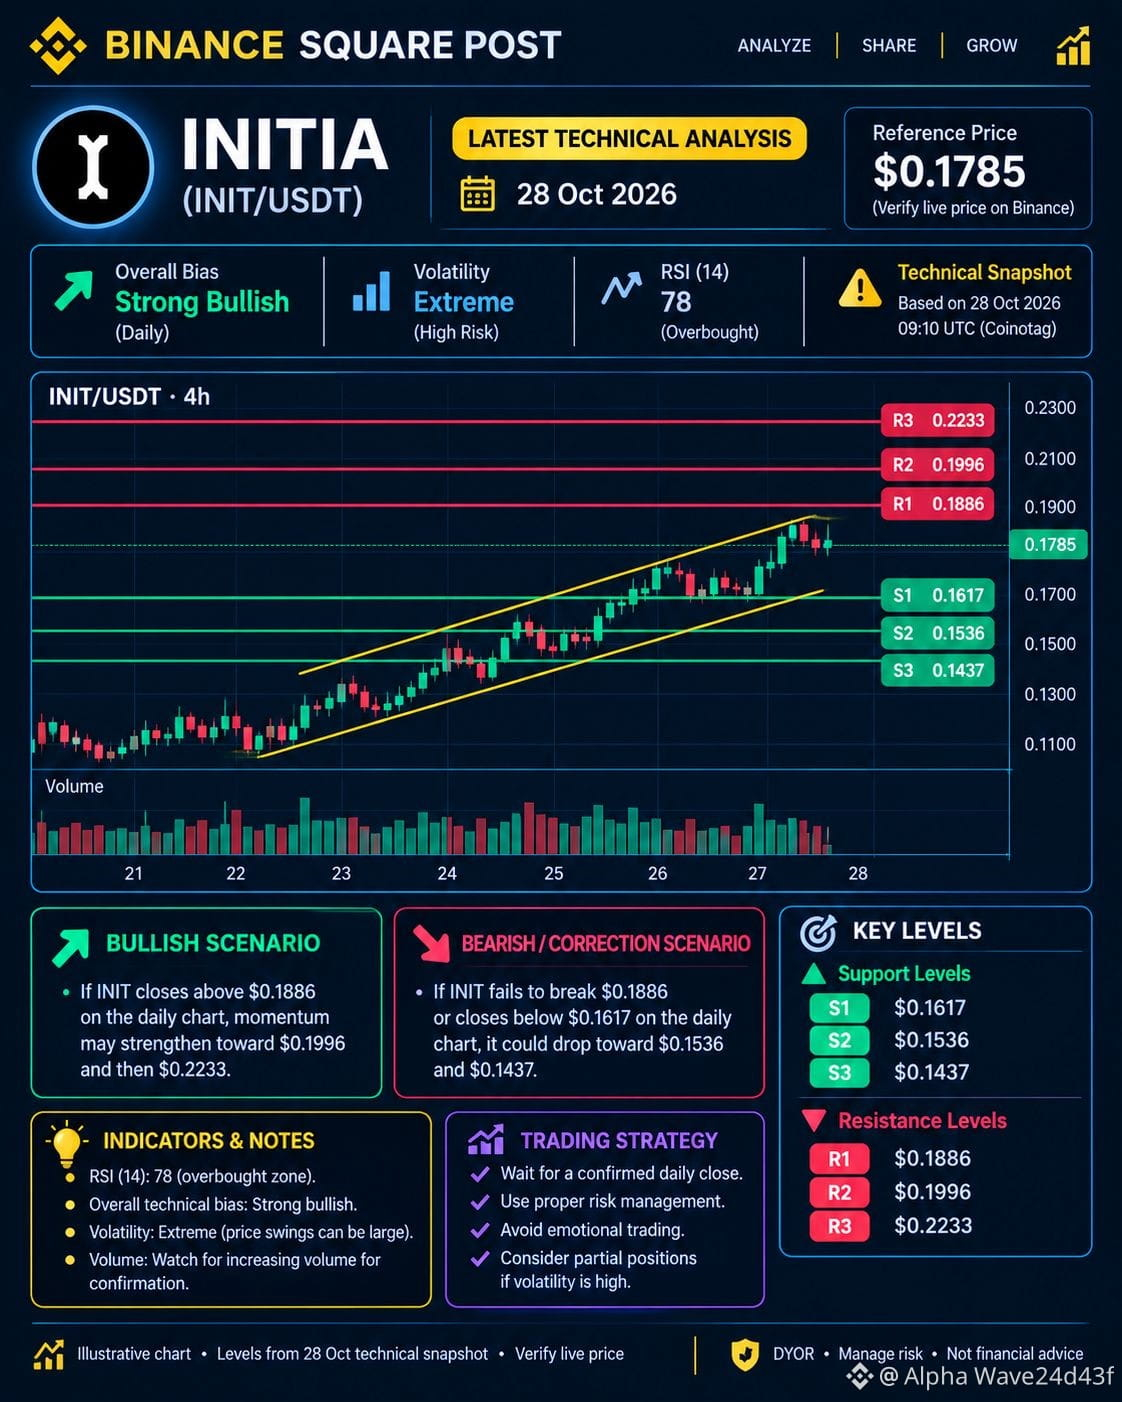
$INIT 🚀 INITIA (INIT) LATEST PRICE ANALYSIS 📊
📅 October 28, 2026
🔥 INIT Is Bullish — But Is a Correction Coming?
INIT is showing strong bullish momentum, but the RSI is in overbought territory. Traders should watch the resistance zone carefully before expecting another upward move.
💰 Reference Price: $0.1785
🟢 SUPPORT LEVELS • S1: $0.1617 • S2: $0.1536 • S3: $0.1437
🔴 RESISTANCE LEVELS • R1: $0.1886 • R2: $0.1996 • R3: $0.2233
📈 BULLISH SCENARIO 🚀 A confirmed daily candle close above $0.1886 could open the way toward $0.1996 and potentially $0.2233.
📉 BEARISH SCENARIO ⚠️ If INIT fails to break resistance and drops below $0.1617, a correction toward $0.1536 could follow.
📊 TECHNICAL INDICATORS • Overall trend: Bullish • RSI (14): 78 — Overbought • Volatility: High • Key trigger: Breakout confirmation with volume
🎯 TRADING PLAN ✅ Wait for candle-close confirmation. ✅ Watch trading volume. ✅ Manage risk carefully. ⚠️ Avoid chasing green candles after a sharp rally.
💬 YOUR OPINION!
Will INIT break $0.1886 and move toward $0.20, or will sellers trigger a correction?
Comment BULLISH 🚀 or BEARISH 📉 below!
#INIT #Initia #CryptoAnalysis #Altcoins #BinanceSquare