Hello everyone! I’m Du Xun. Looking at Bitcoin on the daily chart, we’re seeing a sustained decline. From yesterday to today, the price has repeatedly tested the $80,000 level, crossing above and then below it several times. It has been moving sideways around $80,000 throughout this period, so the short-term trend does look somewhat weak. Earlier, we saw a sharp drop on heavy volume, followed by a slower decline. But on the daily chart, although the past few days have all closed lower, the actual downside has been fairly limited. Each time the price dipped, it left a relatively long lower wick and quickly recovered, rebounding soon after the drop. So, is $80,000 a genuinely strong support level? It is indeed acting as support: whenever the price tests $80,000, it tends to bounce to some extent. But if we’re asking how well this support is holding and how strong it is, we haven’t yet seen new buyers step in aggressively at this level. Nor have we seen a particularly strong rebound from $80,000 so far.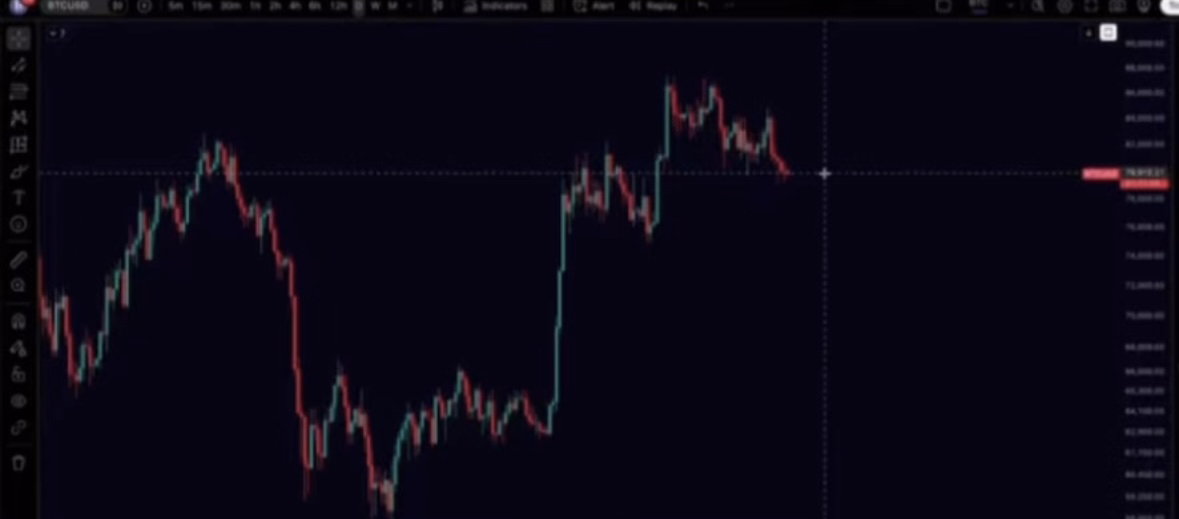 But if we look at the four-hour chart, this price action is still just a consolidation. It has not turned into a clear bearish downtrend. So this is a corrective phase of consolidation and decline, and the price is currently at a relatively low level within that range. Why? Looking at past price action, after a decline like this, we usually see a rebound. Declines like this are often difficult to extend, and rebounds are also difficult to sustain—that is what a ranging market looks like. In a ranging market, we should consider selling high and buying low, rather than entering short positions at the bottom of a decline. I think the risk there is quite high. So even if you think going long at this level would be an early entry with relatively high risk, and that the price might continue to probe lower or drift down, you can choose not to go long. But I also think you should not enter a short position here, because I believe the risk is even greater. Even if the price does go on to fall, that does not really affect us; it is simply a matter of sticking to our reasoning. Of course, when I say we should not short here, I do not mean we should bet that the price will not fall. Rather, I think the risk of entering at this level is quite high. We saw the same thing in the previous move: after a sharp, one-way decline, there was a rebound. So we cannot say that this decline will necessarily lead directly into a major bullish uptrend from this level. We should at least wait to see a rebound first. A conservative target for that rebound would be around 82,000, or above 82,000. In the previous decline, the rebound reached the 0.5–0.618 range. When the price got there, we said it was a short-term resistance area and that we should watch what happened next. The same applies here. After this one-way downtrend and sharp decline, if the price rebounds to the 0.5–0.618 range, that would put it between 82,000 and 82,700. I think there is a fairly good chance that the price will reach this range. So in the short term, we should at least expect a rebound, and 82,700 is also the neckline of the previous double-top structure, making it a short-term resistance level.
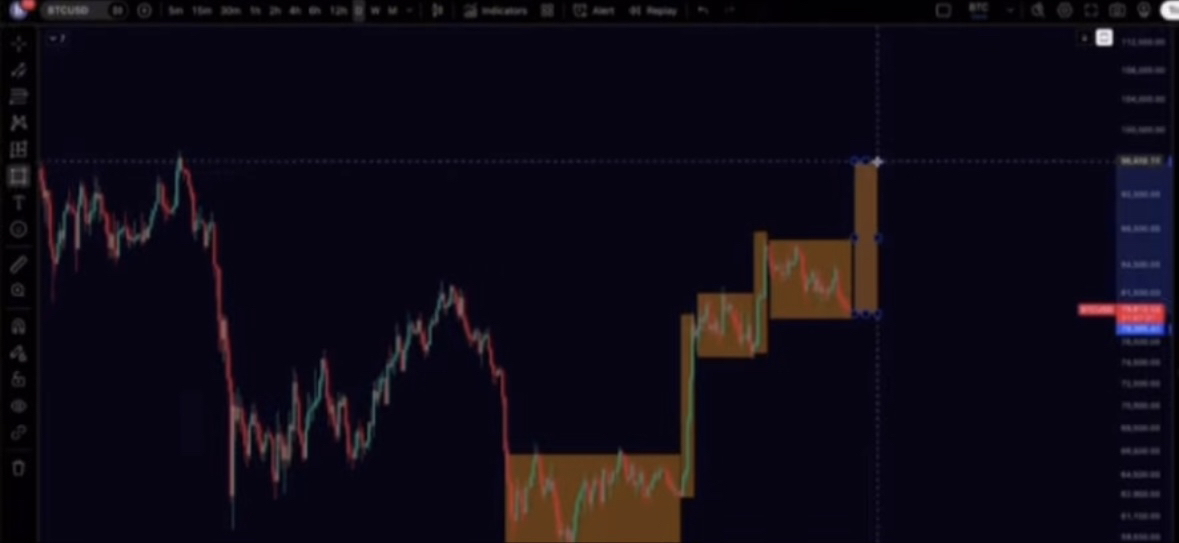
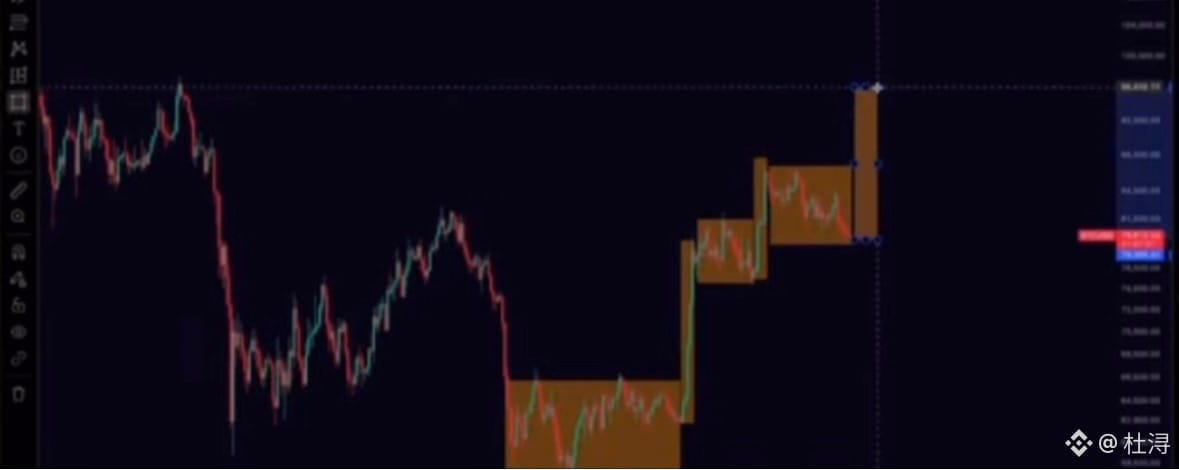
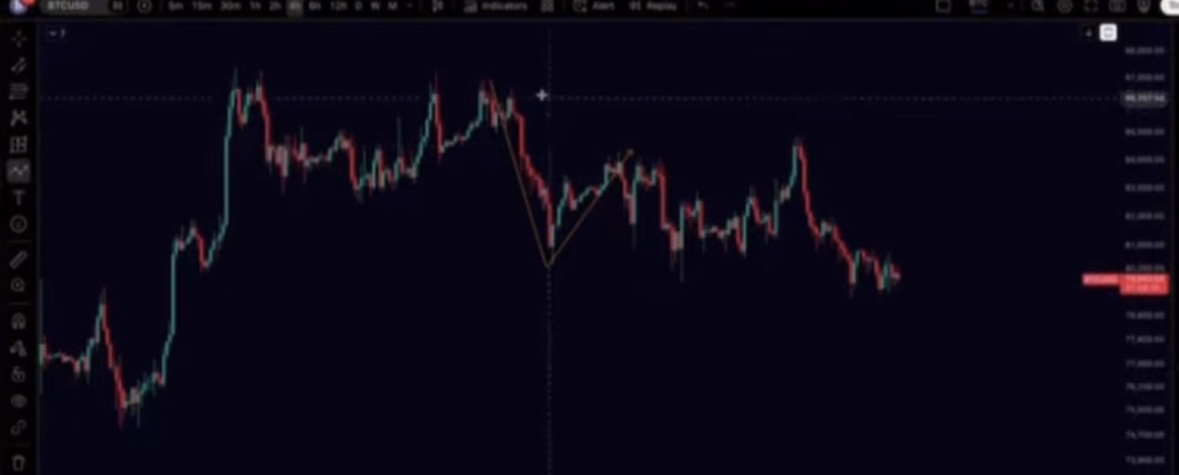 So for now, looking at this level on the hourly chart, the first thing to confirm is that we should not enter a short position here. I think the risk is quite high. Going long would also be an early entry, so you need to manage your risk. If you want to wait for confirmation, then the only option at this level is to stay on the sidelines. That is my view on the short-term outlook. Now let’s look at the daily chart. My view remains the same as before: in the past, when the price was at 60,000, we reminded you to buy spot. If you did not buy spot at 60,000, then this is a very good opportunity to add to your position. We saw that after an extended period of sideways consolidation at this level, the price went on to make a rapid move higher. That rally happened quickly. The same thing happened here: after a lengthy period of consolidation, the price made this accelerated move higher. Generally speaking, the longer a consolidation lasts, and the deeper the pullback, the more room there may be for a subsequent move up. This consolidation has already lasted for more than a month, so I think the next accelerated rally has a fairly good chance of pushing directly toward the previous swing high near 97,000. This level is essentially a liquidation event for the bulls, or a turnover of positions held at higher prices. This kind of downward move is mainly about clearing out leveraged positions. If the market really is going to carry out a deeper liquidation of the bulls, the liquidation point would be around 76,000. That means there is a fairly good chance of a break below 76,000. After that break, the final liquidation of the bulls would be complete, and a new rally could begin. So if the market is going to carry out a more comprehensive liquidation of the bulls, 76,000 could be broken. We cannot rule that out. So in the short term, make sure you manage risk and use stop-losses. If your stop is hit at 79,000, exit the position. After exiting, wait for a new trading opportunity. The price may then test the previous low; we cannot rule that out. If we get that opportunity, it would be a chance to add to a spot position. So I think it is reasonable to enter in batches at current levels. If you did not buy earlier, you can start buying gradually at these levels. If the price does fall further, we can make our final addition then. First, it is important to understand that I still believe we are in the early stages of a transition from a bear market to a bull market. During this early stage, sideways consolidation and declines are essentially a way of liquidating leveraged bullish positions.
 Also, let’s look at the daily MACD. In the past, the MACD showed a bearish divergence at this point: the price continued to rise, while the highs of the MACD DIF line gradually moved lower. This created a bearish divergence, which was followed by a downward correction. Currently, we can see that the price lows are gradually moving higher. The lows are continuing to rise. As for the MACD DIF line, although it has not yet formed a new crossover, its lows have indeed been moving lower, and the DIF value has continued to decline,
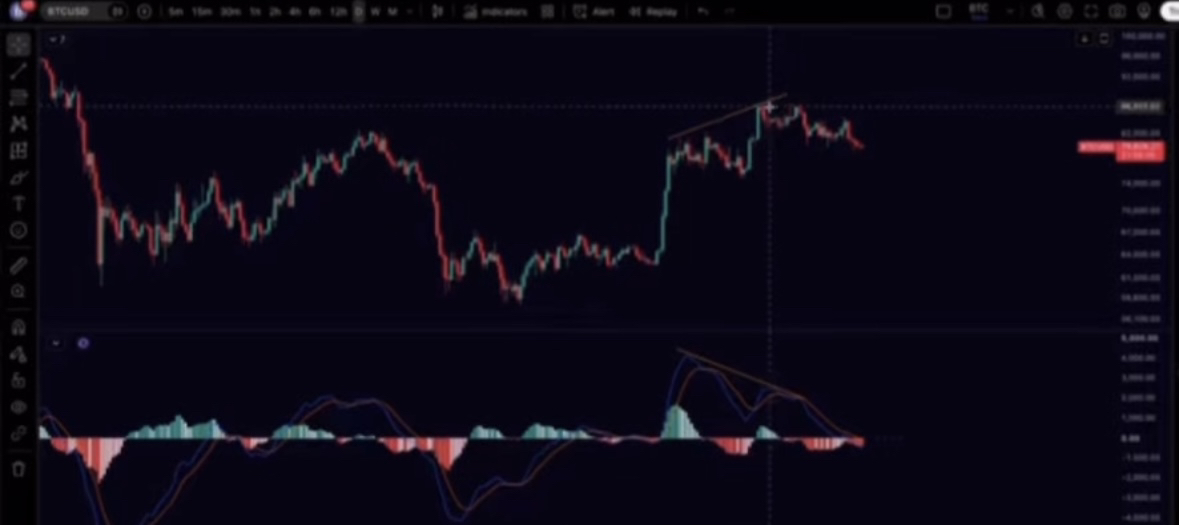 So there is a fairly good chance that a bullish divergence will form on the daily chart. I therefore think that after this daily-chart consolidation, we will see an accelerated rally. The only thing we cannot confirm yet is when that rally will begin. This round of shakeout may not be over yet, and it may even be postponed until next month—that is, November—or until after November 3, once the midterm elections are over, before a new direction emerges. The market may continue to move sideways and test investors’ patience in the near term. But once a new accelerated rally begins, it could move very quickly. So I remain optimistic and confident about the bullish outlook over the medium to long term. Today I’ve provided a comprehensive review of the market. I hope you’ll take the time to watch it through! Follow Du Xun, and you’ll be notified of any updates as soon as they come in!


Article
BTC Continues to Drift Lower! When Will It Bottom?

--