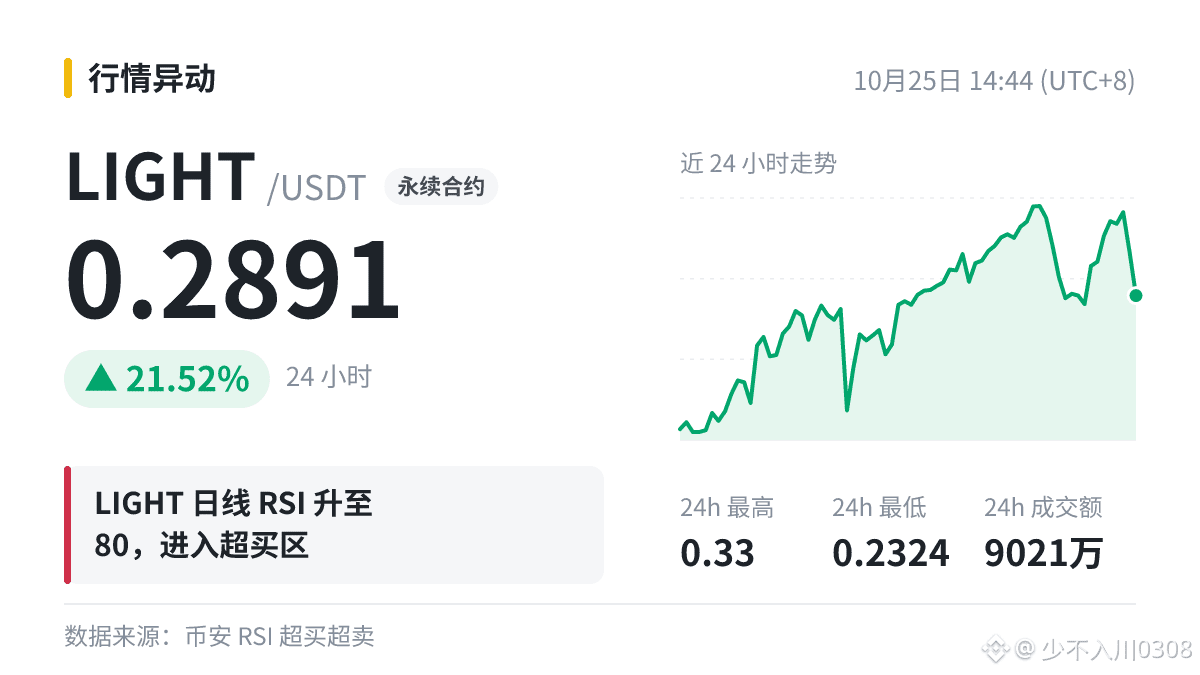
$LIGHT Daily RSI is 79.9, entering overbought territory, with the current price at 0.2891.
A beginner’s burning question: What exactly does RSI measure?
RSI 50 is often seen as the dividing line between bulls and bears: staying above 50 over the long term suggests upward momentum is prevailing, while staying below it suggests the opposite.
I tend to use RSI as a signal that sentiment may be overheated or oversold, and look at it alongside key price levels and trading volume. I wouldn’t place trades based on it alone.
The point of understanding an indicator is to be less spooked by a single number—not to use it to predict whether prices will rise or fall.