

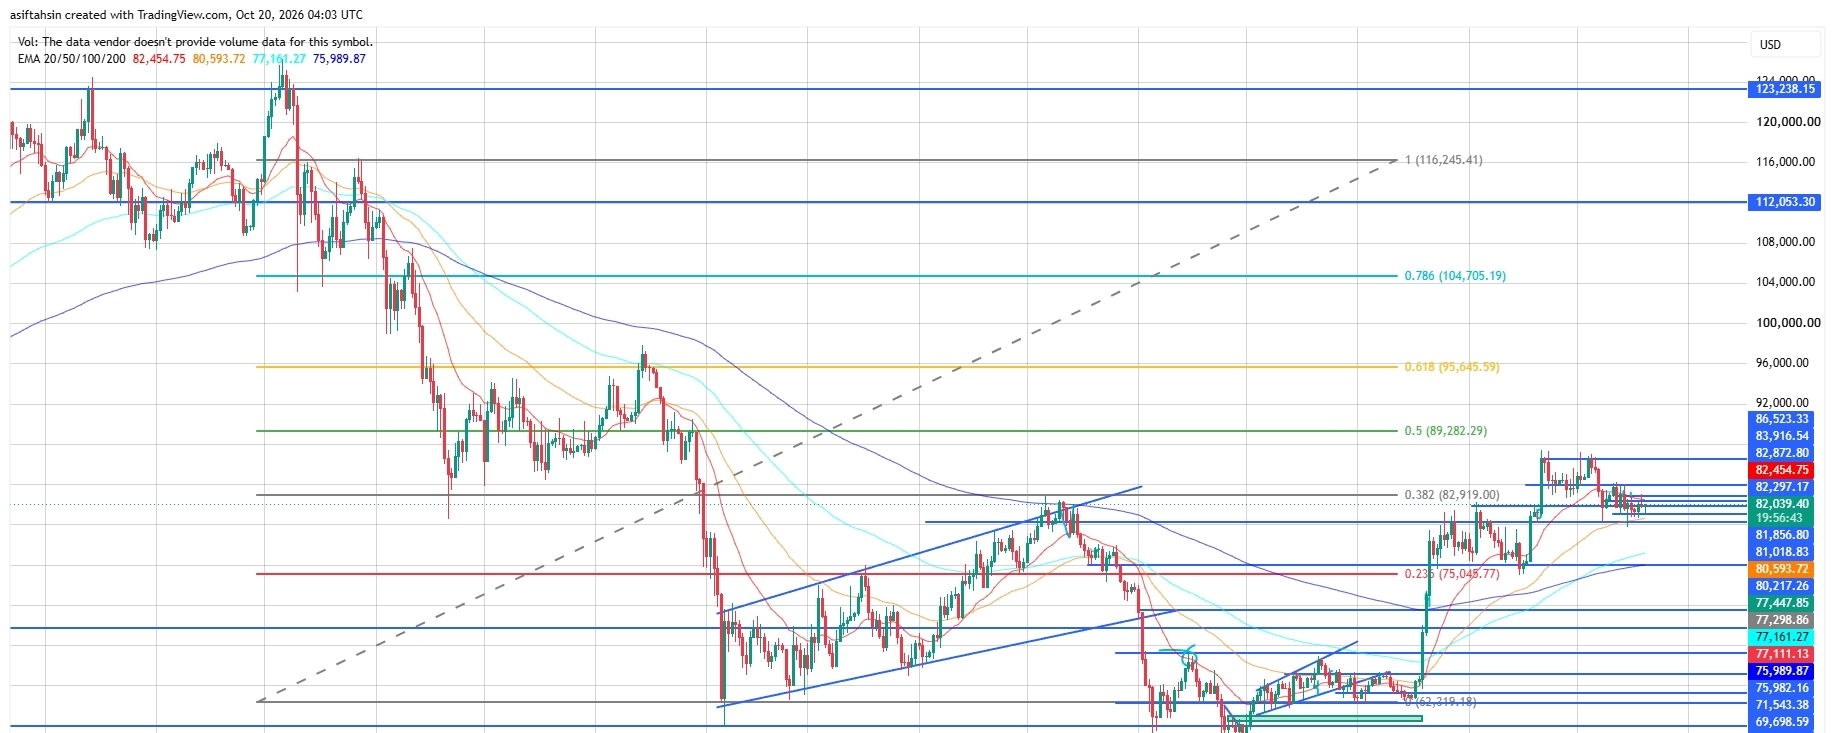

Bitcoin is currently trading around $82,039–$82,297, consolidating after its recovery from the $62,000–$67,000 region. BTC previously rallied toward $83,900, but the latest price action shows a pullback and sideways movement below the recent local highs.
The broader recovery remains intact, but short-term momentum has weakened. BTC needs to reclaim the $82,872–$83,916 resistance zone to strengthen the bullish outlook, while losing the $81,000–$80,200 support area could trigger a deeper correction.
📊 EMA Structure
* 20 EMA: $82,454.75
* 50 EMA: $80,593.72
* 100 EMA: $77,161.27
* 200 EMA: $75,989.87
BTC is trading below the 20 EMA but remains above the 50, 100, and 200 EMAs. This suggests short-term weakness within a broader recovery structure.
The 20 EMA near $82,455 is the immediate resistance to reclaim. Holding above the 50 EMA near $80,594 would help preserve the broader recovery.
📐 Fibonacci Levels
Based on your chart:
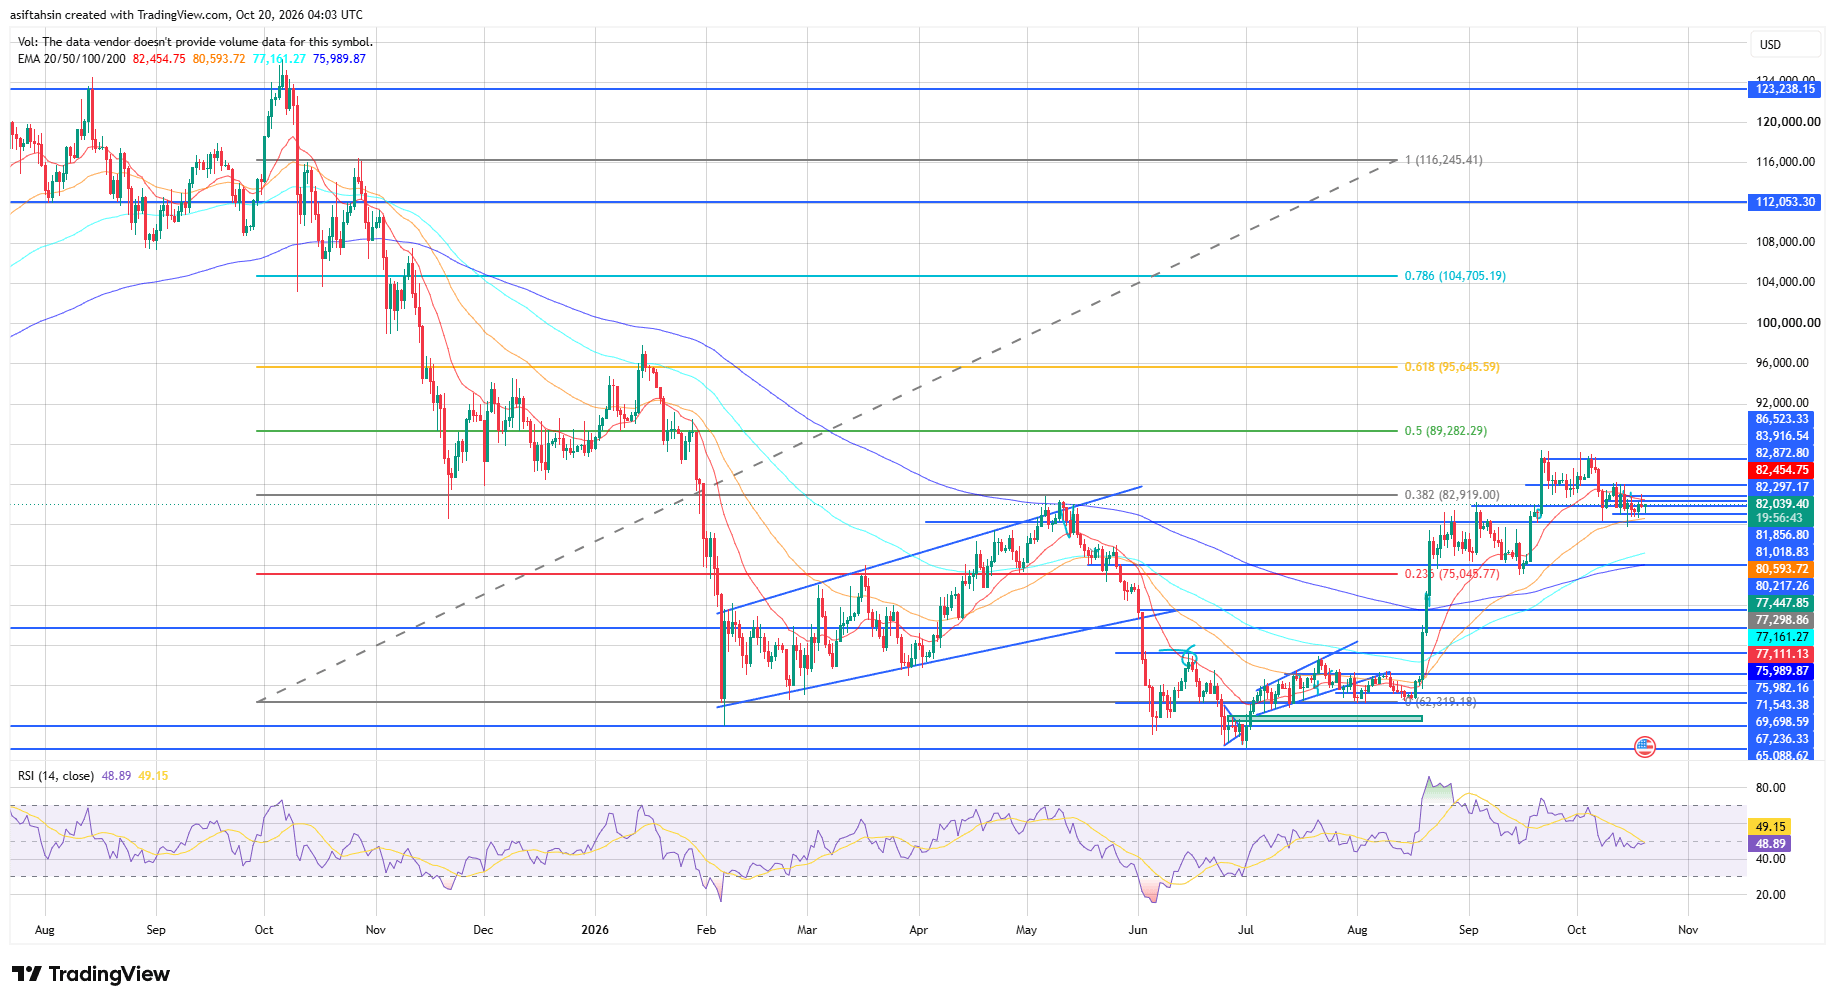
* 0.236: $75,045.77
* 0.382: $82,919.00
* 0.5: $89,282.29
* 0.618: $95,645.59
* 0.786: $104,705.19
* 1.0: $116,245.41
BTC is consolidating slightly below the 0.382 Fibonacci level near $82,919. Reclaiming this level would improve the short-term outlook, while the next major Fibonacci resistance sits at $89,282.
🚀 Bullish Scenario
If BTC holds above $81,000–$80,200 and reclaims the nearby resistance zone, buyers could attempt another move toward:
🎯 $82,872–$83,916 🎯 $86,523 🎯 $89,282 🎯 $95,645 🎯 $104,705
A decisive breakout above $83,916 would improve the recovery outlook. A move above $86,523 would strengthen bullish continuation toward the $89,282 Fibonacci level.
🔄 Pullback Scenario
If BTC fails to reclaim $82,919–$83,916 and selling pressure increases, watch these support zones:
* $81,856–$81,018
* $80,217
* $80,594 — 50 EMA
* $77,448–$77,161
* $75,990 — 200 EMA
* $75,045 — 0.236 Fibonacci
* $71,543
A pullback toward $81,000–$80,200 could be a normal retest. However, losing $80,217 would weaken the recovery and increase the risk of a deeper correction toward $77,400–$75,000.
📊 RSI Momentum
* RSI: 48.89
* RSI Signal Average: 49.15
RSI is hovering just below the neutral 50 level, indicating that bullish momentum has cooled. A move above 50–55 would support a recovery attempt, while a drop below 45 would suggest increasing downside pressure.
📈 Market Structure & Liquidity
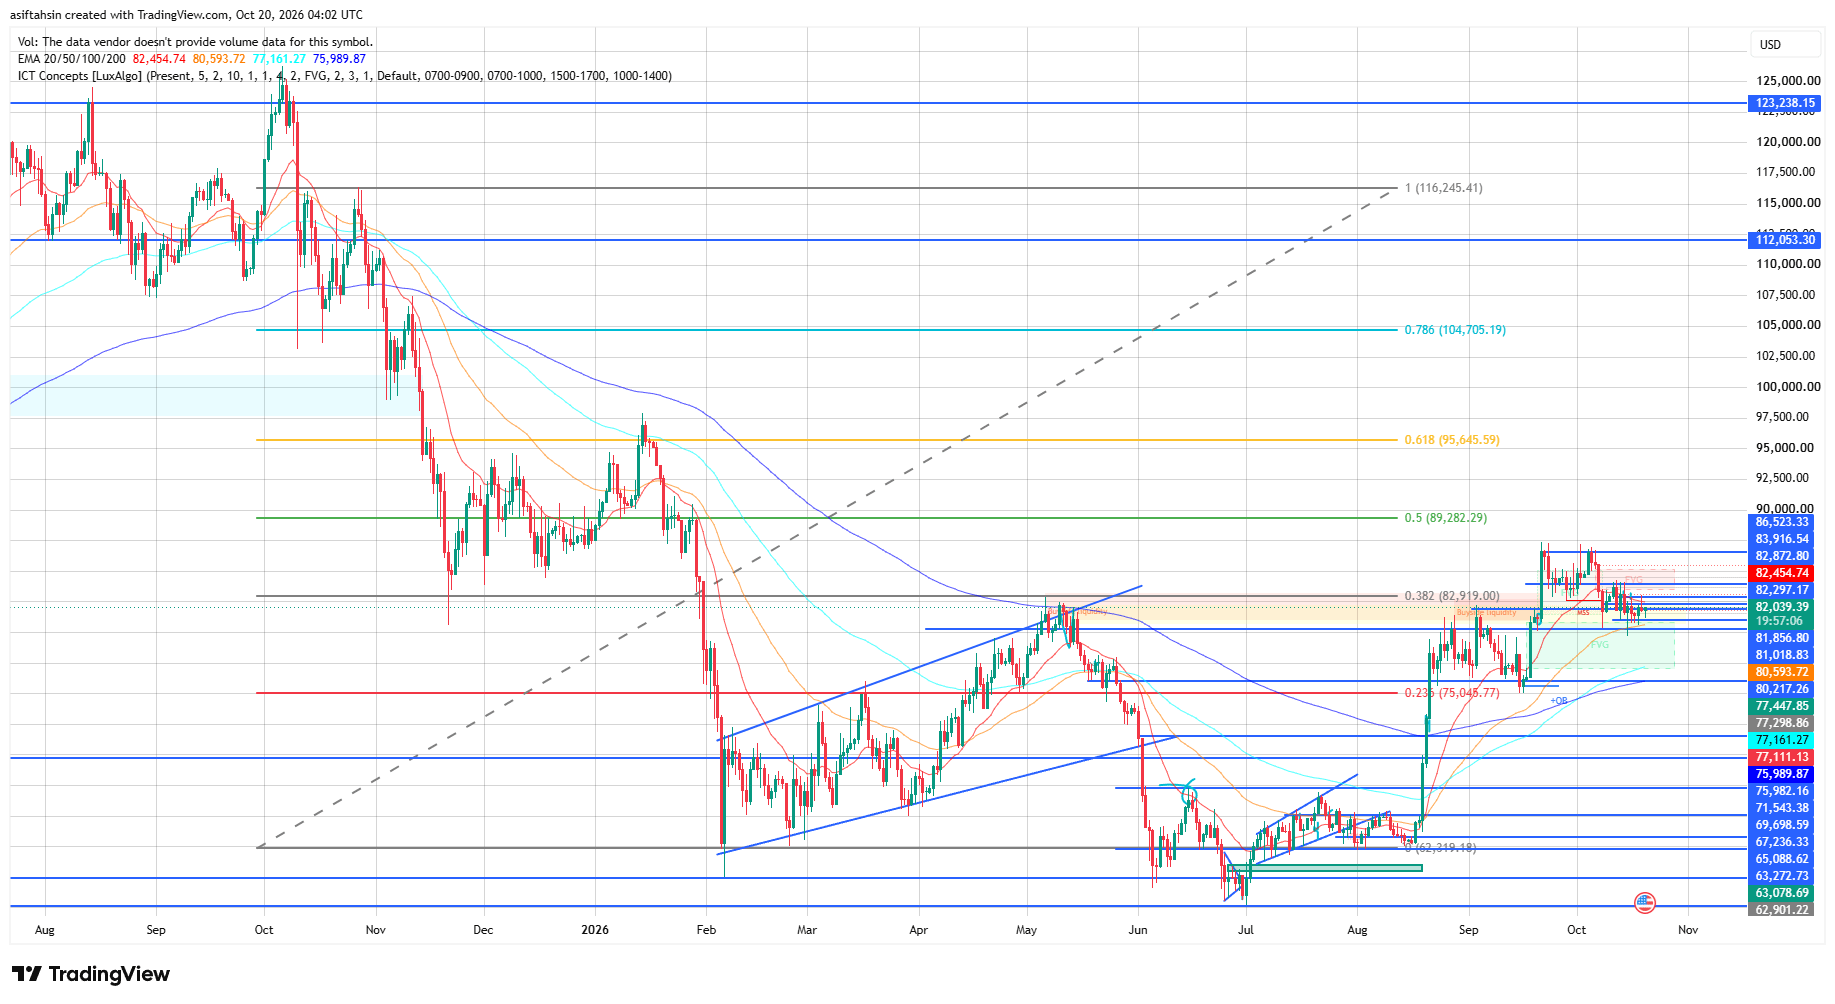
BTC has recovered strongly from the $62,900–$67,000 region, breaking out of its previous consolidation and rallying toward $83,900.
Price is now consolidating around $82,000–$82,500 after being rejected near the recent highs. The market is testing whether previous resistance can turn into support.
The broader recovery remains constructive while BTC holds above $80,217, but the price is still below the $82,919 Fibonacci level and the $83,916 resistance zone. A confirmed breakout is needed to establish stronger bullish continuation.
🔑 Key Levels
Resistance
* 🔴 $82,919
* 🔴 $83,916
* 🔴 $86,523
* 🔴 $89,282
* 🔴 $95,645
* 🔴 $104,705
Support
* 🟢 $81,856–$81,018
* 🟢 $80,594
* 🟢 $80,217
* 🟢 $77,448–$77,161
* 🟢 $75,990–$75,045
* 🟢 $71,543
🎯 Final Outlook
BTC remains neutral-to-bearish in the short term while trading below $82,919–$83,916, but the broader recovery structure is still intact above $80,217.
A sustained breakout above $83,916 could open the path toward $86,523, followed by $89,282. On the downside, losing $80,217 would increase the risk of a deeper correction toward $77,400–$75,000.
Bias: 🟡 Neutral while below $83,916 | Breakout above $86,523 → $89,282 → $95,645
Analysis based on your TradingView chart dated October 20, 2026. These are technical scenarios, not guaranteed outcomes.
