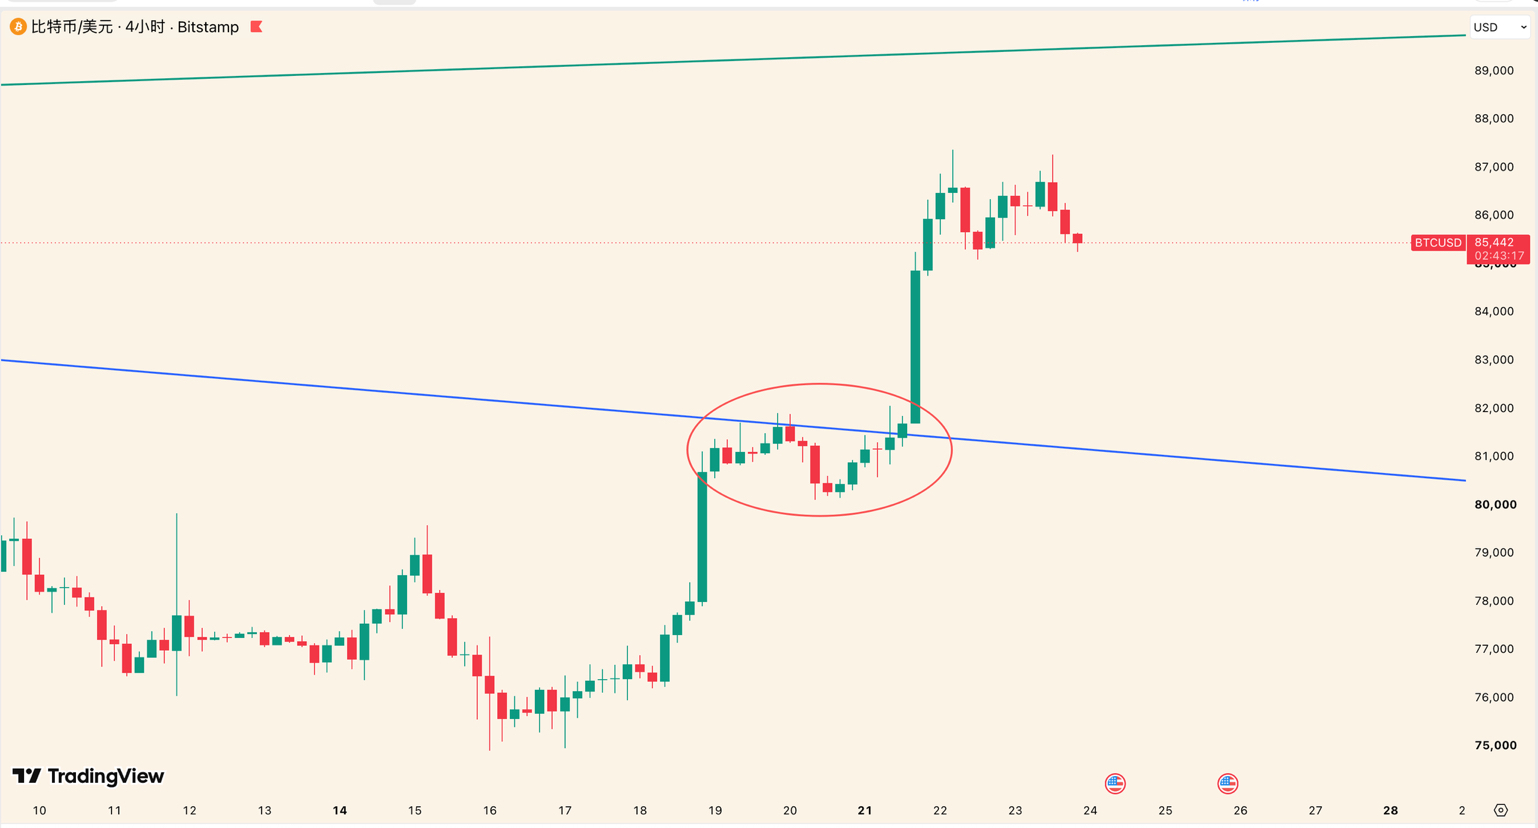
In our tweet on September 18, we said that once BTC breaks through and holds above 80,000, the entire upward adjustment covering 57,800—82,300 could be confirmed as having ended on the right side.
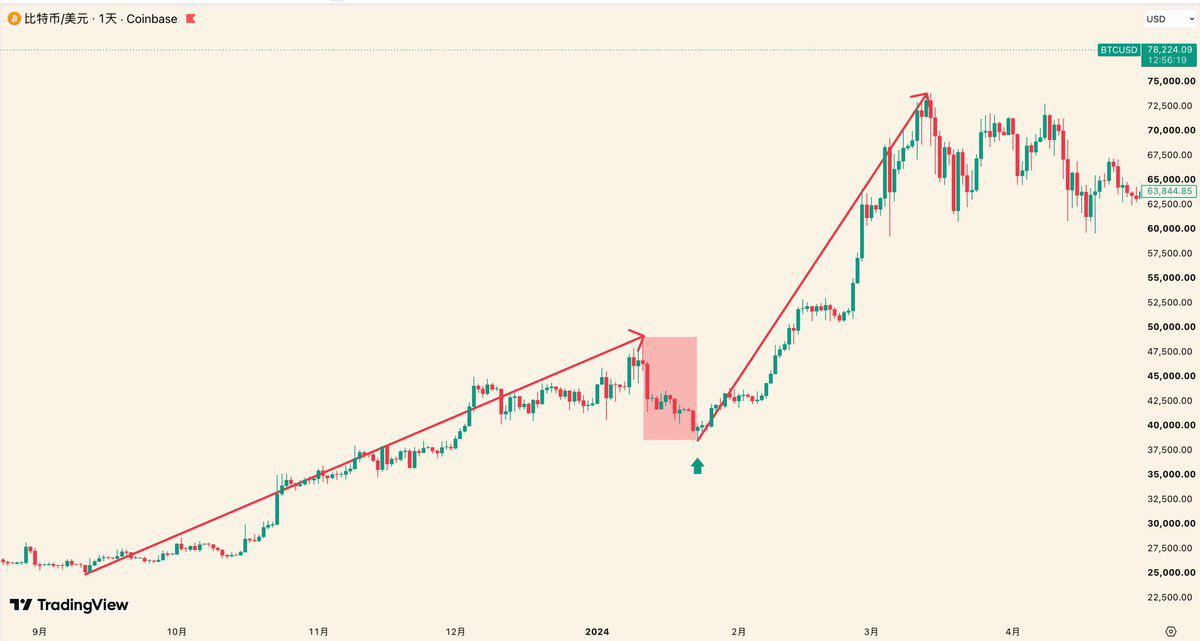
This kind of situation—where the adjustment doesn’t reach the level generally expected by the market and ends early—isn’t unfamiliar. As shown in Figure 1, we experienced an almost identical structure once in 2024.
Then on the evening of September 18, BTC not only broke through and held above 80,000, but also moved upward to break through the Gann angle line 2/1 corresponding to the entire downtrend range of 126,200—57,800. After the breakout, it also completed the support/resistance flip.
When two signals appear at the same time, it makes me even more certain that the adjustment ended earlier.
So, in my view, getting in here is not chasing the price up at all. Instead, after the trend is confirmed, it’s a very standard right-side opportunity. Therefore, on September 19, we entered BTC, ETH, CRCL, MSTR, and a host of altcoins.
In the September 20 video, I also clearly stated this viewpoint again, and explained the underlying logic in full.
Since late June, I’ve emphasized more than once that finding opportunities to build positions in batches is more important than guessing where the absolute lowest point is. Based on our judgment of the big trend, even if there are signs of a pullback after rising to 82,300, we only did not reduce our spot holdings.
Since the right-side confirmation signal has already appeared, why not get in? The reason is simple: for most people, the price at this position from September 18 to 20 is already “too high.” Everyone wants to wait for a lower low.
But the most ruthless thing about the market is exactly this: truly great opportunities often do not appear at a price that everyone finds reasonable.
The price that everyone is waiting for may not arrive; the path that everyone is taking may not lead to the right direction.
Figure Three includes an excerpt from Yu Hua (Brother)’s postscript. I think it fits very well to send to friends who missed the opportunity while waiting for a “lower price.”
Next, let’s talk about the current market situation:
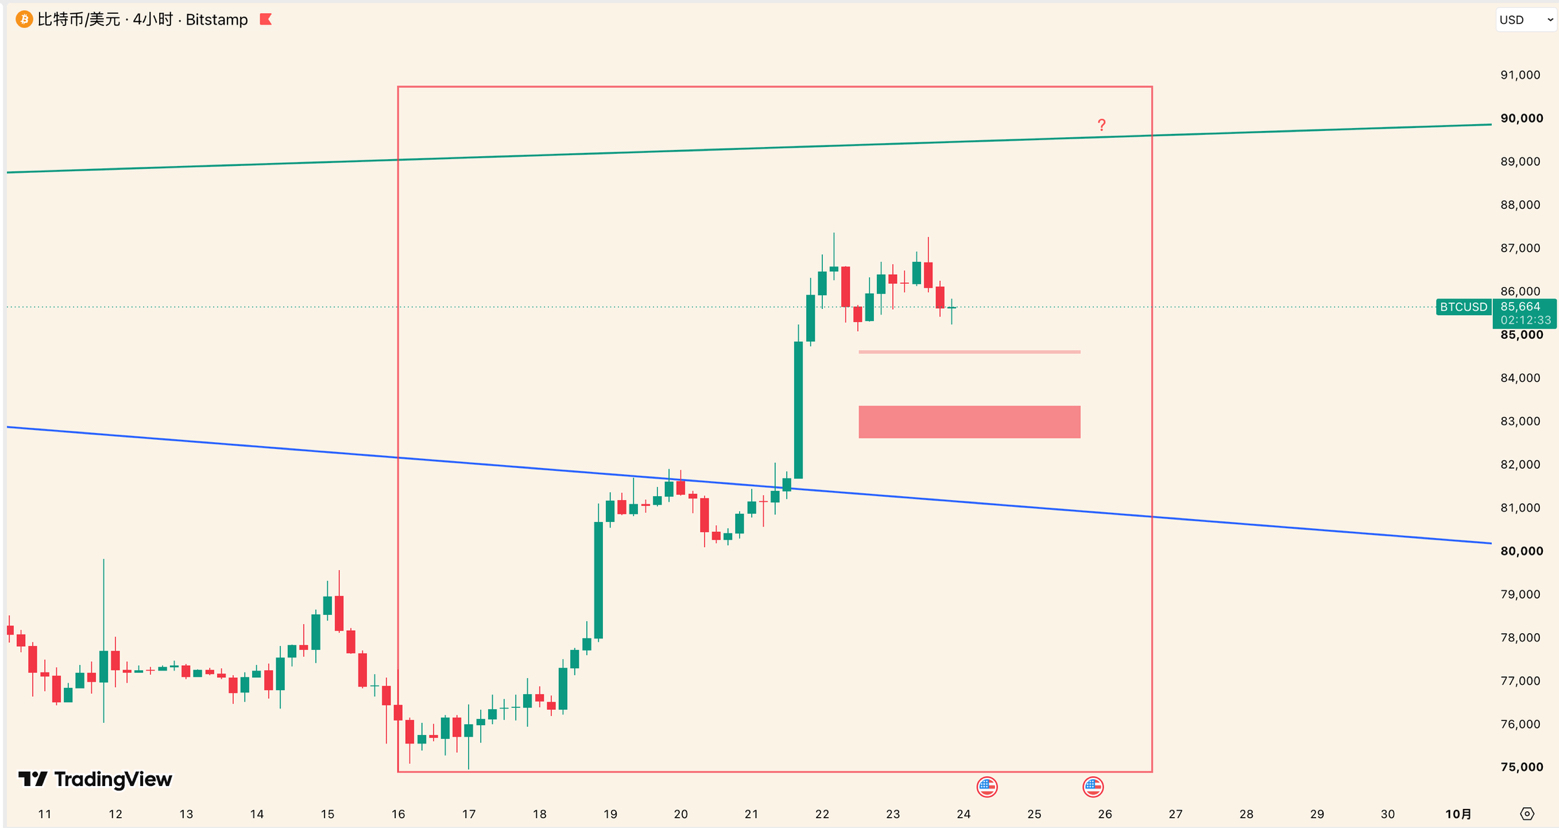
As shown in Figure 4, on the smaller timeframe, the nearest resistance level above is 89,600. Currently, the upward move still has momentum because as long as it does not fall below 84,500, this upswing has not ended yet. During this period, all the declines are only small-timeframe pullbacks within the upswing.
Only if it breaks below 84,500 should we consider it a pullback from the rise that started at 74,968. If the end point is found in the support zone 82,600–83,400 and above, that would be a strong pullback. If it breaks below here and cannot reclaim, it could be a more complex pullback. But regardless of which type it is, even if there is a subsequent pullback, once the end point of the pullback is found, the price will still rise.