【 $BTC bull market top countdown series 06】
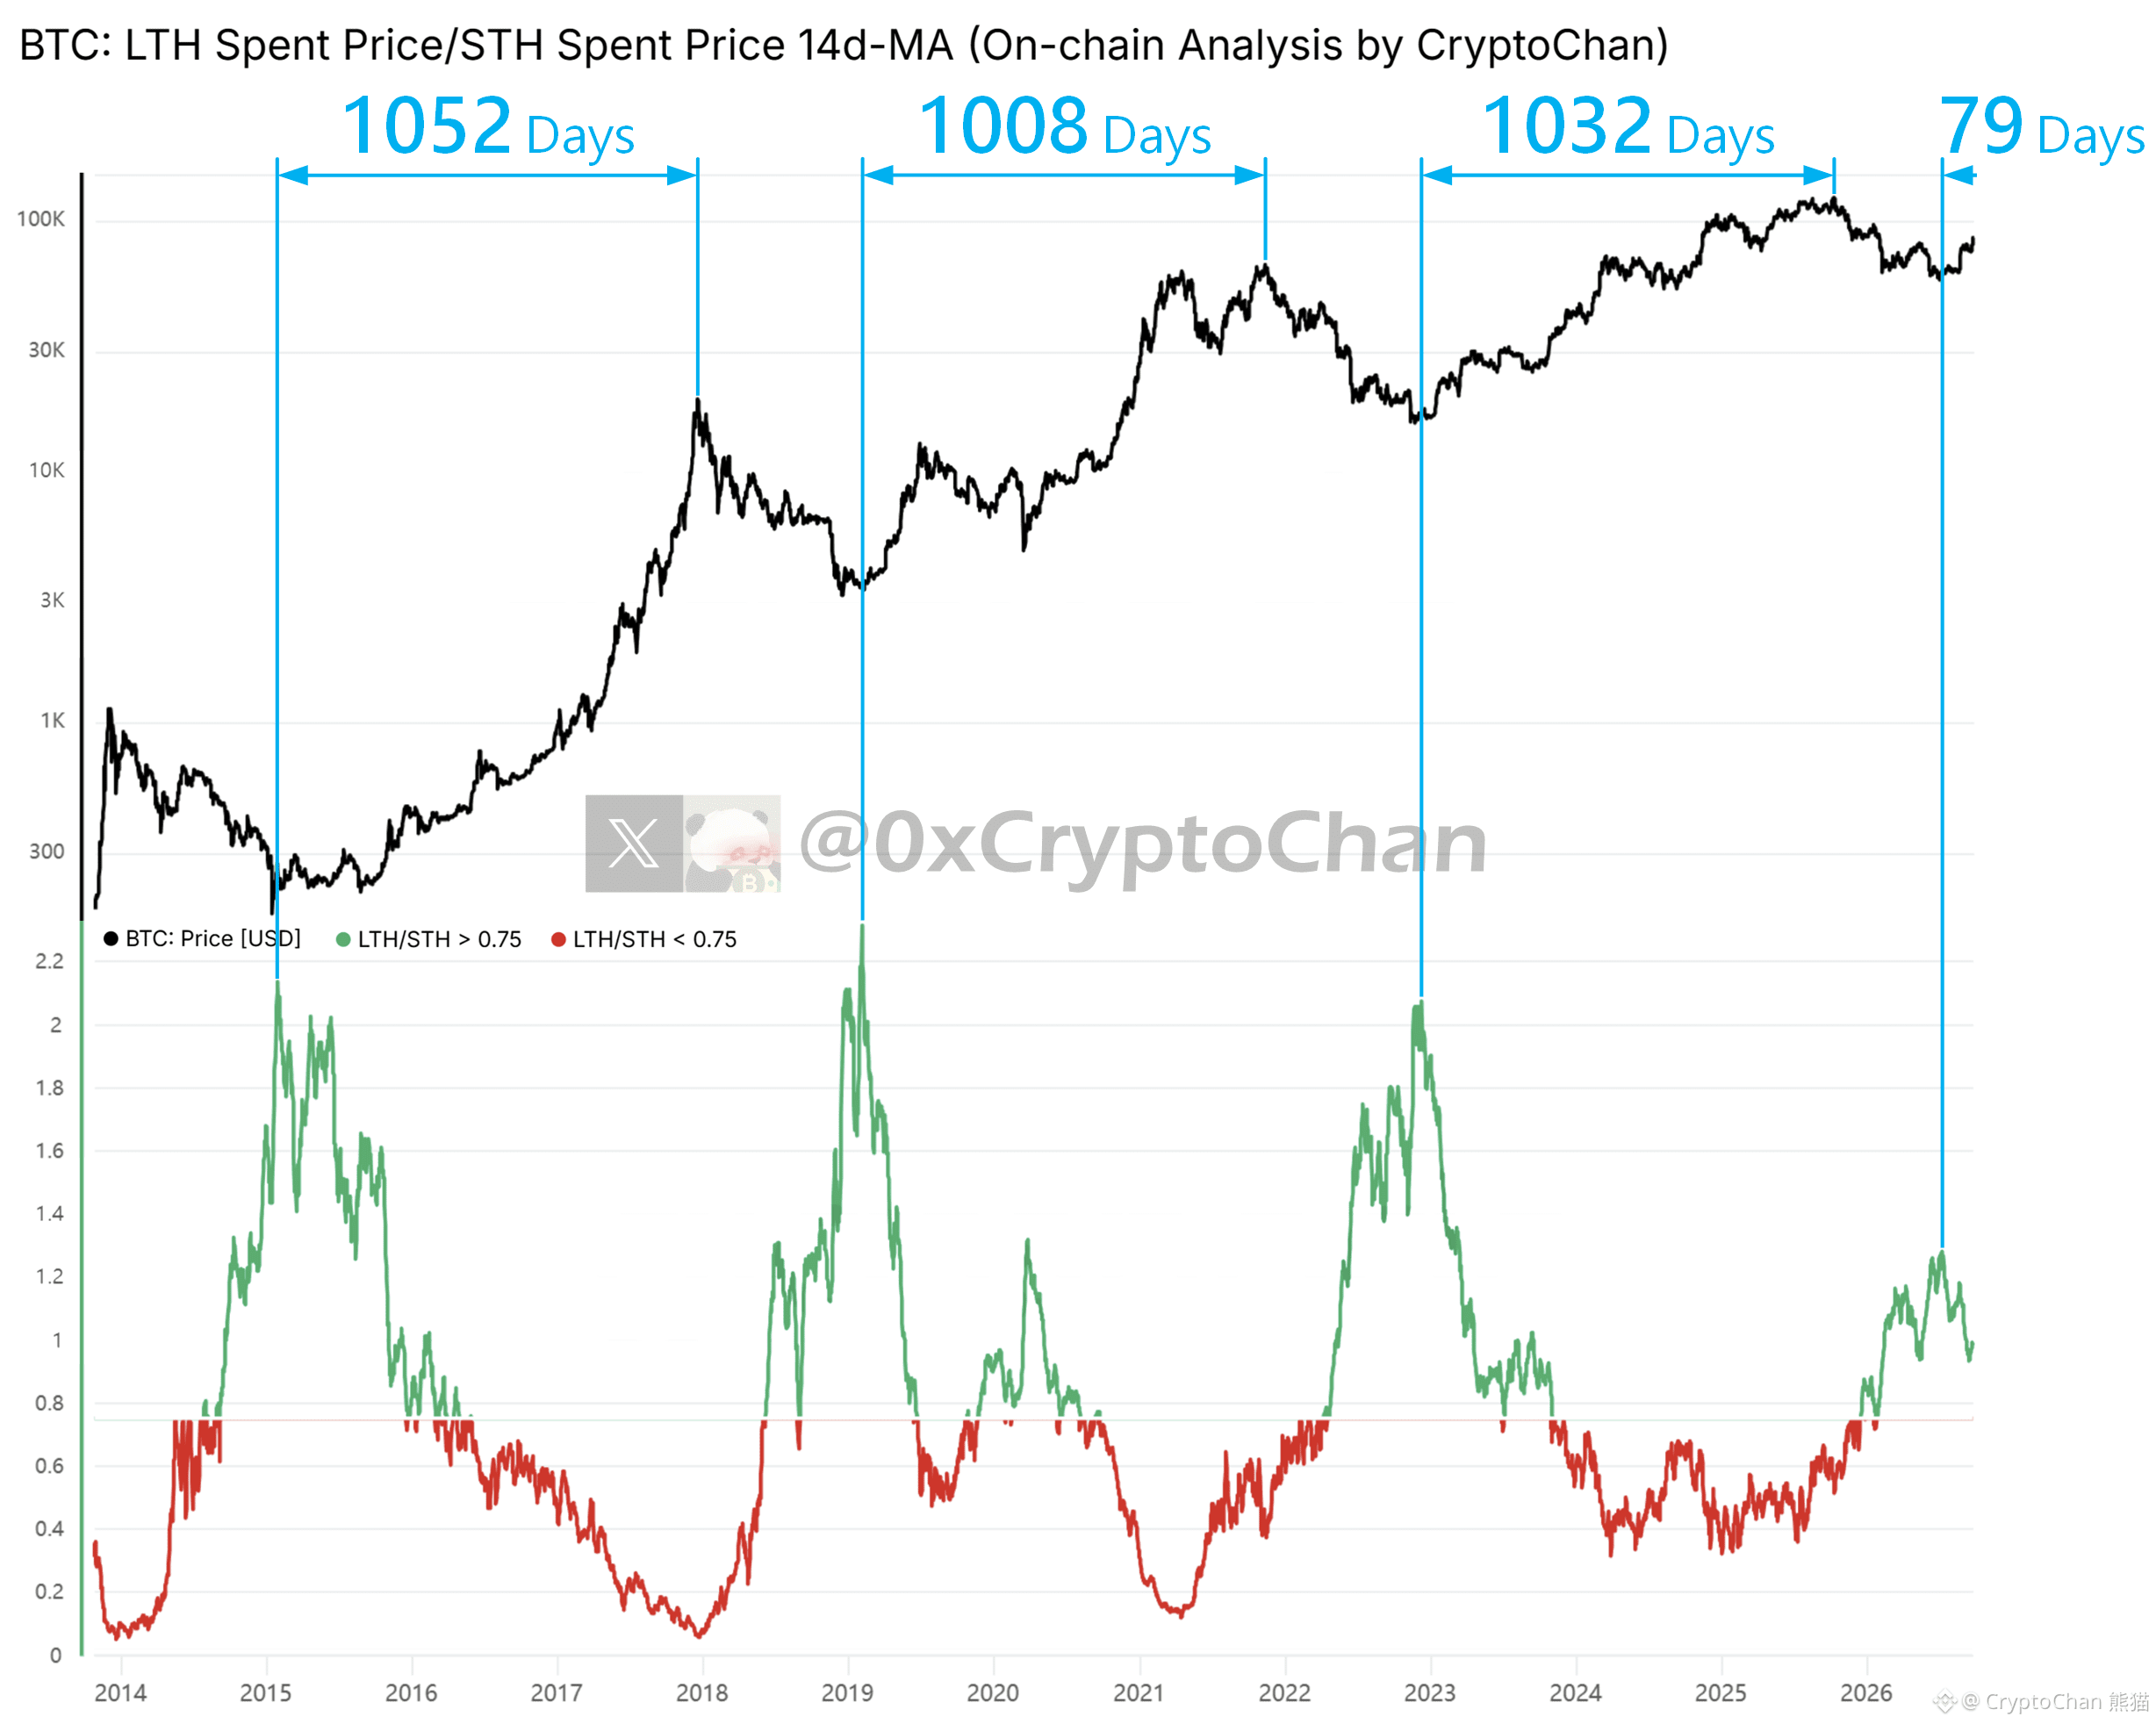
2015 bear bottom: after this indicator peaks, 1052 days until the big bull market top
2019 bear bottom: after this indicator peaks, 1008 days until the big bull market top
2022 bear bottom: after this indicator peaks, 1032 days until the big bull market top
2026 bear bottom: the indicator has already been at peak for 79 days
┌─ Indicator details ─┐
The indicator shown at the bottom of the chart is the ratio of the average purchase cost of sell-off lots by on-chain long-term and short-term holders (within the past 14 days)
2015 bear bottom: after this indicator peaks, 1052 days until the big bull market top
2019 bear bottom: after this indicator peaks, 1008 days until the big bull market top
2022 bear bottom: after this indicator peaks, 1032 days until the big bull market top
2026 bear bottom: the indicator has already been at peak for 79 days
┌─ Indicator details ─┐
The indicator shown at the bottom of the chart is the ratio of the average purchase cost of sell-off lots by on-chain long-term and short-term holders (within the past 14 days)