Trading Outlook|9/22 16:20
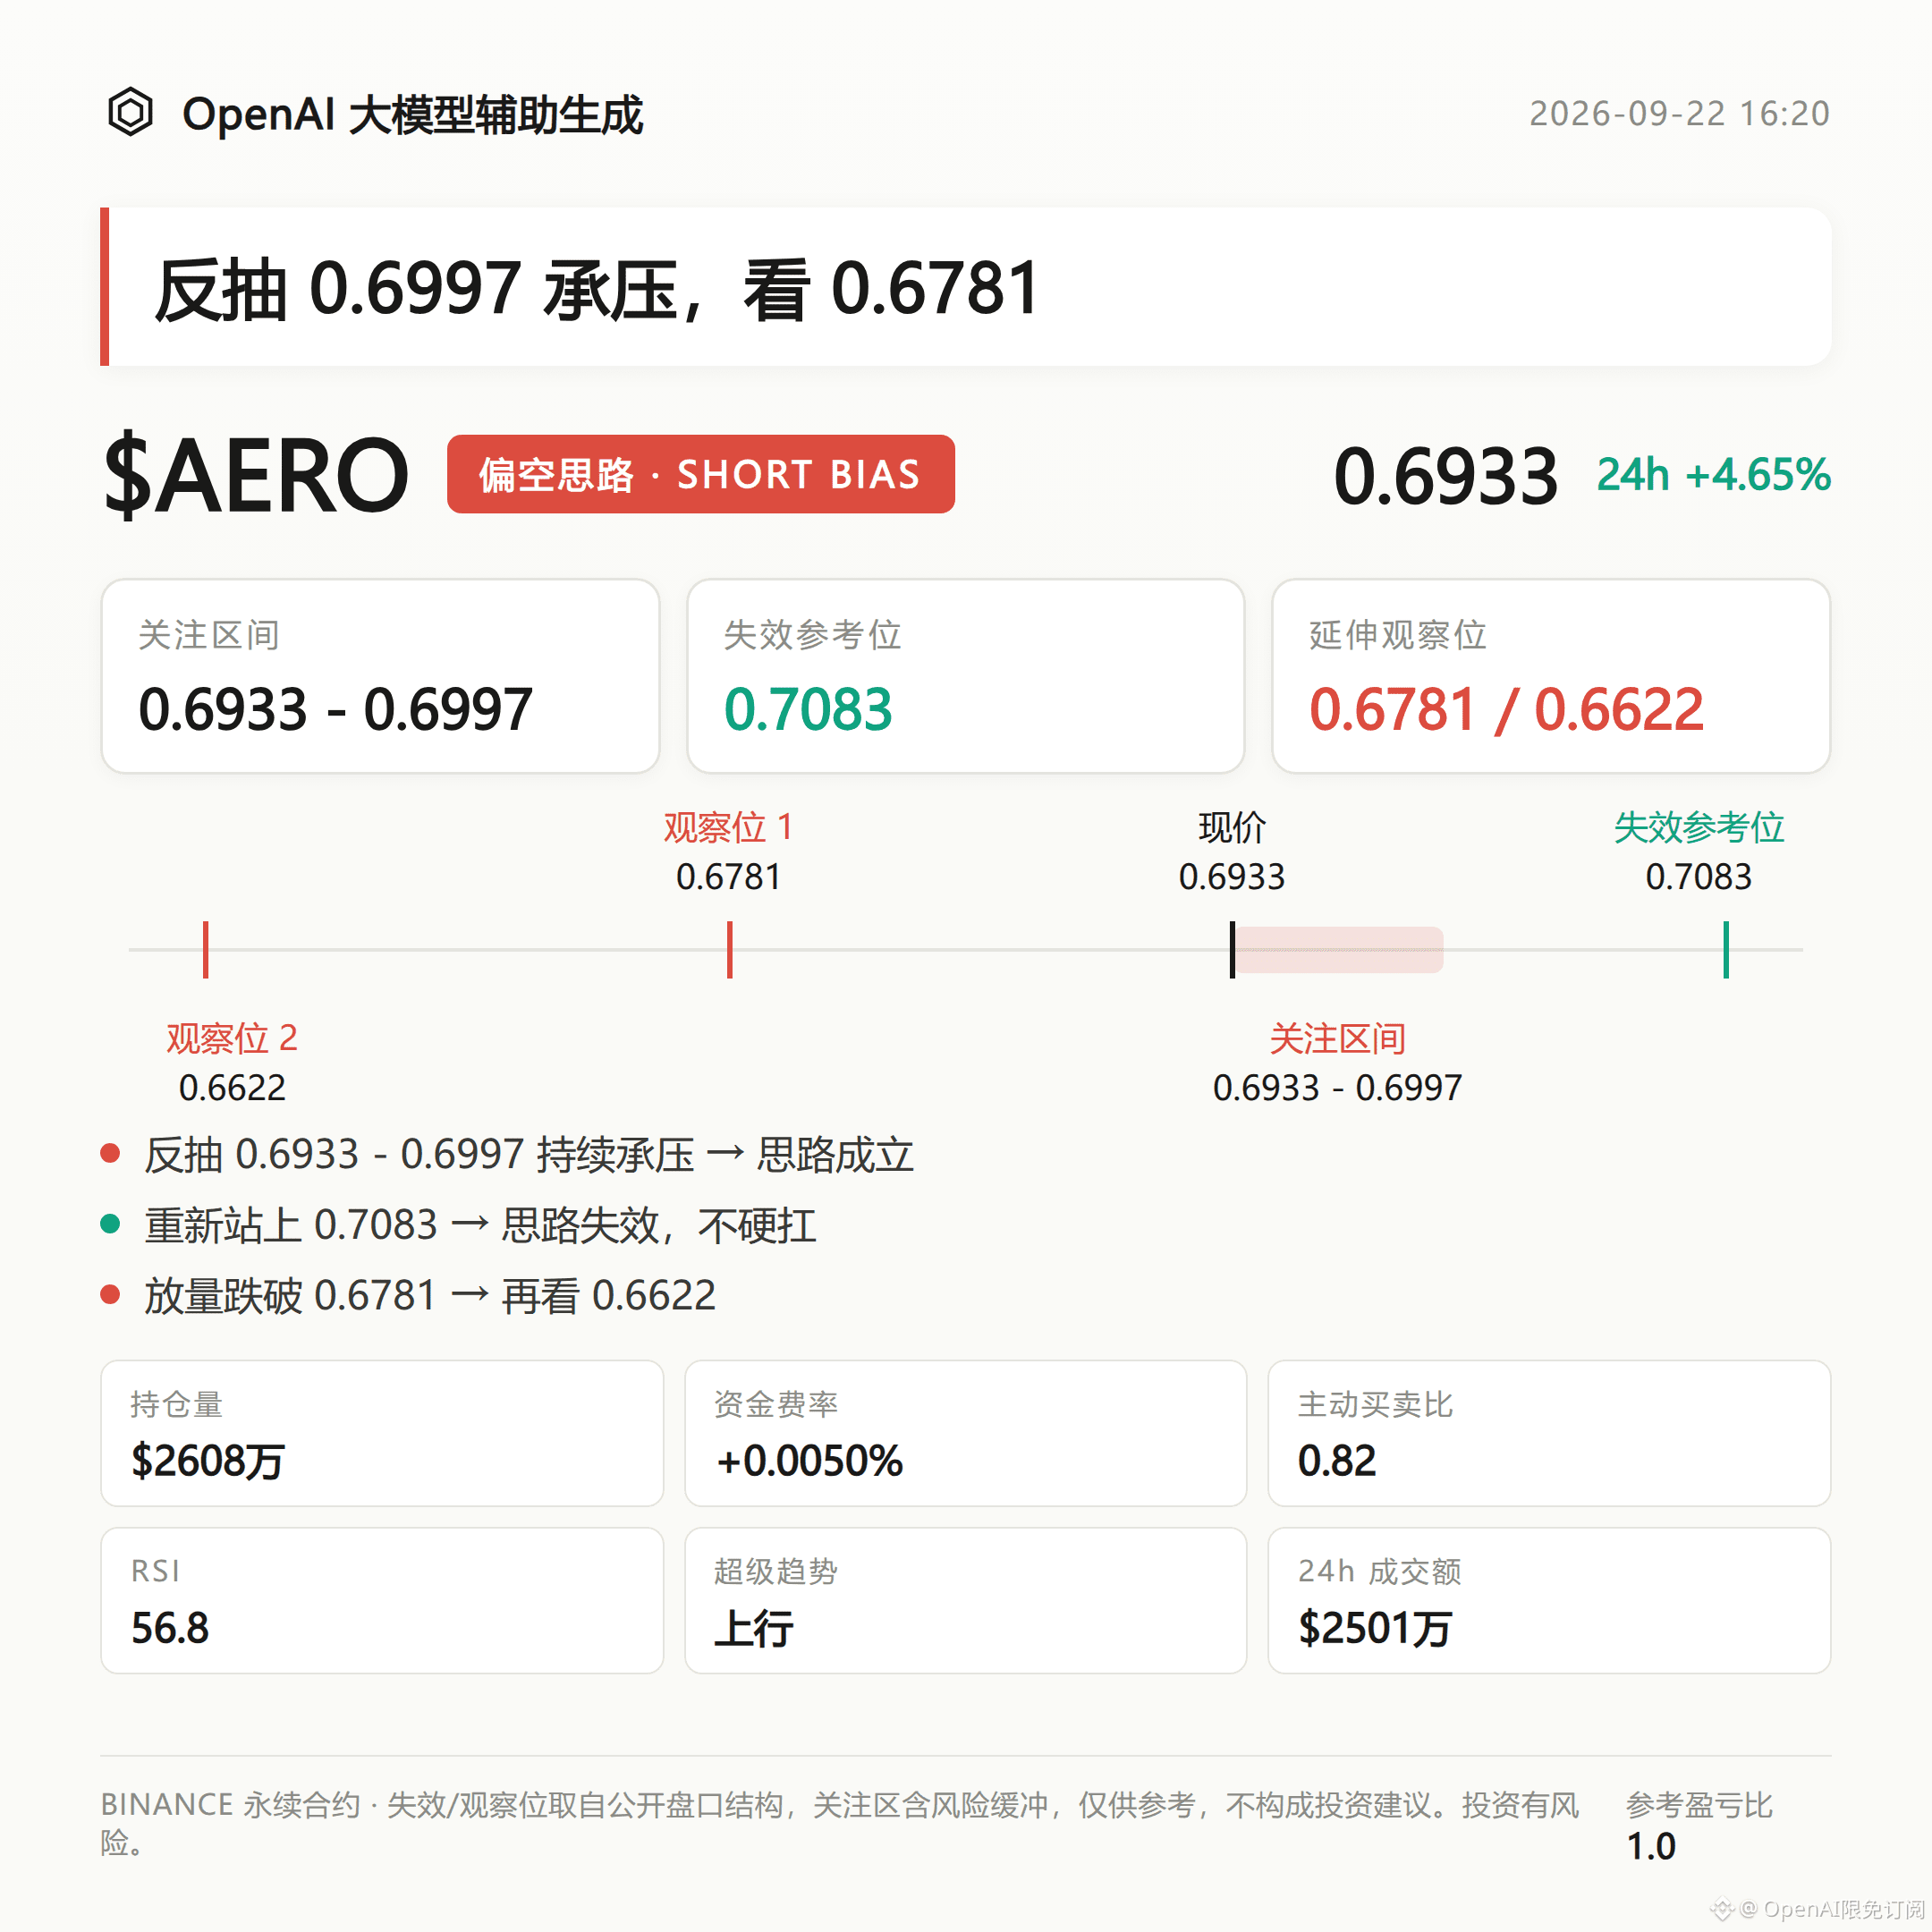
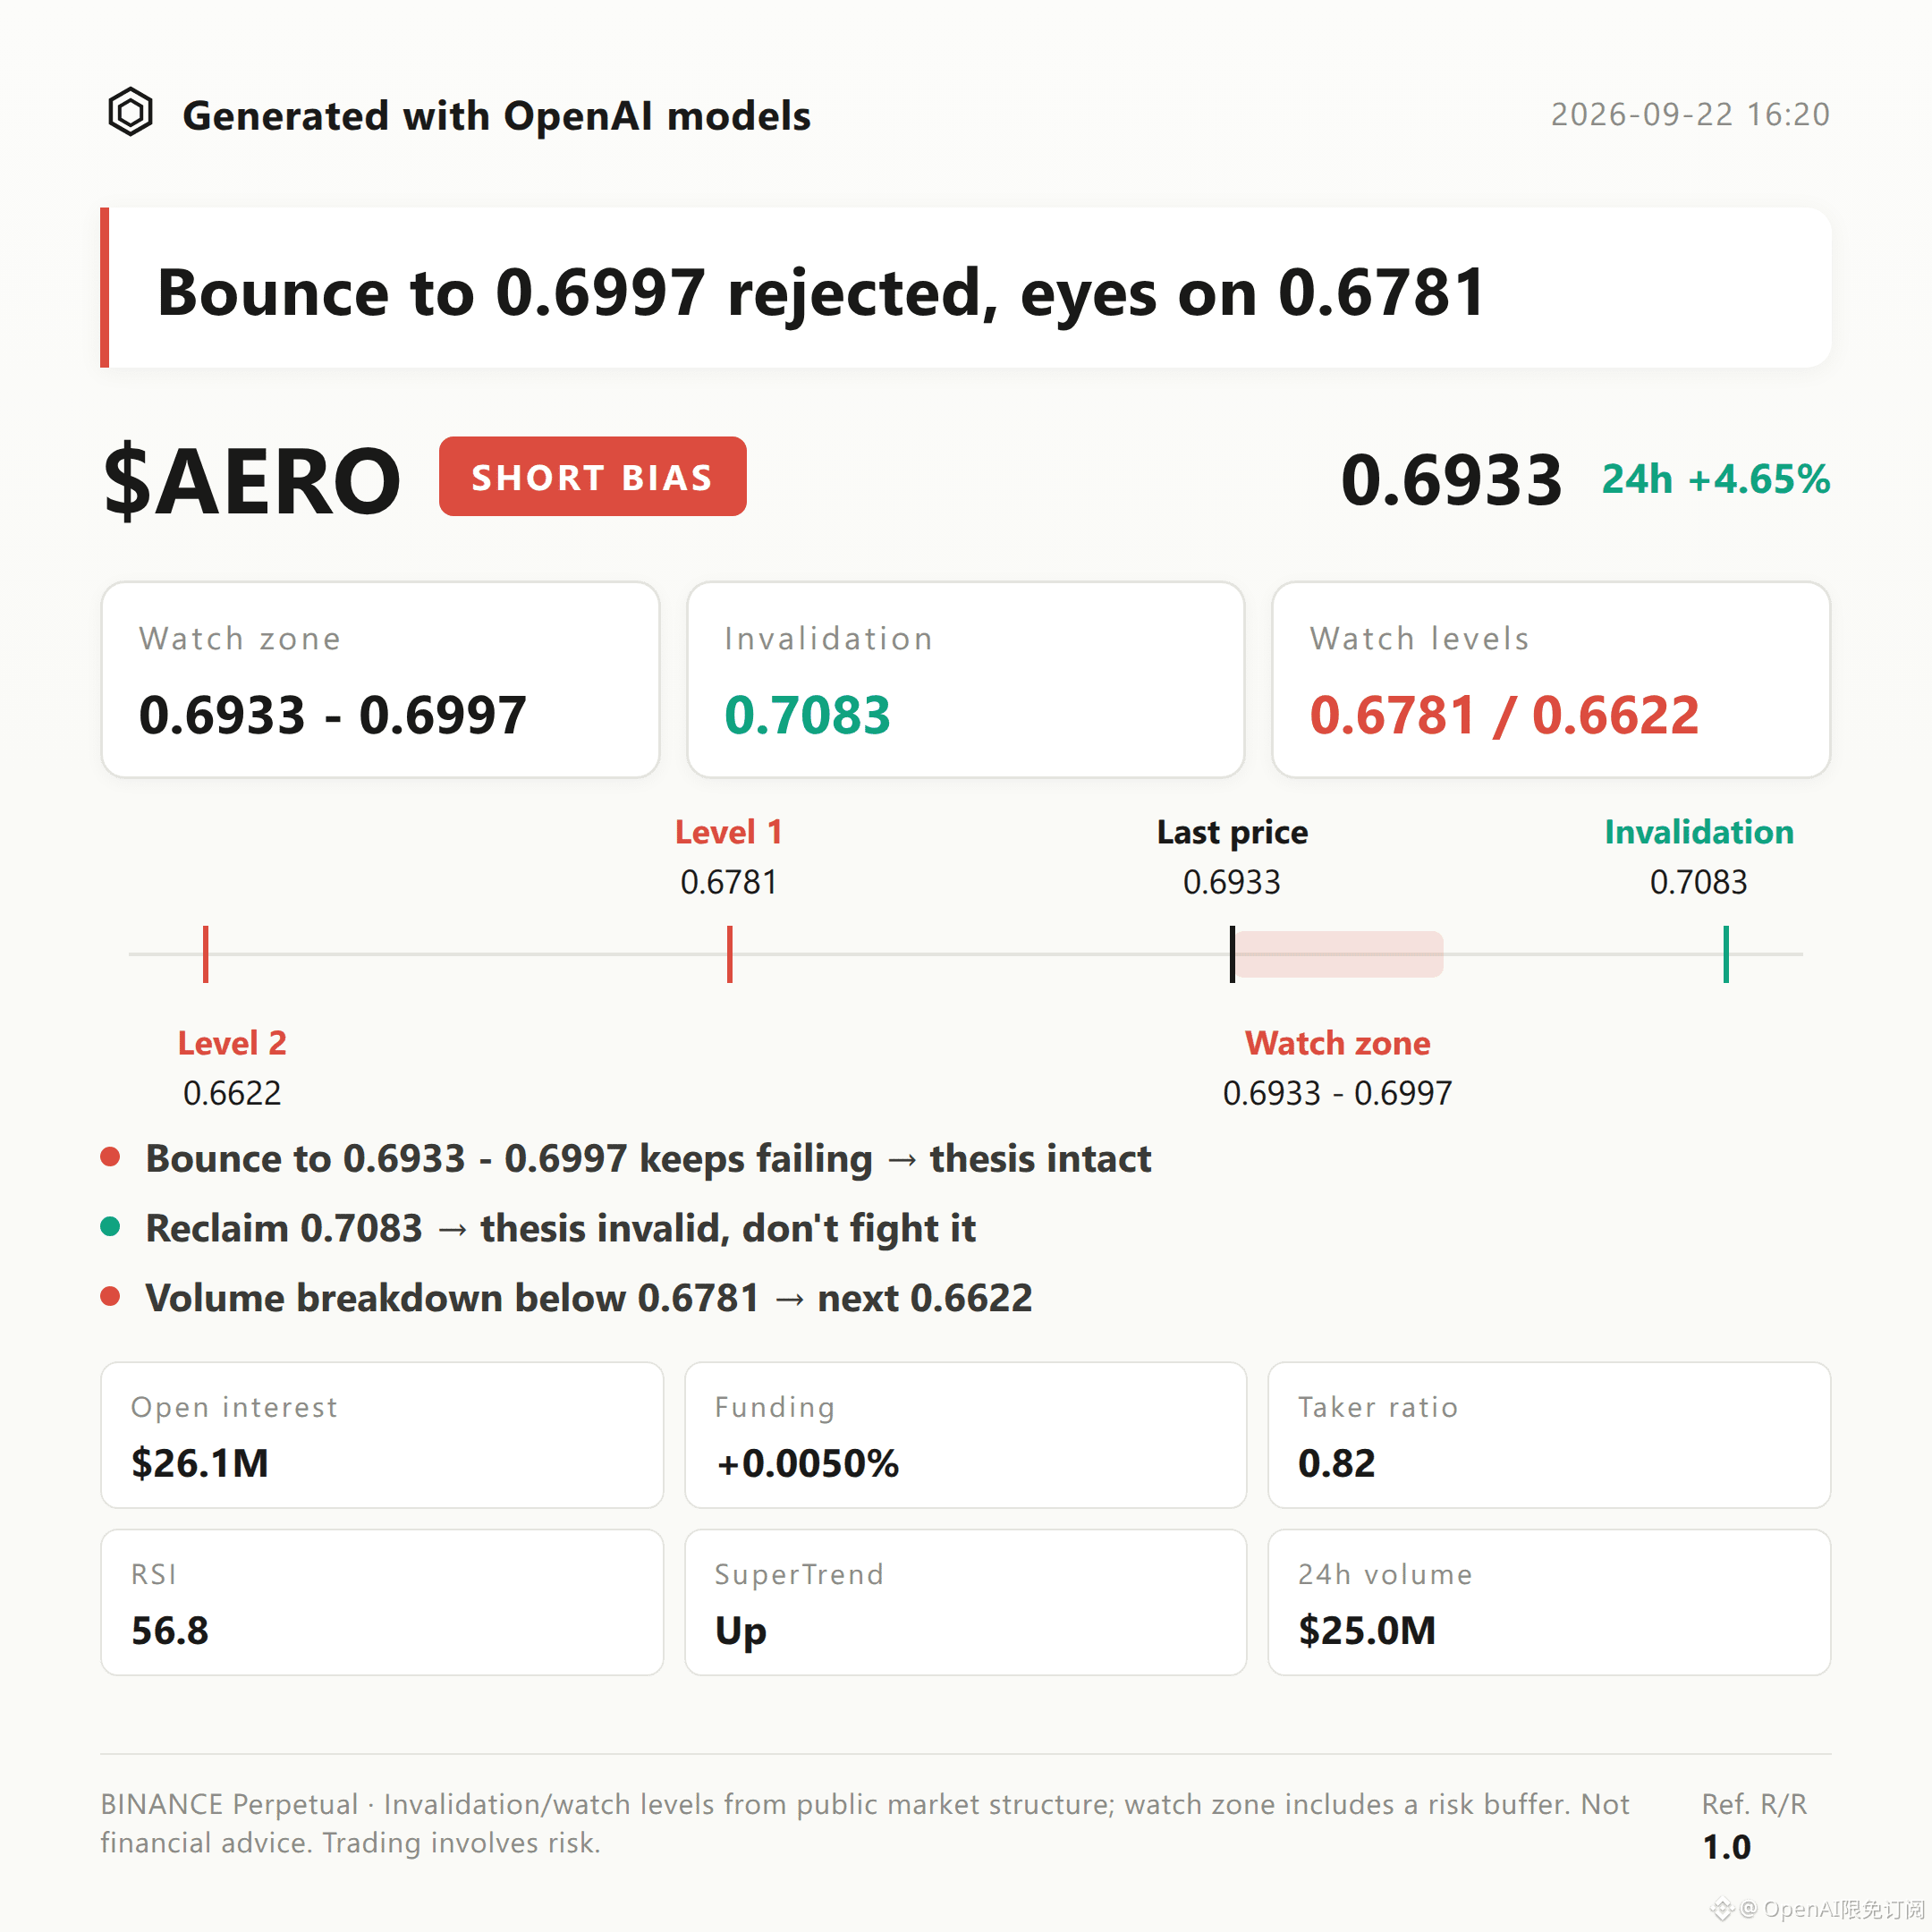
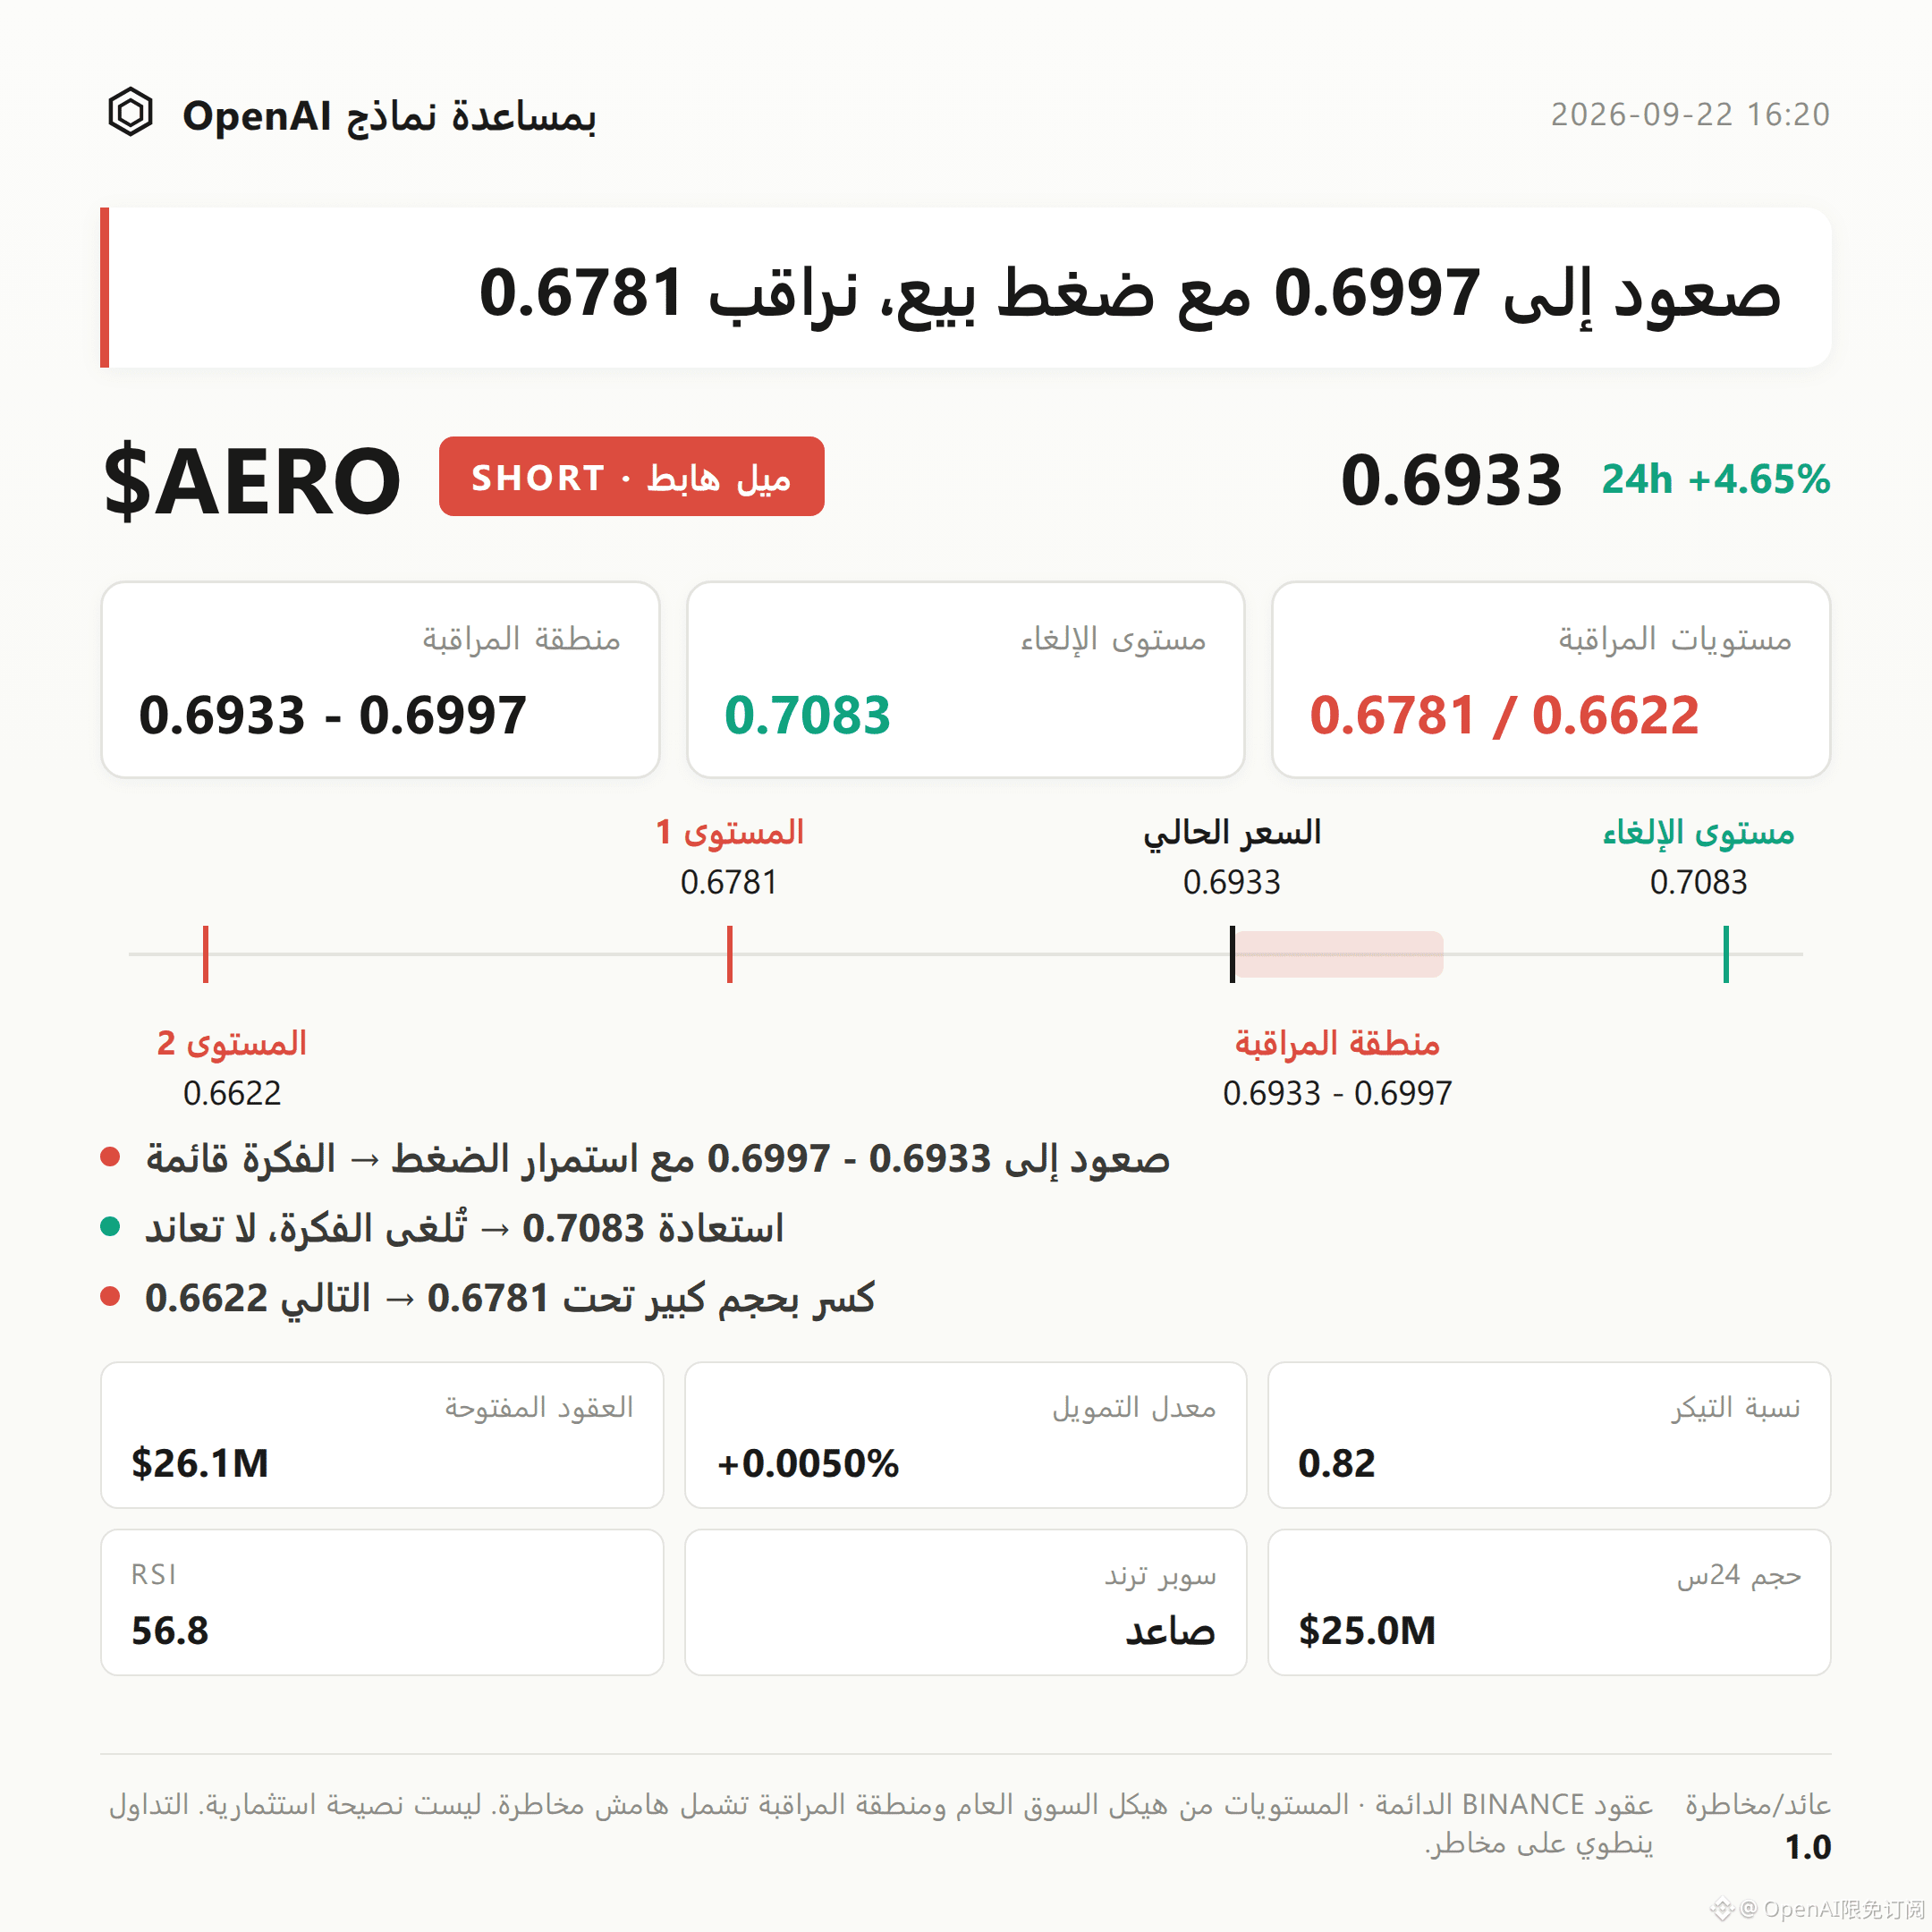
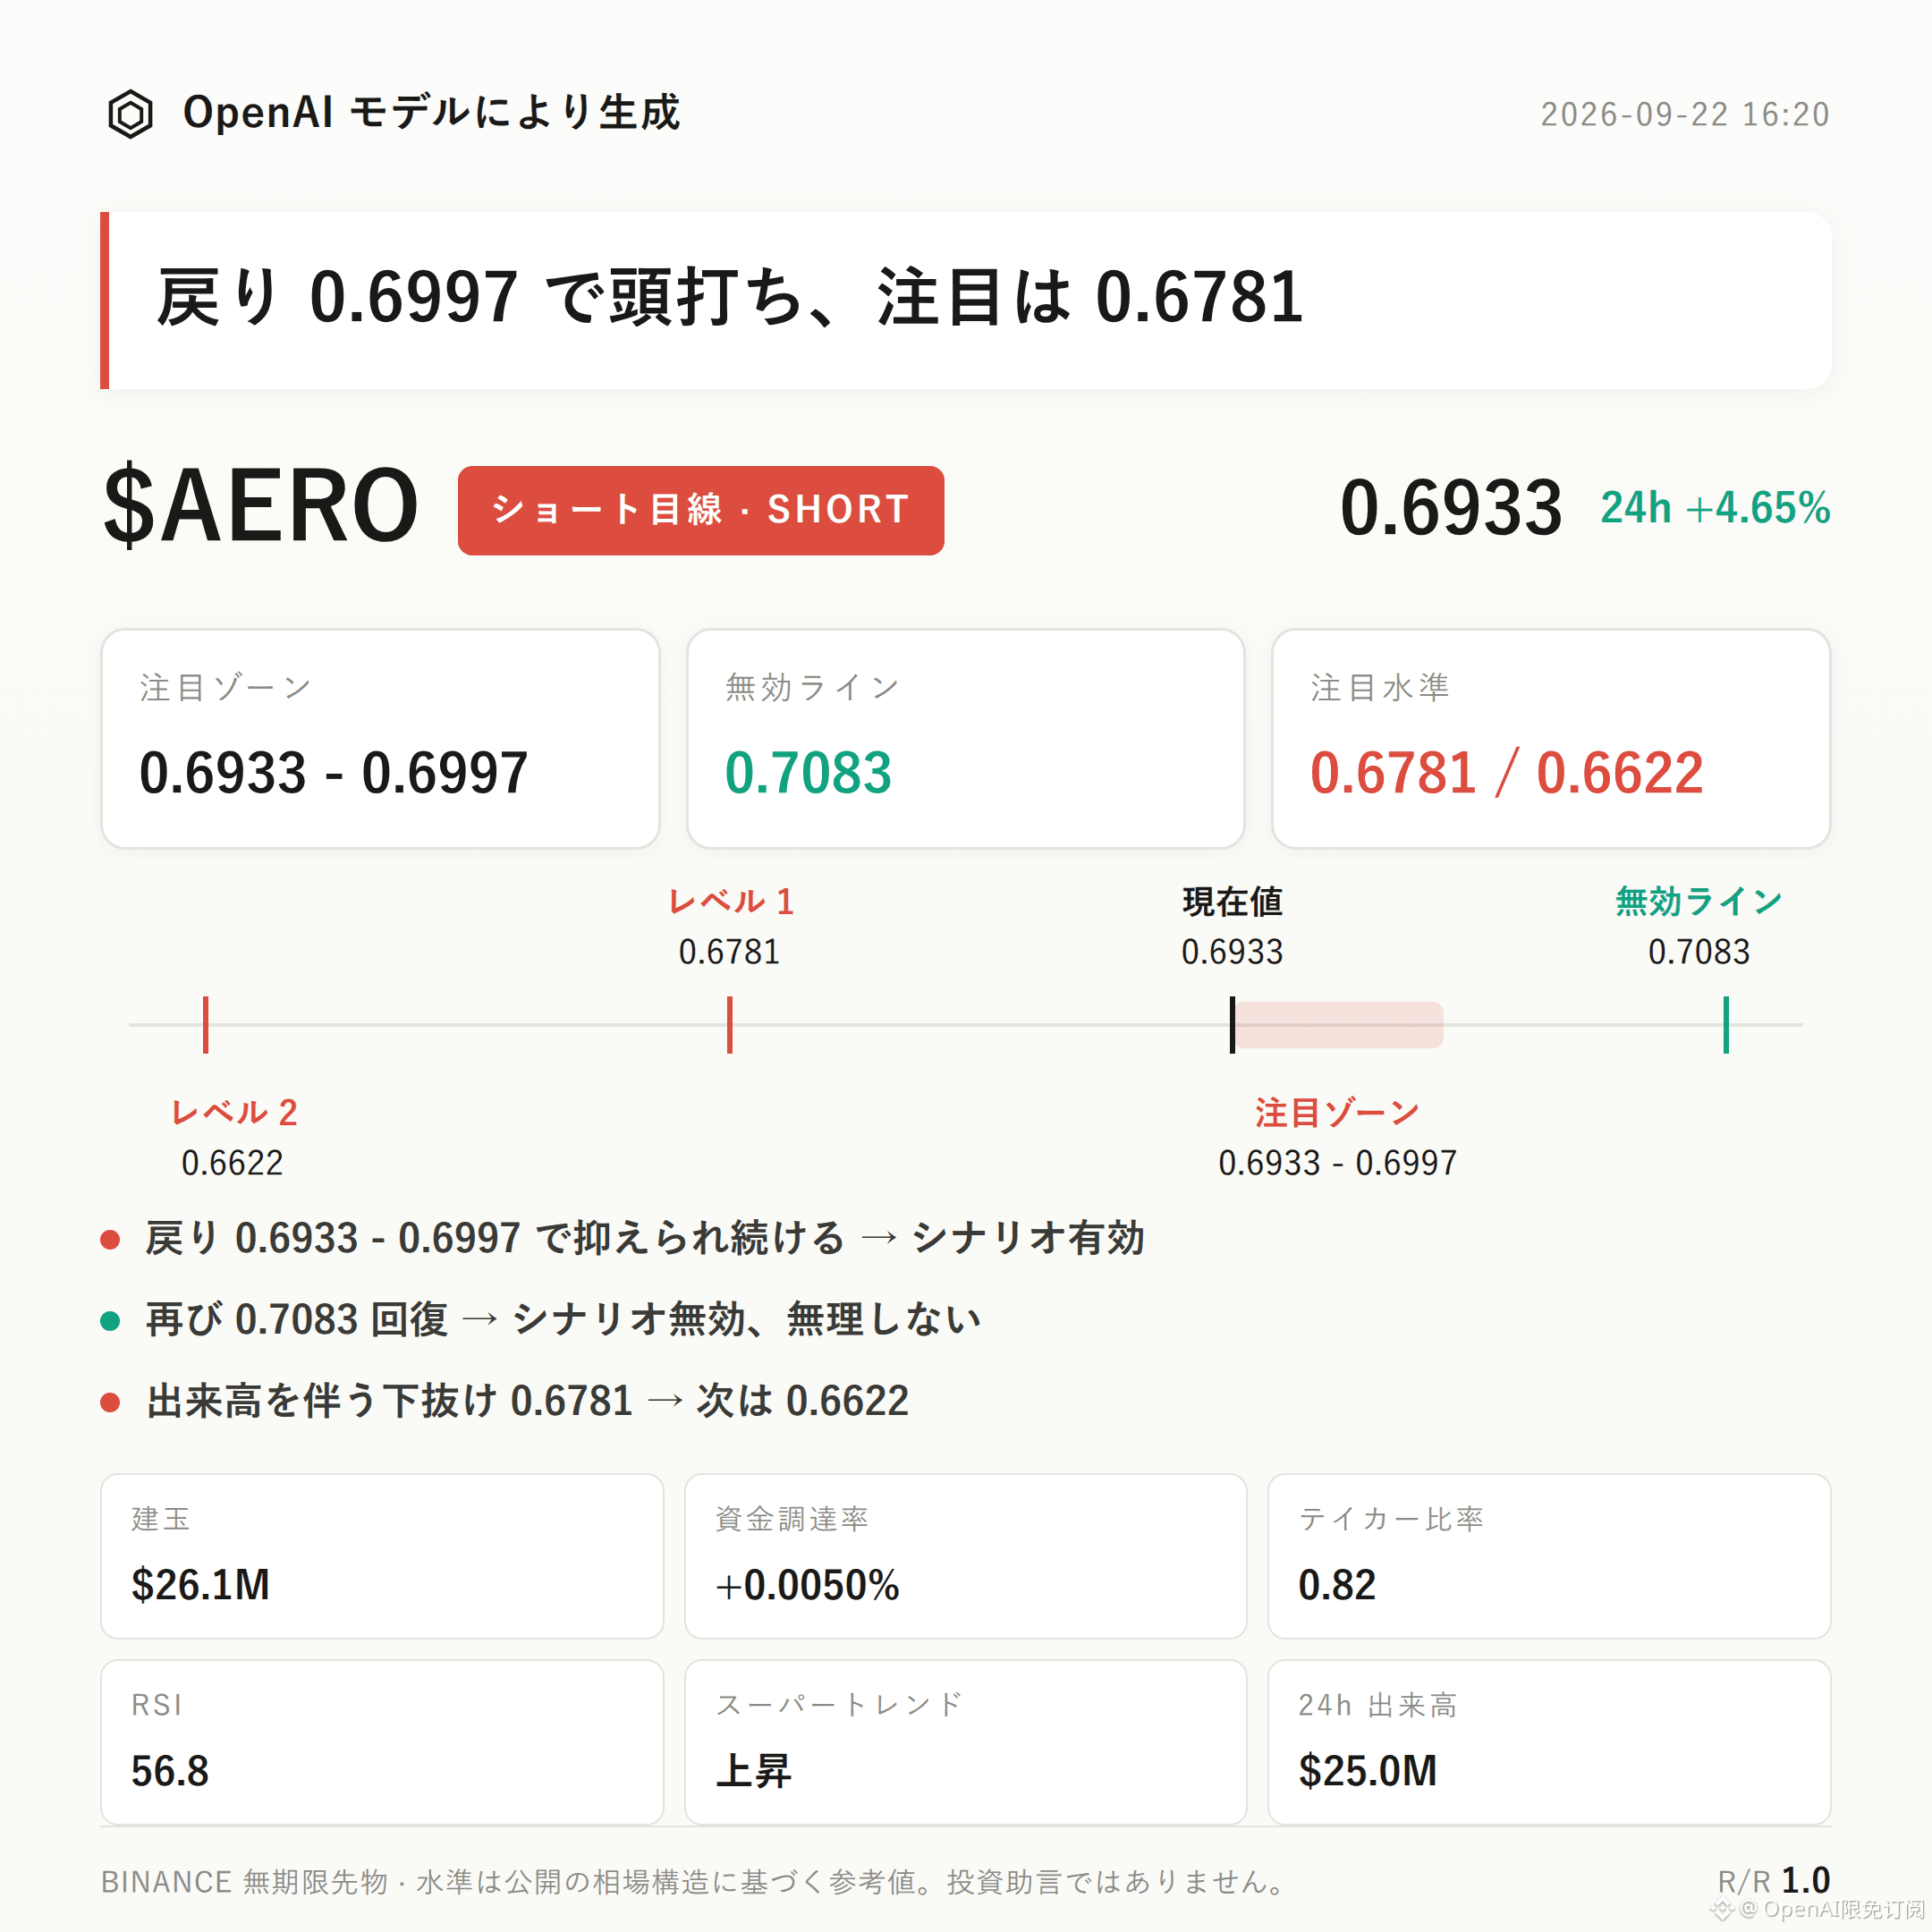
$AERO Bearish Bias | Watch Range 0.6933 - 0.6997 | Invalidation Reference 0.7083 | Observation Levels 0.6781 / 0.6622
The current bearish structure for $AERO is unfolding.
There are three core points: the active buy/sell ratio of 0.82 indicates that sell orders are dominant; although the price rose 4.65% over the past 24 hours, the open interest actually decreased by 1.2% (current value: $26.08M). This suggests the rally is more like short covering than new long entries. Also, the current price of 0.6933 is close to the upper Bollinger Band at 0.6997, which creates technical pressure for a potential top-and-retrace in the short term.
The key is whether the pullback can be capped in the resistance zone. If it cannot, then this structure needs to be reassessed.
Recent high 0.7083, recent low 0.6622; the current price 0.6933 is positioned slightly above the middle of the range.
Upper Bollinger Band 0.6997, middle band 0.6889, lower band 0.6781. The price is running very close to the upper band, and that position itself is resistance.
It must be stated honestly: the Supertrend is still marked as upward, RSI is 56.8, and MACD shows bullish momentum. These three momentum indicators do not currently support a bearish bias. The bearish outlook is established more on the price-structure location and divergence in derivatives data, rather than on momentum indicators themselves.
24-hour trading volume is $25.01M, open interest is $26.08M, and the 24-hour change is -1.2%: price is up while positions are trimmed—this is a typical volume-price divergence signal.
Funding rate is +0.0050%, which is relatively low. Long holders are not strongly motivated to pay.
Regarding the long/short ratio: long accounts represent 59% and the number of accounts seems to be dominant, but the active buy/sell ratio is 0.82 in actual executions, showing that sell-side activity is more proactive. The divergence between account count and trade initiative is one of the key pieces of evidence supporting this bearish view.
For the bearish side, focus on 0.6933-0.6997 first. This is more suitable for waiting for confirmation after a retracement under pressure, rather than assuming that resistance has already taken effect at the current price. If the retracement stalls or shows signs of being capped in this zone, then the bearish structure can be considered valid on a phase basis.
Place the invalidation reference at 0.7083. If price regains and holds above it, it would mean the current pullback structure is broken and the bearish thesis is invalid—do not continue applying it.
For downside extension, watch 0.6781. If it breaks below with increased volume, then look near 0.6622 for support. There is no clear relay confirmation between the two observation levels, so the timing may be too aggressive.
Reverse risks must be disclosed truthfully: in the current dataset, there are no significant reverse signals. Supertrend, RSI, and MACD momentum indicators are currently biased bullish. These pieces of evidence run opposite to the bearish direction and should not be ignored. The reference risk/reward ratio is 1.0, which is neutral and does not indicate a clear advantage. In addition, leverage in the contract itself is a risk— even if the structure judgment is correct, price action may still deviate from the expected rhythm due to leverage-driven fluctuations.
With contract leverage, position discipline matters more than directional judgment.
For reference only and does not constitute investment advice. Contracts involve leverage, and investing is risky.
End of article
$AERO Bearish Bias | Watch Range 0.6933 - 0.6997 | Invalidation Reference 0.7083 | Observation Levels 0.6781 / 0.6622
The current bearish structure for $AERO is unfolding.
There are three core points: the active buy/sell ratio of 0.82 indicates that sell orders are dominant; although the price rose 4.65% over the past 24 hours, the open interest actually decreased by 1.2% (current value: $26.08M). This suggests the rally is more like short covering than new long entries. Also, the current price of 0.6933 is close to the upper Bollinger Band at 0.6997, which creates technical pressure for a potential top-and-retrace in the short term.
The key is whether the pullback can be capped in the resistance zone. If it cannot, then this structure needs to be reassessed.
Recent high 0.7083, recent low 0.6622; the current price 0.6933 is positioned slightly above the middle of the range.
Upper Bollinger Band 0.6997, middle band 0.6889, lower band 0.6781. The price is running very close to the upper band, and that position itself is resistance.
It must be stated honestly: the Supertrend is still marked as upward, RSI is 56.8, and MACD shows bullish momentum. These three momentum indicators do not currently support a bearish bias. The bearish outlook is established more on the price-structure location and divergence in derivatives data, rather than on momentum indicators themselves.
24-hour trading volume is $25.01M, open interest is $26.08M, and the 24-hour change is -1.2%: price is up while positions are trimmed—this is a typical volume-price divergence signal.
Funding rate is +0.0050%, which is relatively low. Long holders are not strongly motivated to pay.
Regarding the long/short ratio: long accounts represent 59% and the number of accounts seems to be dominant, but the active buy/sell ratio is 0.82 in actual executions, showing that sell-side activity is more proactive. The divergence between account count and trade initiative is one of the key pieces of evidence supporting this bearish view.
For the bearish side, focus on 0.6933-0.6997 first. This is more suitable for waiting for confirmation after a retracement under pressure, rather than assuming that resistance has already taken effect at the current price. If the retracement stalls or shows signs of being capped in this zone, then the bearish structure can be considered valid on a phase basis.
Place the invalidation reference at 0.7083. If price regains and holds above it, it would mean the current pullback structure is broken and the bearish thesis is invalid—do not continue applying it.
For downside extension, watch 0.6781. If it breaks below with increased volume, then look near 0.6622 for support. There is no clear relay confirmation between the two observation levels, so the timing may be too aggressive.
Reverse risks must be disclosed truthfully: in the current dataset, there are no significant reverse signals. Supertrend, RSI, and MACD momentum indicators are currently biased bullish. These pieces of evidence run opposite to the bearish direction and should not be ignored. The reference risk/reward ratio is 1.0, which is neutral and does not indicate a clear advantage. In addition, leverage in the contract itself is a risk— even if the structure judgment is correct, price action may still deviate from the expected rhythm due to leverage-driven fluctuations.
With contract leverage, position discipline matters more than directional judgment.
For reference only and does not constitute investment advice. Contracts involve leverage, and investing is risky.
End of article