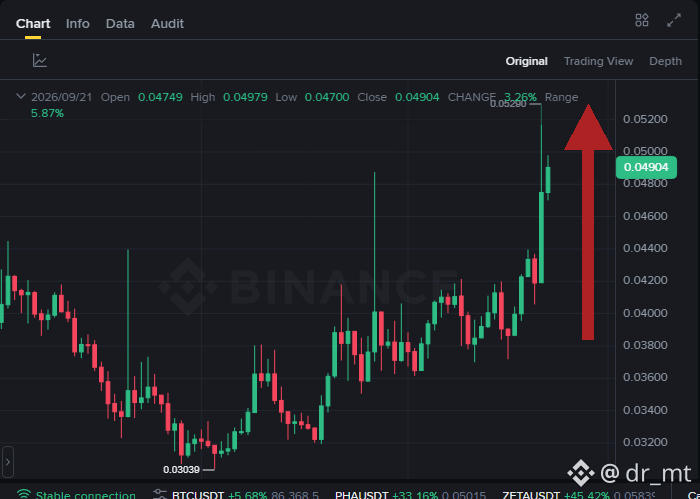
$KERNEL **A Fast Break Above 0.04850, but the First Retest Will Tell the Truth**
just punched through the 15M ceiling at 0.04850 and pushed into the 0.04905 entry zone. That puts $KERNEL move 1.1340% above resistance — enough to show intent, but not so stretched that a pullback would be unusual. The candle on the chart is strong, and buyers are clearly the ones pressing here.
The big factor is volume: 12.70x the recent average is not thin participation. That kind of activity gives breakout real backing, so this looks like more than a random wick above a level. Still, after a sharp shove like this, a retest of 0.04850 would be normal. If buyers defend that area and price can hold back above 0.04905, continuation becomes easier to trust.
Failure would likely come from a quick slip back under 0.04850, especially if the follow-through candles lose momentum and volume cools off. That would tell you breakout was too hot to hold. On the upside, the trade map is TP1: 0.04964, TP2: 0.05022, and TP3: 0.05081, with SL: 0.04846 keeping the line clean.
The 4H chart adds useful context: resistance at 0.05290 sits above this push, so there is room for the move to breathe if buyers stay active. Bigger-picture support at 0.04057 also shows the broader trend is still giving breakout a healthy base. A staged approach makes sense here — and a stretched candle is usually better respected than chased.
Trade $KERNEL here with a plan, not panic.
#Crypto #Trading #Binance
DYOR
Follow me
dr_mt
just punched through the 15M ceiling at 0.04850 and pushed into the 0.04905 entry zone. That puts $KERNEL move 1.1340% above resistance — enough to show intent, but not so stretched that a pullback would be unusual. The candle on the chart is strong, and buyers are clearly the ones pressing here.
The big factor is volume: 12.70x the recent average is not thin participation. That kind of activity gives breakout real backing, so this looks like more than a random wick above a level. Still, after a sharp shove like this, a retest of 0.04850 would be normal. If buyers defend that area and price can hold back above 0.04905, continuation becomes easier to trust.
Failure would likely come from a quick slip back under 0.04850, especially if the follow-through candles lose momentum and volume cools off. That would tell you breakout was too hot to hold. On the upside, the trade map is TP1: 0.04964, TP2: 0.05022, and TP3: 0.05081, with SL: 0.04846 keeping the line clean.
The 4H chart adds useful context: resistance at 0.05290 sits above this push, so there is room for the move to breathe if buyers stay active. Bigger-picture support at 0.04057 also shows the broader trend is still giving breakout a healthy base. A staged approach makes sense here — and a stretched candle is usually better respected than chased.
Trade $KERNEL here with a plan, not panic.
#Crypto #Trading #Binance
DYOR
Follow me
dr_mt