Here is a brief analysis of the charts $SOL /USDT (Perpetual) provided:
Overall trend:
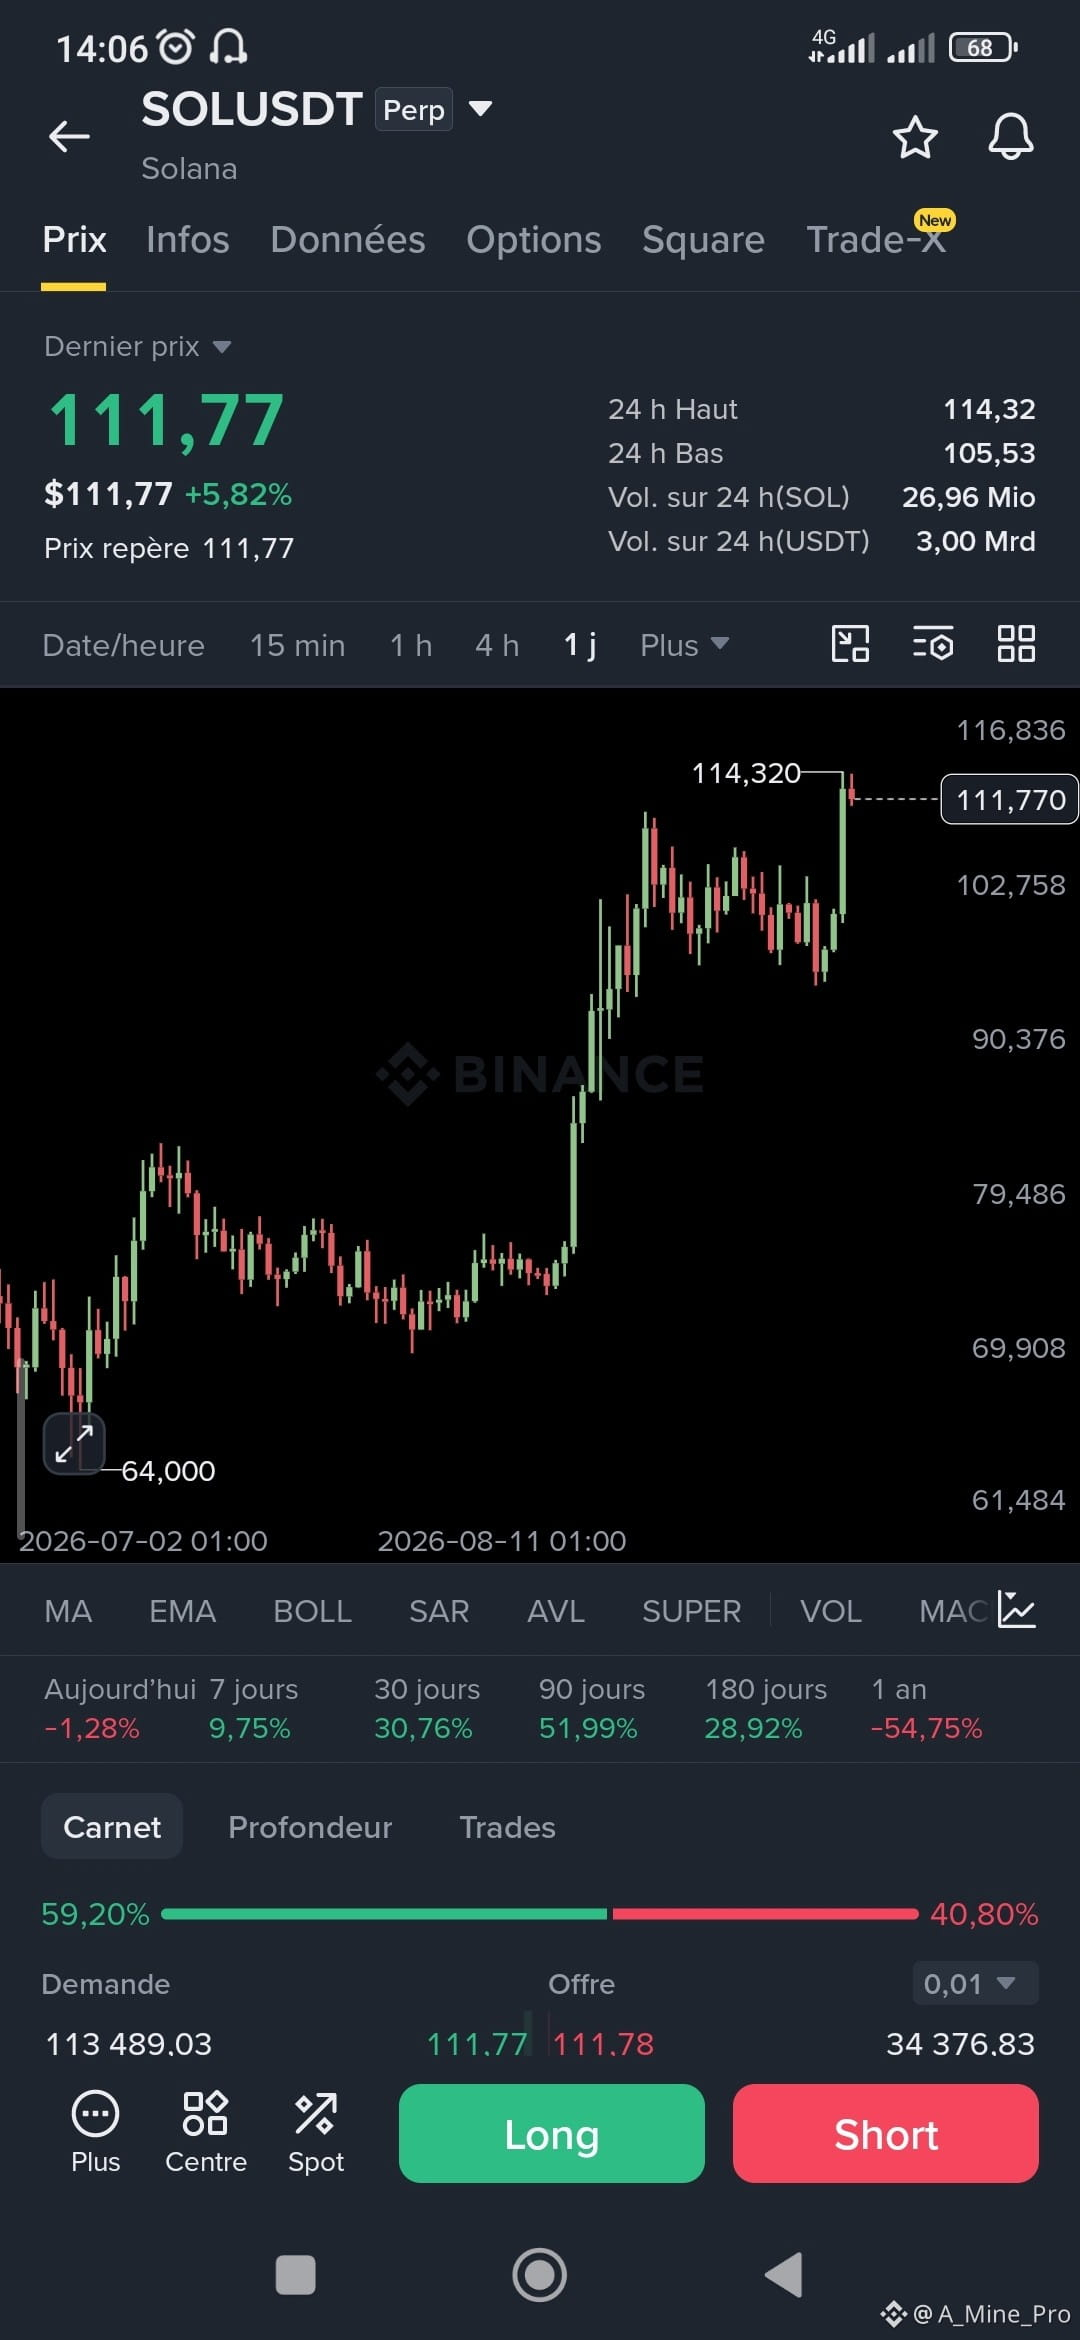
· Medium term (1D): Strong bullish trend. The price moved from a low of $64.00 to a local high of $114.32. The upward momentum is very pronounced.
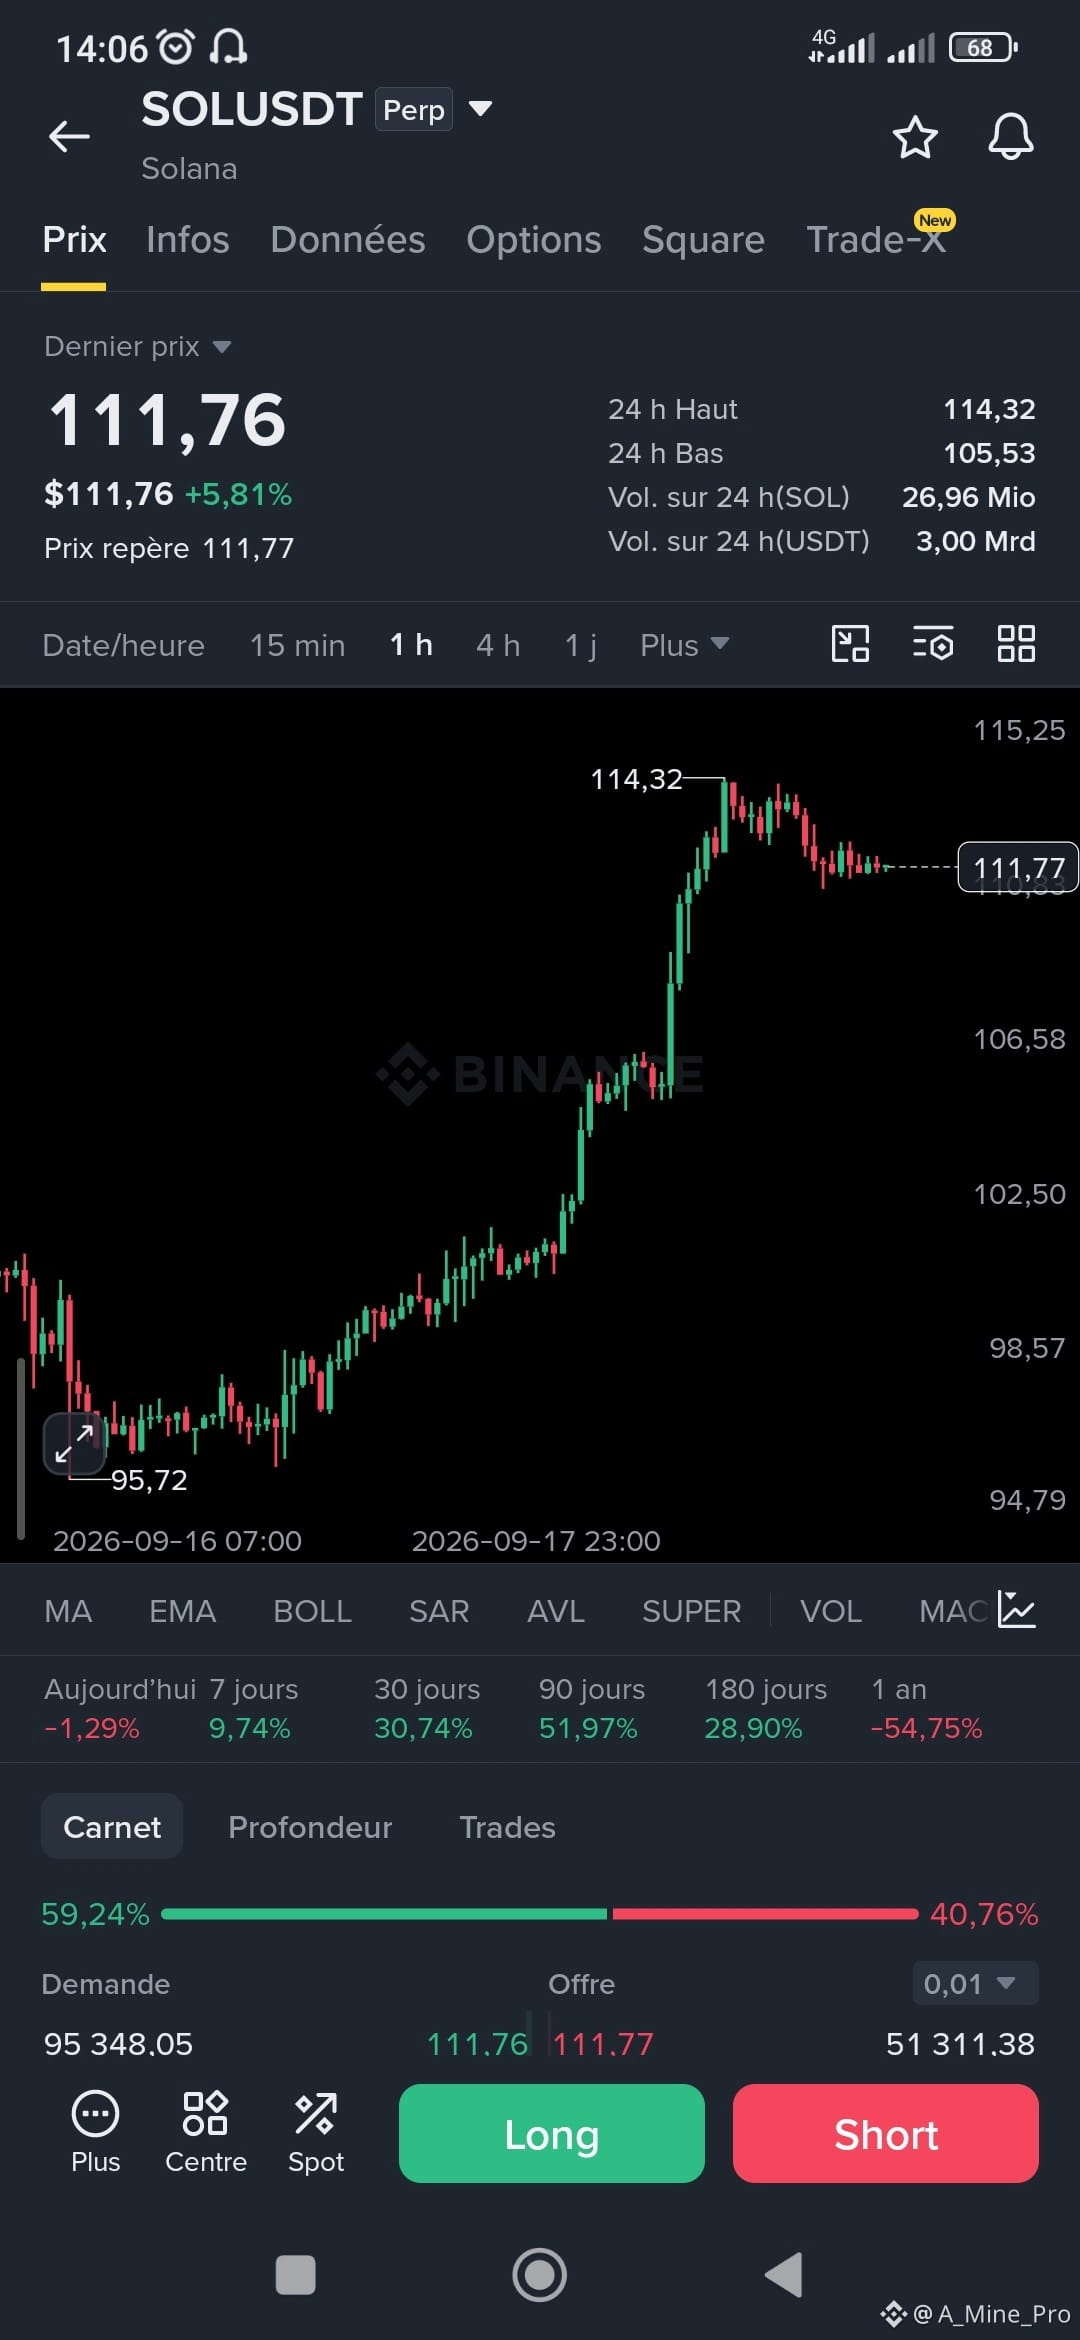
· Short term (1H): After a strong bullish impulse, the price reaches a high at $114.32 and begins a slight consolidation. Currently at $111.76, the price is testing a technical pullback.
Key indicators:
· #Performance : +5.81% over 24h. Over 30 days (+30.74%) and 90 days (+51.97%), performance is excellent. However, over 1 year, the price is still down 54.75%, indicating a rebound from a prior bearish market.
· Order book: Slight predominance of buyers (Demand ~59.2% vs. Supply ~40.8%), suggesting residual buying pressure.
· Volumes: The 24h volume is significant (3.00 Bn USDT), confirming the validity of the move.
Technical levels to watch:
· #Résistance immediate: $114.32 (recent high). A breakout above this level with volume could push the price higher.
· Immediate support: $105.53 (24h low). Below that, the $95–100 zone would serve as major support.
Conclusion:
The momentum is clearly bullish, but since the price is close to its local high, consolidation or a short-term pullback is possible before another attempt to break out. Caution is warranted due to volatility.
$SOL
#SolanaUSTD #solana
Overall trend:
· Medium term (1D): Strong bullish trend. The price moved from a low of $64.00 to a local high of $114.32. The upward momentum is very pronounced.
· Short term (1H): After a strong bullish impulse, the price reaches a high at $114.32 and begins a slight consolidation. Currently at $111.76, the price is testing a technical pullback.
Key indicators:
· #Performance : +5.81% over 24h. Over 30 days (+30.74%) and 90 days (+51.97%), performance is excellent. However, over 1 year, the price is still down 54.75%, indicating a rebound from a prior bearish market.
· Order book: Slight predominance of buyers (Demand ~59.2% vs. Supply ~40.8%), suggesting residual buying pressure.
· Volumes: The 24h volume is significant (3.00 Bn USDT), confirming the validity of the move.
Technical levels to watch:
· #Résistance immediate: $114.32 (recent high). A breakout above this level with volume could push the price higher.
· Immediate support: $105.53 (24h low). Below that, the $95–100 zone would serve as major support.
Conclusion:
The momentum is clearly bullish, but since the price is close to its local high, consolidation or a short-term pullback is possible before another attempt to break out. Caution is warranted due to volatility.
$SOL
#SolanaUSTD #solana