$ONE
Technical analysis on the daily chart
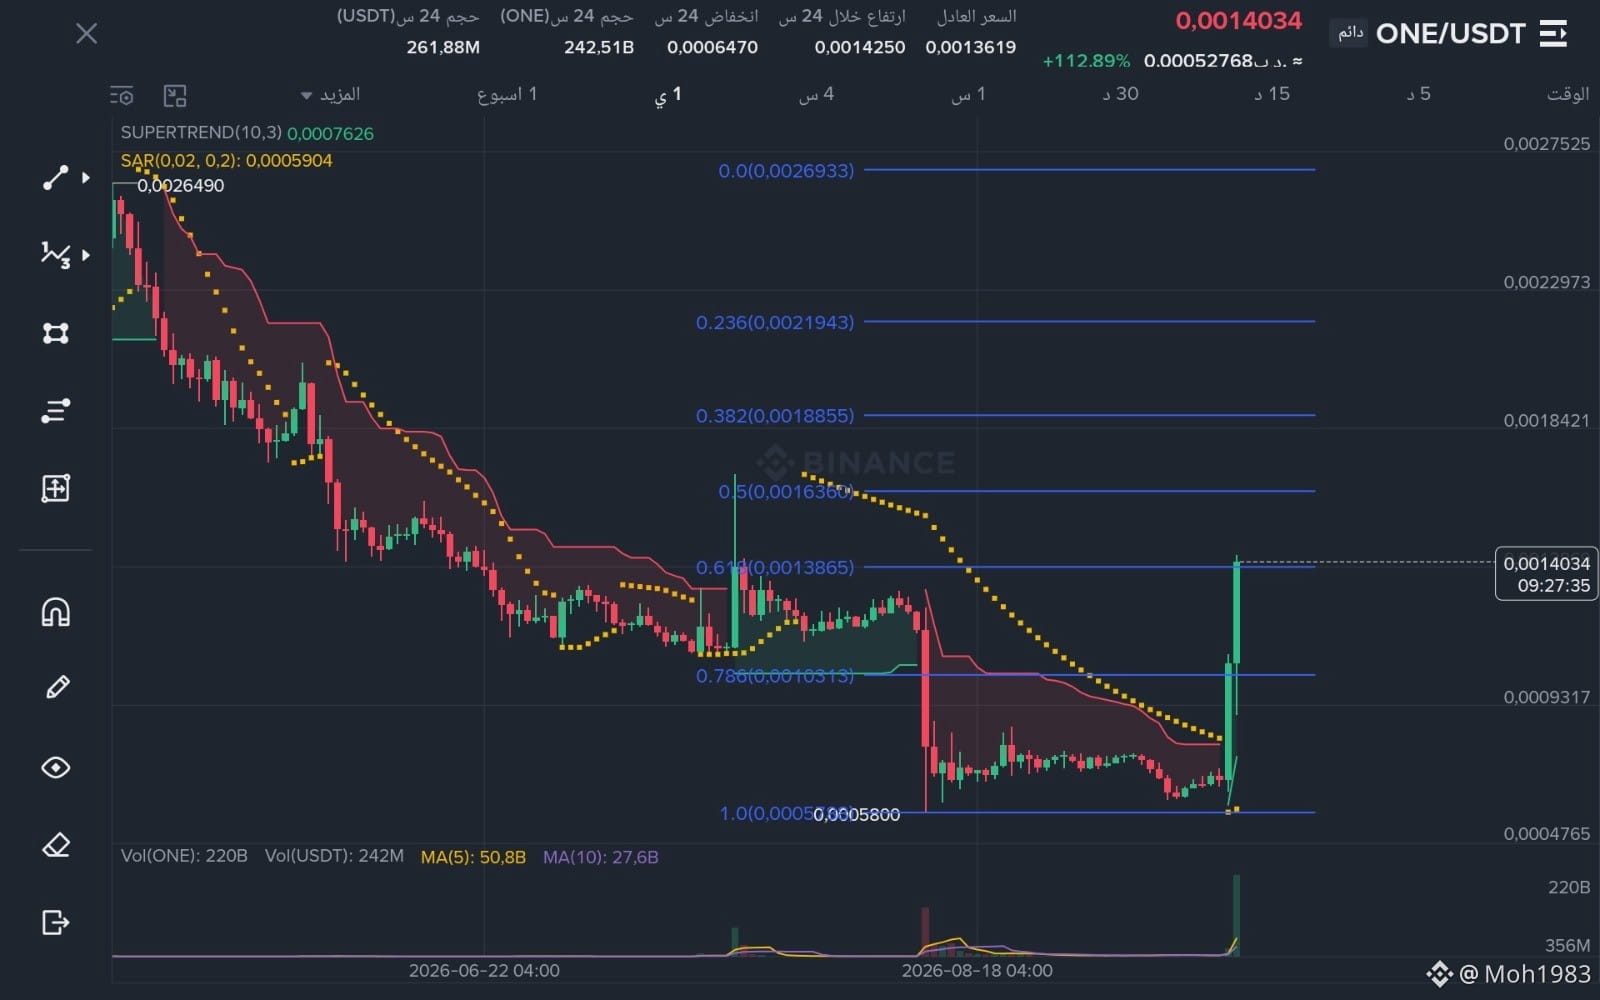
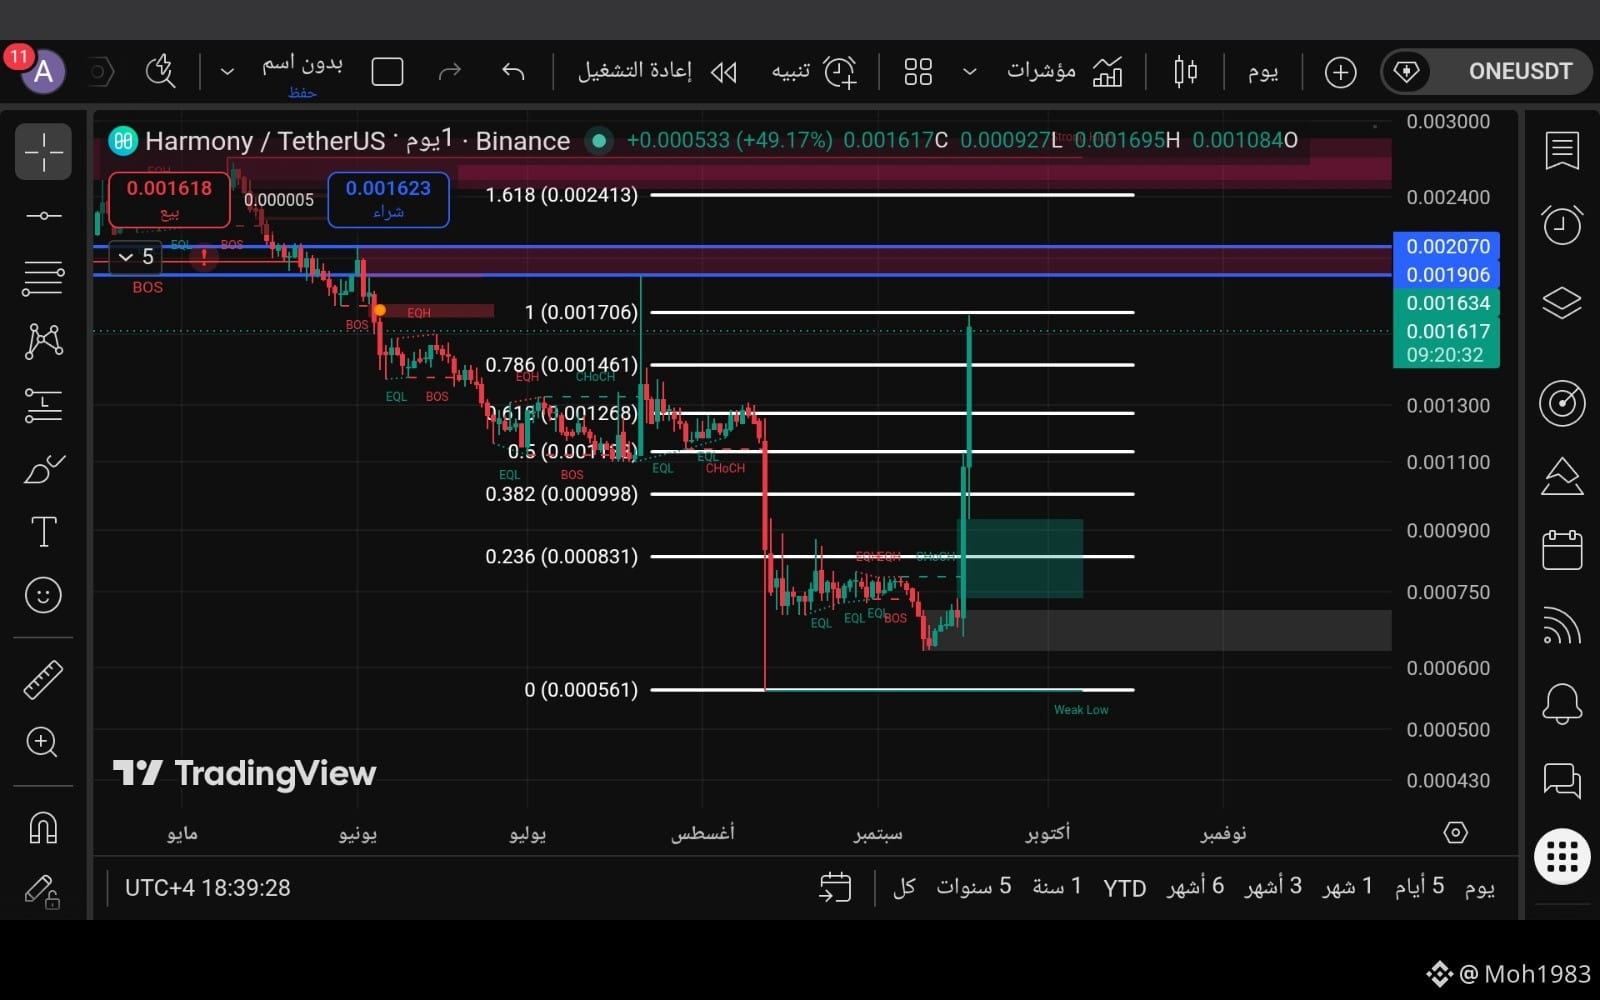
After a long decline, ONE formed a bottom near 0.00056 and entered an accumulation phase, then a very strong upward surge followed, accompanied by a clear increase in trading volume. 📈
But ⚠️ don’t chase the price right now; we have important resistance and liquidity levels ahead.
🟢 The bullish scenario
Holding above 0.001636, then breaking 0.001706 with a daily close:
🎯 0.001885 – 0.001906
🎯 0.002070 🔥 a key liquidity/supply zone
🎯 0.002413 if the previous zone is strongly breached.
🔴 The corrective scenario
If the price is rejected from 0.001636 – 0.001706:
📍 0.001386 – 0.001268 first support
📍 0.00110 – 0.00103 important support
📍 0.000831 key support
📍 0.00065 – 0.00056 the previous bottom and liquidity zone.
🚨 Important warning:
The 0.001906 – 0.002070 zone on the daily chart contains strong sell/liquidity supply, so reaching it does not necessarily mean the uptrend will continue immediately. Watch the price action and rejection behavior before making any decision.
Conclusion:
ONE has started to show a strong momentum shift, but the real confirmation comes with a breakout and a daily close, followed by a successful Retest—not just a single bullish candle.
#ONE #Harmony #ONEUSDT #Crypto #Binance #TechnicalAnalysis #Altcoins #تحليل_فني #عملات_رقمية
$ONE
Technical analysis on the daily chart
After a long decline, ONE formed a bottom near 0.00056 and entered an accumulation phase, then a very strong upward surge followed, accompanied by a clear increase in trading volume. 📈
But ⚠️ don’t chase the price right now; we have important resistance and liquidity levels ahead.
🟢 The bullish scenario
Holding above 0.001636, then breaking 0.001706 with a daily close:
🎯 0.001885 – 0.001906
🎯 0.002070 🔥 a key liquidity/supply zone
🎯 0.002413 if the previous zone is strongly breached.
🔴 The corrective scenario
If the price is rejected from 0.001636 – 0.001706:
📍 0.001386 – 0.001268 first support
📍 0.00110 – 0.00103 important support
📍 0.000831 key support
📍 0.00065 – 0.00056 the previous bottom and liquidity zone.
🚨 Important warning:
The 0.001906 – 0.002070 zone on the daily chart contains strong sell/liquidity supply, so reaching it does not necessarily mean the uptrend will continue immediately. Watch the price action and rejection behavior before making any decision.
Conclusion:
ONE has started to show a strong momentum shift, but the real confirmation comes with a breakout and a daily close, followed by a successful Retest—not just a single bullish candle.
#ONE #Harmony #ONEUSDT #Crypto #Binance #TechnicalAnalysis #Altcoins #تحليل_فني #عملات_رقمية
$ONE