
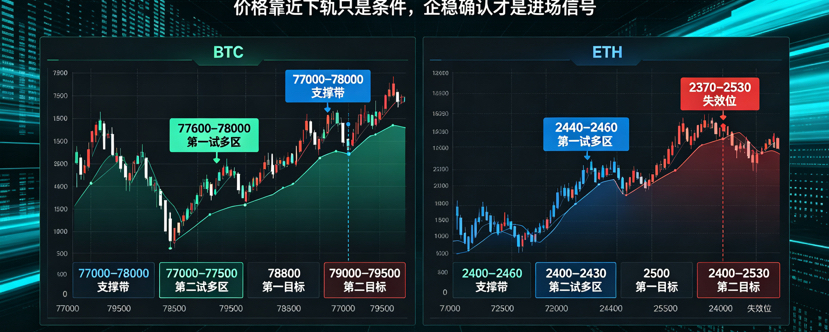

After both BTC and ETH rebounded and surged higher on the previous day, they met resistance and rolled over, with both dropping in the morning to retest the lows. In the short term, bullish momentum has clearly weakened. However, this does not mean the trend has already turned bearish. A more accurate assessment is that the market has entered a second consolidation phase after the rebound. This article, using the latest price ranges, the behavior near the lower band of the Bollinger Bands, BTC ETF fund flows, and macro interest-rate constraints, will re-examine the conditions under which longing (buying low) in the support zone is suitable—and explain why “go long if it doesn’t break down” and “go long only after stabilization” are two completely different trading logics.
1. What has happened on the market?
From the morning structure, BTC first hit a high near 78942 and then met resistance and pulled back, with the low probing to around 77706. ETH likewise moved up then fell back, and briefly probed the bottom on the short term. After price temporarily found support at a low level, it is currently in a mild repair phase following the selloff.
This type of structure is easiest to misread: some people interpret a rebound-and-pullback as the short-side trend restarting, while others interpret low-level repair as a reversal confirmed. A more objective interpretation is:
The previous day’s long-side rebound premium has already been realized, and the market is now choosing a direction again.
In other words, the short term neither has enough evidence to prove longs have regained dominance, nor enough evidence to show shorts have completed a breakdown. The current situation is closer to “a repair after a selloff,” not a “trend reversal.”
II. Why does price moving near the lower band not necessarily mean an immediate reversal?
The original text repeatedly mentions that the BTC and ETH morning moves are close to the lower band of the Bollinger Bands, and therefore argues that support is effective. This observation has some reason, but it cannot be used as the sole basis for entering the trade.
The meaning of the lower band of the Bollinger Bands is mostly that the price enters a short-term undervalued area, not that it guarantees an immediate rebound. Especially in a downtrend, price may track along the lower band for a while, and even show fake breakouts. What is truly valuable isn’t “hitting the lower band,” but “price behavior after it hits the lower band.”
More reliable confirmation at least includes one of the following three categories of signals:
1. Stop-decline candlestick pattern: a long lower wick, a hammer near the lows, a bullish engulfing or consecutive small red candles followed by contraction in volume and stabilization;
2. Volume confirms: during the decline, volume increases; during the rebound, volume contracts or increases mildly. This suggests selling pressure is running out;
3. Time confirmation: price stays within the support zone long enough and does not keep printing new lows.
Without these confirmations, using “not breaking” as a reason to go long in essence is betting on support, not trading structure.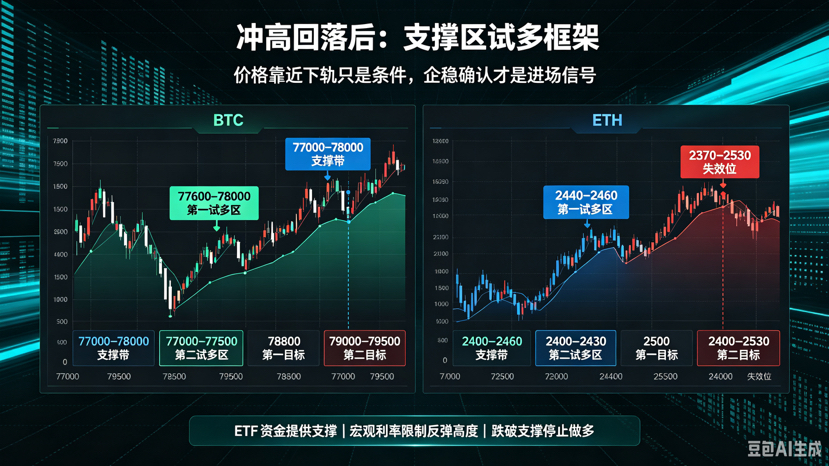
III. BTC: 77000–78000 is a support zone, not an exact buy point
BTC’s current key support is concentrated in the 77000–78000 range. The area around 77700 was the morning low, while around 77000 is a deeper structural support. Therefore, the two low-long ranges mentioned in the original text—78000–77600 and 77500–77000—are better understood as “support zones,” not as mechanical limit-order price levels.
A more practical approach is to break them into three levels:
First support zone: 77600–78000
If price first retests here and shows a clear stop-decline signal, you can consider a low-position long test, with a target near 78800.
Second support zone: 77000–77500
If the first support zone fails, but the price stabilizes again above 77000, the low-long logic still has room for repair; targets could be around 79000–79500.
Invalidation level: below 77000
If BTC breaks down through 77000 effectively, it means the support zone has been pierced and the low-long idea no longer holds. You then need to reassess the area around 76000–75000 below.
Therefore, for BTC, the key is not “where it must go long,” but “after it drops to a certain level, where the market is willing to stop selling.”
IV. ETH: the 2430–2460 support zone; strength depends on BTC
ETH followed BTC lower in the morning, indicating that the short term is still heavily influenced by BTC sentiment. Its support zones can be divided into two levels: 2460–2440 and 2430–2400.
First support zone: 2460–2440
If BTC stabilizes, and ETH shows a stop-decline signal in this area, you can test a long with a small position, targeting around 2500.
Second support zone: 2430–2400
If the first support zone is broken, but ETH regains buy pressure above 2400, you can still consider a second long test, targeting 2500–2530.
Invalidation level: below 2400
After an effective breakdown below 2400, the short-term long structure is damaged, and the low-long strategy should pause.
ETH’s problem is that it currently lacks an independent bullish narrative. While ETF capital inflow remains positive, its strength is weaker than BTC’s. DeFi earnings and on-chain activity have some local repair, but they are still not enough to drive an independent market-wide rally. Therefore, ETH’s low short positions should be more of a follow-trade after BTC stabilizes, not an active leading trade.
V. Why the original text says “still long-biased,” but a safer approach is to “wait for certainty”?
The original view has some reasonable points: with ETF capital still flowing in for BTC and price not breaking deeper support, the risk of directly chasing shorts is high. That is, the current market is not a one-way bearish market; it’s closer to a second consolidation phase after a strong sideways bias.
But “being long-focused” doesn’t mean “going long anytime.” A more accurate way to put it is:
As long as the support zone has not been broken, longs have a higher potential win rate; but when you truly enter, you must wait for confirmation that the market has stabilized.
Many traders interpret this as “buy the lower it goes,” and the result is repeatedly taking the knife in a continuous down grind. The correct approach is:
• When price approaches the support zone, observe first—don’t rush to enter;
• After a stop-decline signal appears, test with a small position;
• Place the stop loss outside the support zone, not near the cost price;
• After the rebound recovers the short-term moving averages, consider increasing position size.
VI. Liquidity and macro conditions: why is it not easy for the support area to be broken through directly?
In spite of recent volatility, ETF capital inflows for BTC remain generally active overall, suggesting institutional funds have not withdrawn at a large scale. This means that each deeper pullback may attract some allocation-style capital to buy the dip. Therefore, it’s not surprising that BTC shows repeated support around 77000–78000.
But the macro picture is still tight. As the Fed’s rate decision approaches, the U.S. dollar index, bond yields, and market risk appetite can change at any time. In this environment, even if support remains effective, the rebound height may be capped.
So a more reasonable judgment is:
• Fundamental support: limits the room for a large drop;
• Macro interest-rate constraints: limit the height of rebounds;
• Technical condition: price is near the lower band and there is a need for a rebound/repair;
After all three factors align, BTC is more likely to trade in a range like “rebound after support, and then face pressure after the rebound,” rather than a one-way reversal.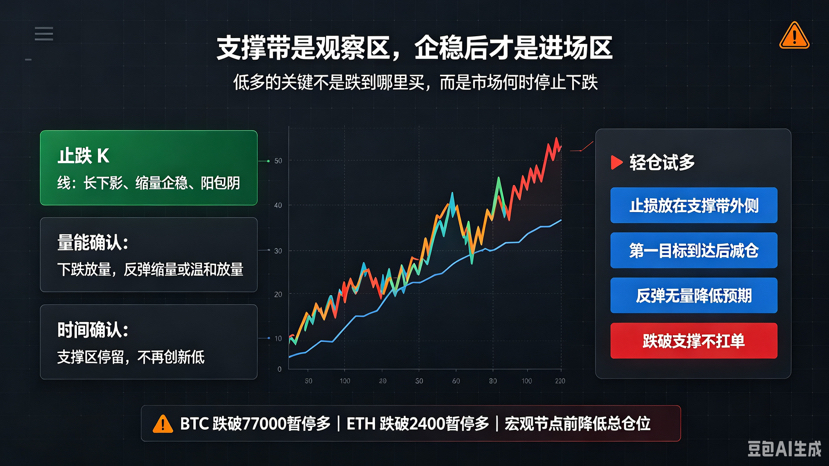
VII. Trade management: low-long is not not placing a stop loss, and it’s not “holding through a position gone wrong.”
The low-long direction stated in the original text only makes sense when paired with strict defense. More practical management rules include:
1. Don’t go all-in right at the edge of support: the support zone is an observation area—enter only after confirmation;
2. Place the stop loss outside the support zone: if BTC breaks below 77000 or ETH breaks below 2400, you should stop going long;
3. Reduce exposure after the first target is reached: for BTC near 78800 and for ETH near 2500, you can first lock in part of the profits;
4. If the rebound comes without volume, lower expectations: if price recovers support but volume is insufficient, don’t look too far upward for targets;
5. Don’t chase shorts the wrong way after breaking support: a failed support only means the long trade failed—it doesn’t mean it’s immediately suitable to chase shorts.
The biggest risk of a low-long strategy is not an incorrect direction judgment, but turning “support remains effective” into “refusing to stop loss.”
VIII. Two low-long scenarios that are more worth executing
Scenario A: support zone contracts volume and stops declining
BTC reduces volume and stabilizes in the 77000–78000 range, while ETH stops printing new lows in the 2400–2460 range. This indicates selling pressure is fading, making it suitable for a small-position long test.
Scenario B: rebound recovers the short-term moving averages
If BTC reclaims above 78800 and ETH reclaims around 2500, and the trading volume increases mildly, this suggests short-term long positions are starting to recover—you can consider adding a portion of positions;
In contrast, the following scenarios are not worth forcing a trade:
• Price has just touched support, and there is still no stop-decline signal;
• A large bearish candle with an extremely long lower wick—market sentiment is clearly in panic;
• BTC and ETH simultaneously expand volume and break down through levels;
• Macro data or an interest-rate decision is about to be released, and market liquidity deteriorates.
IX. Conclusion: support zones are the observation zone; only after stabilization is it the entry zone
After BTC and ETH rallied and then reversed in the morning, short-term long momentum weakened, but deeper support has not failed. For BTC, focus on the 77000–78000 support zone; for ETH, focus on the 2400–2460 support zone. “Support remains effective” doesn’t mean an immediate reversal—this must be combined with stop-decline candlestick patterns, volume, and time confirmation.
In a backdrop of uncertain macro interest rates and ETF capital still providing support, low-long is a reasonable direction, but it is not a direction you can execute at any time. What is truly valuable is to treat the support zone as the starting point for observation, use stabilization signals as the entry condition, and treat stop-loss invalidation as the exit rule.
For the current market, the principle worth sticking to is not “buy exactly where it drops,” but:
Let the market first prove it can’t fall further, and then consider going long.
#美财政部拟回购最多60亿美元国债 #比特币突破79000美元 #布伦特原油突破100美元 #美国ADP周度就业人数增1.2万人 #美国银行集团完成USBDC稳定币试点 $BTC


