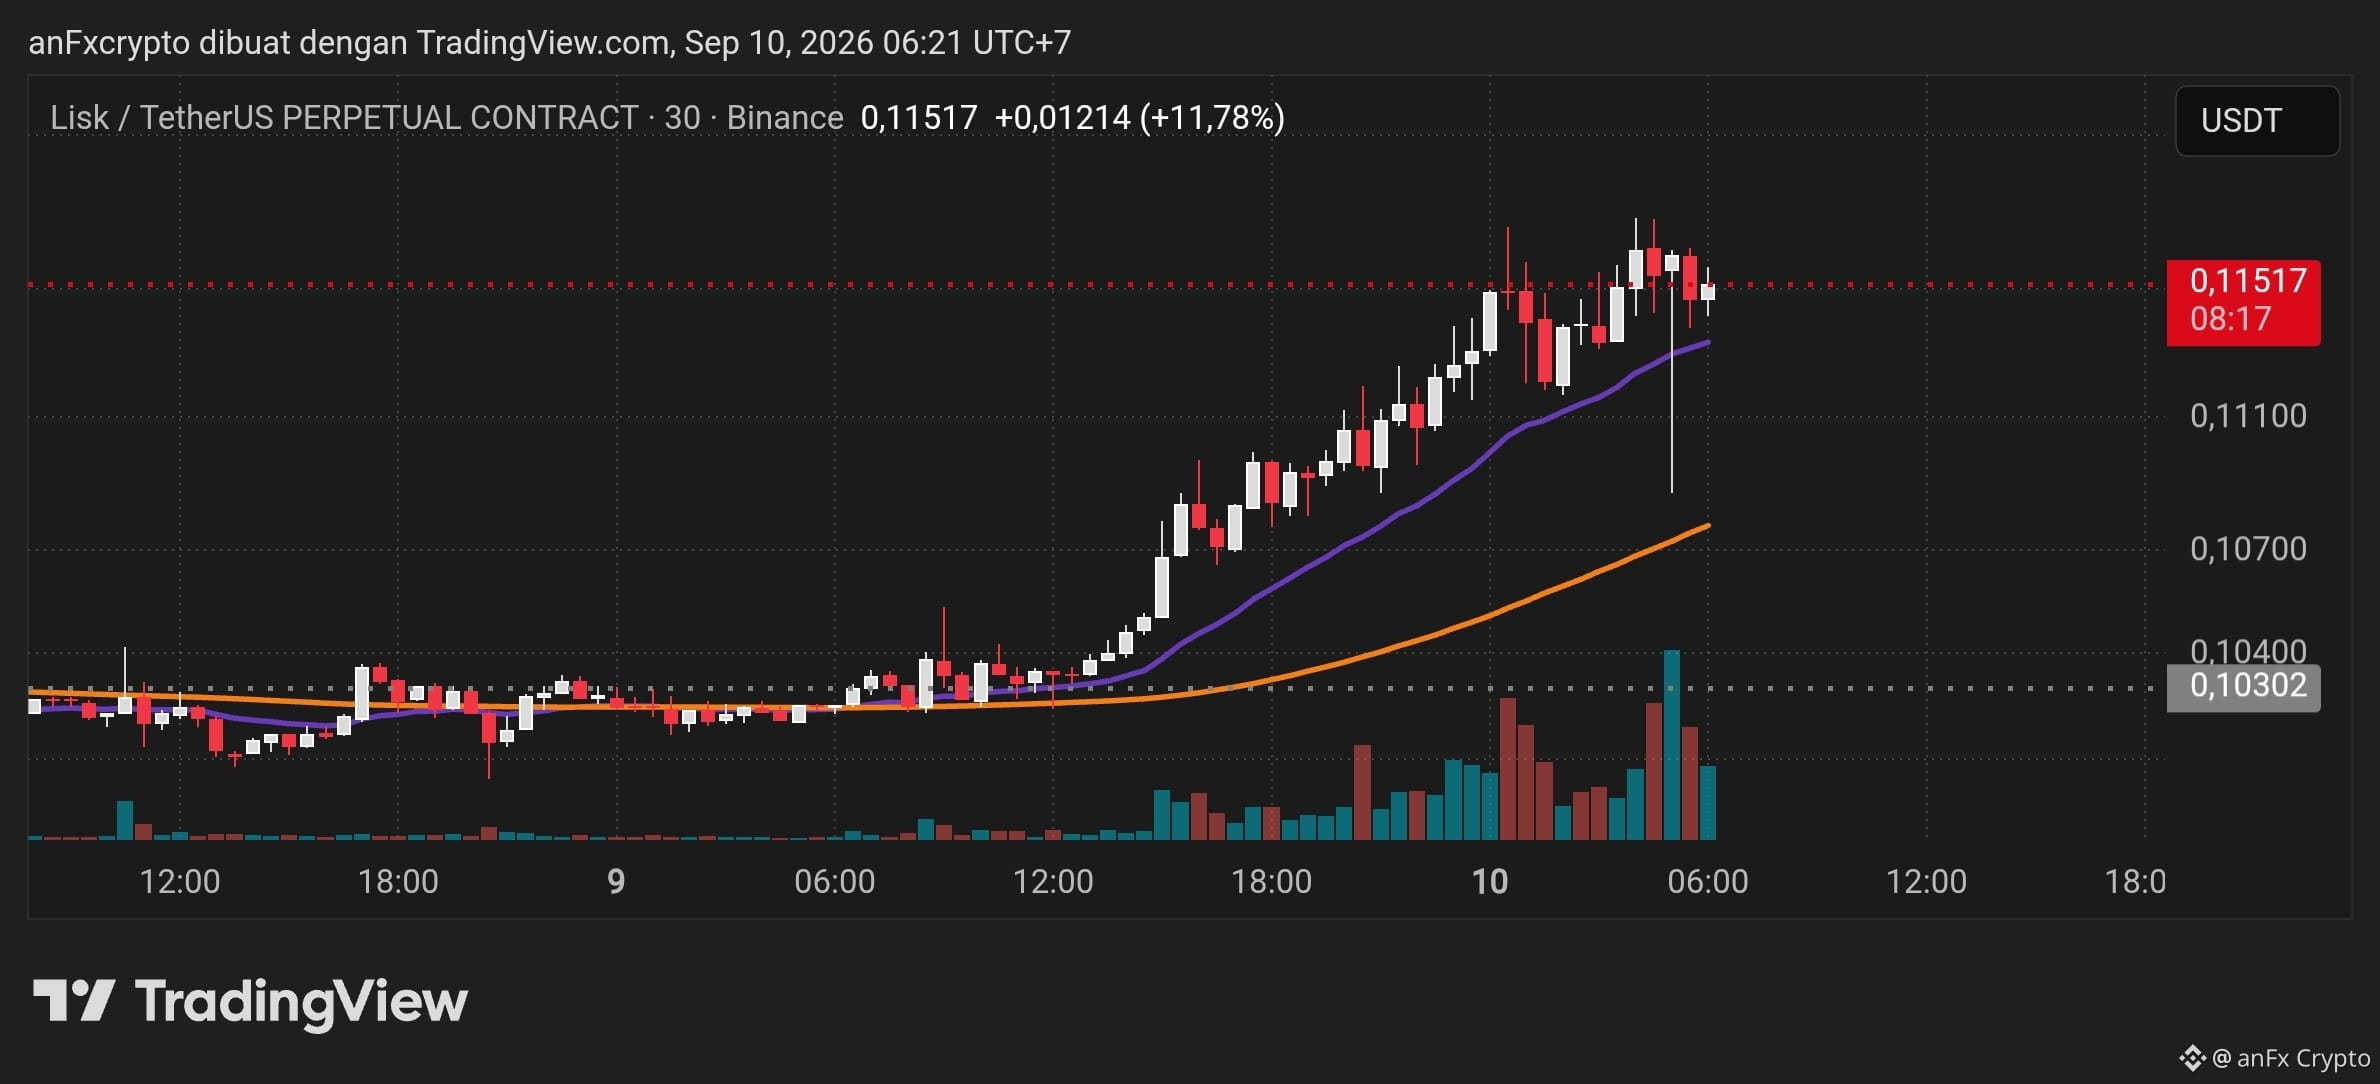
The $LSK /USDT Perpetual (TF 30m) chart shows an impulsive bullish trend after successfully breaking out of the $0.10300 consolidation range with a significant volume surge. Currently, the price is at $0.11517 (+11.78%) and is lightly consolidating just below the local resistance at $0.11780.
Technical Analysis
* Trend Structure: Bullish Momentum (Price moves consistently above the purple & orange Moving Average lines).
* Dynamic Support: The fast EMA line (purple) supports the price around the $0.11300 – $0.11350 area.
* Strong Support: The slow EMA line (orange) at $0.10800 – $0.11000.
* Main Resistance: $0.11750 – $0.11800 area (highest wick from the latest impulsive move).
* Volume: A surge in buy volume (large green bars) confirms strong accumulation, though volume is now starting to level off, indicating a healthy correction.
Trading Signal: Buy on Pullback
| Parameter | Price Level |
| Entry Area (Buy Limit) | $0.11200 – $0.11350 (retest of dynamic EMA support) |
| Take Profit 1 (TP1) | $0.11750 (retest of the peak) |
| Take Profit 2 (TP2) | $0.12300 (bullish expansion area) |
| Stop Loss (SL) | $0.10850 (below the most recent swing low support) |
| Risk to Reward Ratio | 1 : 2.1 |
| Recommended Leverage | Max 3x – 5x (Futures) |
Alternative Scenario (Breakout Entry)
If the price does not correct and instead immediately breaks through and closes the 30m candle above $0.11800 with high volume, perform an Instant Market Buy with a TP target at $0.12400 and a Stop Loss at $0.11450.
Use a maximum risk allocation of 2–3% of the total portfolio equity per trade to keep drawdowns under control.
Technical Analysis
* Trend Structure: Bullish Momentum (Price moves consistently above the purple & orange Moving Average lines).
* Dynamic Support: The fast EMA line (purple) supports the price around the $0.11300 – $0.11350 area.
* Strong Support: The slow EMA line (orange) at $0.10800 – $0.11000.
* Main Resistance: $0.11750 – $0.11800 area (highest wick from the latest impulsive move).
* Volume: A surge in buy volume (large green bars) confirms strong accumulation, though volume is now starting to level off, indicating a healthy correction.
Trading Signal: Buy on Pullback
| Parameter | Price Level |
| Entry Area (Buy Limit) | $0.11200 – $0.11350 (retest of dynamic EMA support) |
| Take Profit 1 (TP1) | $0.11750 (retest of the peak) |
| Take Profit 2 (TP2) | $0.12300 (bullish expansion area) |
| Stop Loss (SL) | $0.10850 (below the most recent swing low support) |
| Risk to Reward Ratio | 1 : 2.1 |
| Recommended Leverage | Max 3x – 5x (Futures) |
Alternative Scenario (Breakout Entry)
If the price does not correct and instead immediately breaks through and closes the 30m candle above $0.11800 with high volume, perform an Instant Market Buy with a TP target at $0.12400 and a Stop Loss at $0.11450.
Use a maximum risk allocation of 2–3% of the total portfolio equity per trade to keep drawdowns under control.