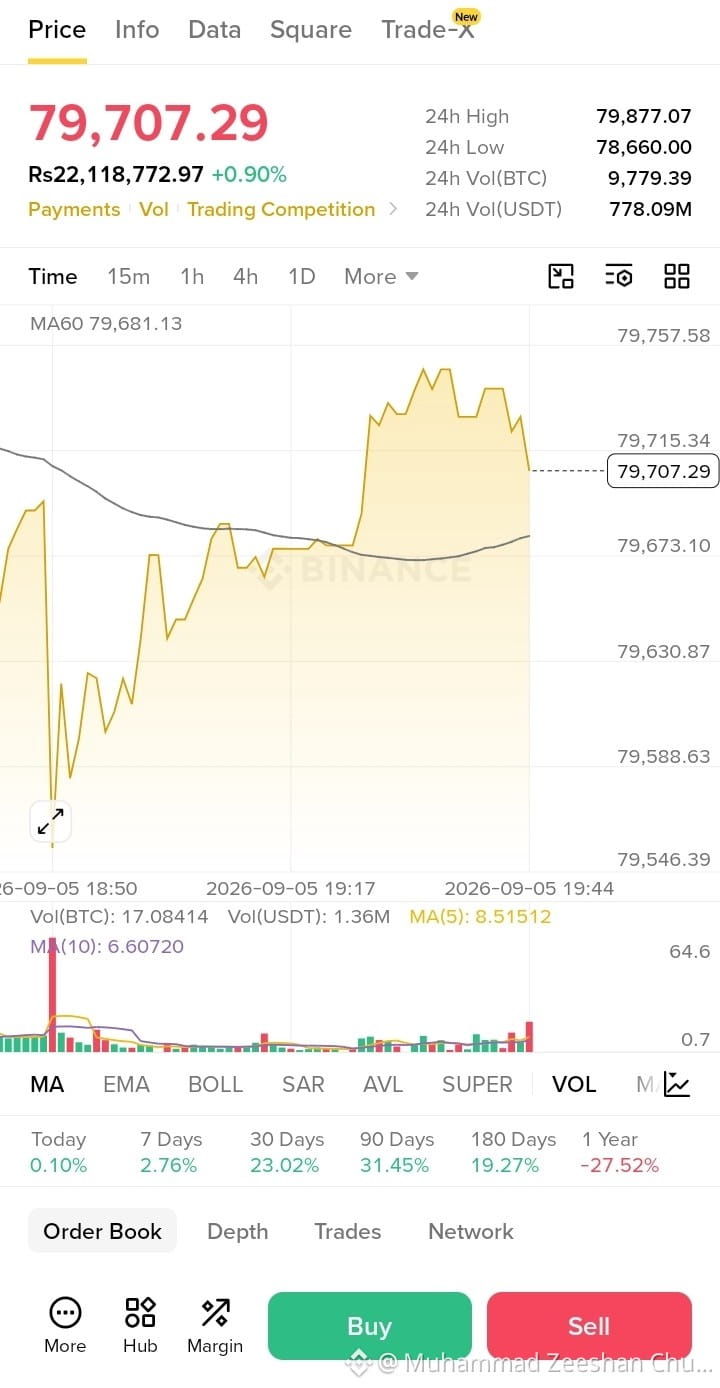
I’m looking at $BTC on the 15m chart, and the short-term structure looks mildly bullish after price pushed above the MA60. Price is currently around 79,707, holding just above the visible MA60 at 79,681.13.
I like the long idea only while that MA area continues to hold. The recent move pushed into 79,757.58, so that’s the first clear resistance to watch. If buyers can reclaim that level, the visible 79,877.07 24h high becomes the next upside area.
📍 Entry: 79,700–79,715
🎯 TP1: 79,757.58
🎯 TP2: 79,877.07
🎯 TP3: Not adding one here — the chart doesn’t give enough confirmation beyond the 24h high.
🛑 Invalidation: 79,673.10
A sustained move below 79,673.10, especially with price losing the MA60 around 79,681, would weaken this setup and tell me the recent push is losing momentum.
I’m watching how BTC reacts around the MA60 and 79,757.58 rather than forcing the trade
I like the long idea only while that MA area continues to hold. The recent move pushed into 79,757.58, so that’s the first clear resistance to watch. If buyers can reclaim that level, the visible 79,877.07 24h high becomes the next upside area.
📍 Entry: 79,700–79,715
🎯 TP1: 79,757.58
🎯 TP2: 79,877.07
🎯 TP3: Not adding one here — the chart doesn’t give enough confirmation beyond the 24h high.
🛑 Invalidation: 79,673.10
A sustained move below 79,673.10, especially with price losing the MA60 around 79,681, would weaken this setup and tell me the recent push is losing momentum.
I’m watching how BTC reacts around the MA60 and 79,757.58 rather than forcing the trade