
花涧空
1k Posts

花涧空
 Square Verified+
Crypto observer|Market & on‑chain updates|Not investment advice

TRX Holder
Frequent Trader
6.1 Years
524 Following
37.5K+ Followers
16.2K+ Liked
Posts
All
Quotes
Live
PINNED
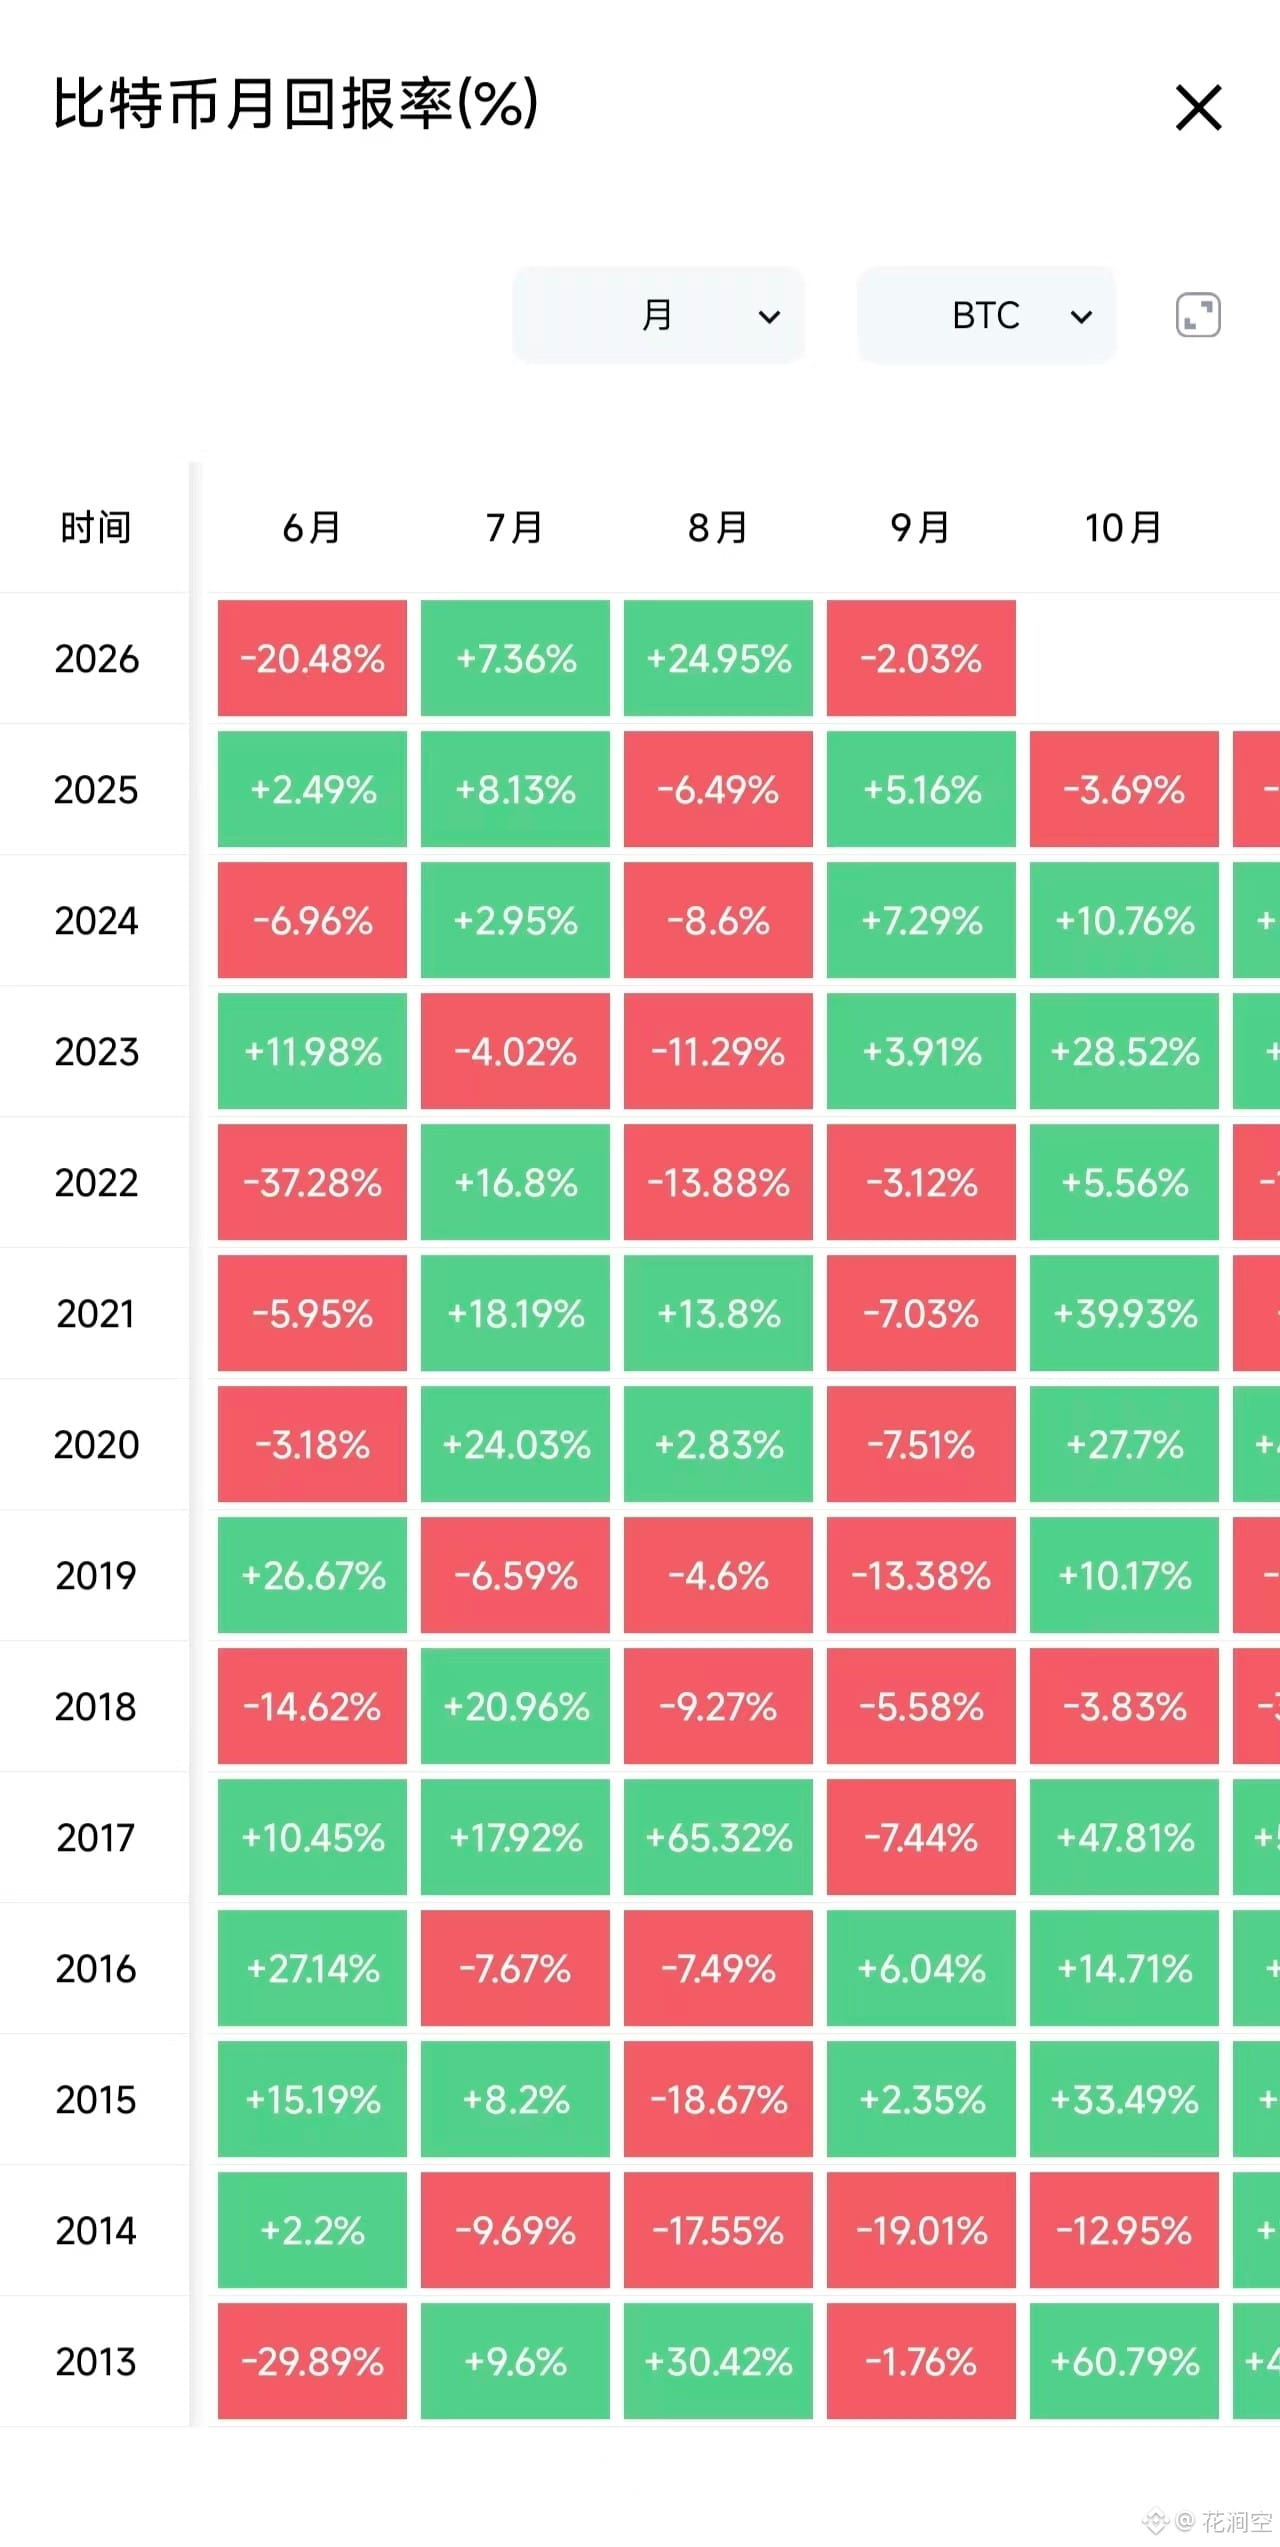
📊 Historical data shows: between July and September, BTC has an interesting pattern—
🔹 In history, there has never been a case where both August and September rose for two consecutive months.
🔹 Instead, there are as many as 4 years where July and August both had consecutive gains, followed by a pullback in September.
That means September is more like a “cooling-off month,” not a “relay month.”
History won’t simply repeat, but the rhythm is worth paying attention to.🧐$BTC
#BTC #Crypto History #Market Watch #九月魔咒
🔹 In history, there has never been a case where both August and September rose for two consecutive months.
🔹 Instead, there are as many as 4 years where July and August both had consecutive gains, followed by a pullback in September.
That means September is more like a “cooling-off month,” not a “relay month.”
History won’t simply repeat, but the rhythm is worth paying attention to.🧐$BTC
#BTC #Crypto History #Market Watch #九月魔咒
PINNED
In a bear market, everyone likes to predict the lowest price for this round, $BTC . Let me take a shot at it too!
What do you think the bottom will be? Feel free to drop your thoughts in the comments!
Personally, I predict the extreme bottom for this round at 44000U📉
Three core points:
1. Technical Cycle: The high was 126,000, and a 65% golden retracement perfectly corresponds to the 44,000 range;
2. Miner Cost Hard Support⛏️: The shutdown price for mainstream S23 water-cooled miners is 44,000. This is the new generation computing power's bottom line; if it drops below this, many will shut down, leading to massive selling pressure; the older S21 miners at 69,000-74,000 will reduce output in advance to cushion the drop;
3. Capital Flow: The spot ETF continues to provide a floor, making it hard to replicate the deep crashes of previous years. After the panic selling clears in Q4, we may see a bottom⏳
This prediction is based solely on cycles and mining costs, and there could be black swan events in the market. This does not constitute investment advice; invest your spare change to maintain a calm mindset✨
Once we hit a price you consider suitable, you can start to accumulate! Gradually increase your position; if you keep waiting for the absolute lowest price, you might miss out on this round of opportunities!
⚠️ Crypto investments carry extremely high risks, so enter the market with caution.
What do you think the bottom will be? Feel free to drop your thoughts in the comments!
Personally, I predict the extreme bottom for this round at 44000U📉
Three core points:
1. Technical Cycle: The high was 126,000, and a 65% golden retracement perfectly corresponds to the 44,000 range;
2. Miner Cost Hard Support⛏️: The shutdown price for mainstream S23 water-cooled miners is 44,000. This is the new generation computing power's bottom line; if it drops below this, many will shut down, leading to massive selling pressure; the older S21 miners at 69,000-74,000 will reduce output in advance to cushion the drop;
3. Capital Flow: The spot ETF continues to provide a floor, making it hard to replicate the deep crashes of previous years. After the panic selling clears in Q4, we may see a bottom⏳
This prediction is based solely on cycles and mining costs, and there could be black swan events in the market. This does not constitute investment advice; invest your spare change to maintain a calm mindset✨
Once we hit a price you consider suitable, you can start to accumulate! Gradually increase your position; if you keep waiting for the absolute lowest price, you might miss out on this round of opportunities!
⚠️ Crypto investments carry extremely high risks, so enter the market with caution.

花涧空
·
--
📊 Historical data shows: between July and September, BTC has an interesting pattern—
🔹 In history, there has never been a case where both August and September rose for two consecutive months.
🔹 Instead, there are as many as 4 years where July and August both had consecutive gains, followed by a pullback in September.
That means September is more like a “cooling-off month,” not a “relay month.”
History won’t simply repeat, but the rhythm is worth paying attention to.🧐$BTC
#BTC #Crypto History #Market Watch #九月魔咒
🔹 In history, there has never been a case where both August and September rose for two consecutive months.
🔹 Instead, there are as many as 4 years where July and August both had consecutive gains, followed by a pullback in September.
That means September is more like a “cooling-off month,” not a “relay month.”
History won’t simply repeat, but the rhythm is worth paying attention to.🧐$BTC
#BTC #Crypto History #Market Watch #九月魔咒
花涧空
·
--
📊 Historical data shows: between July and September, BTC has an interesting pattern—
🔹 In history, there has never been a case where both August and September rose for two consecutive months.
🔹 Instead, there are as many as 4 years where July and August both had consecutive gains, followed by a pullback in September.
That means September is more like a “cooling-off month,” not a “relay month.”
History won’t simply repeat, but the rhythm is worth paying attention to.🧐$BTC
#BTC #Crypto History #Market Watch #九月魔咒
🔹 In history, there has never been a case where both August and September rose for two consecutive months.
🔹 Instead, there are as many as 4 years where July and August both had consecutive gains, followed by a pullback in September.
That means September is more like a “cooling-off month,” not a “relay month.”
History won’t simply repeat, but the rhythm is worth paying attention to.🧐$BTC
#BTC #Crypto History #Market Watch #九月魔咒
花涧空
·
--
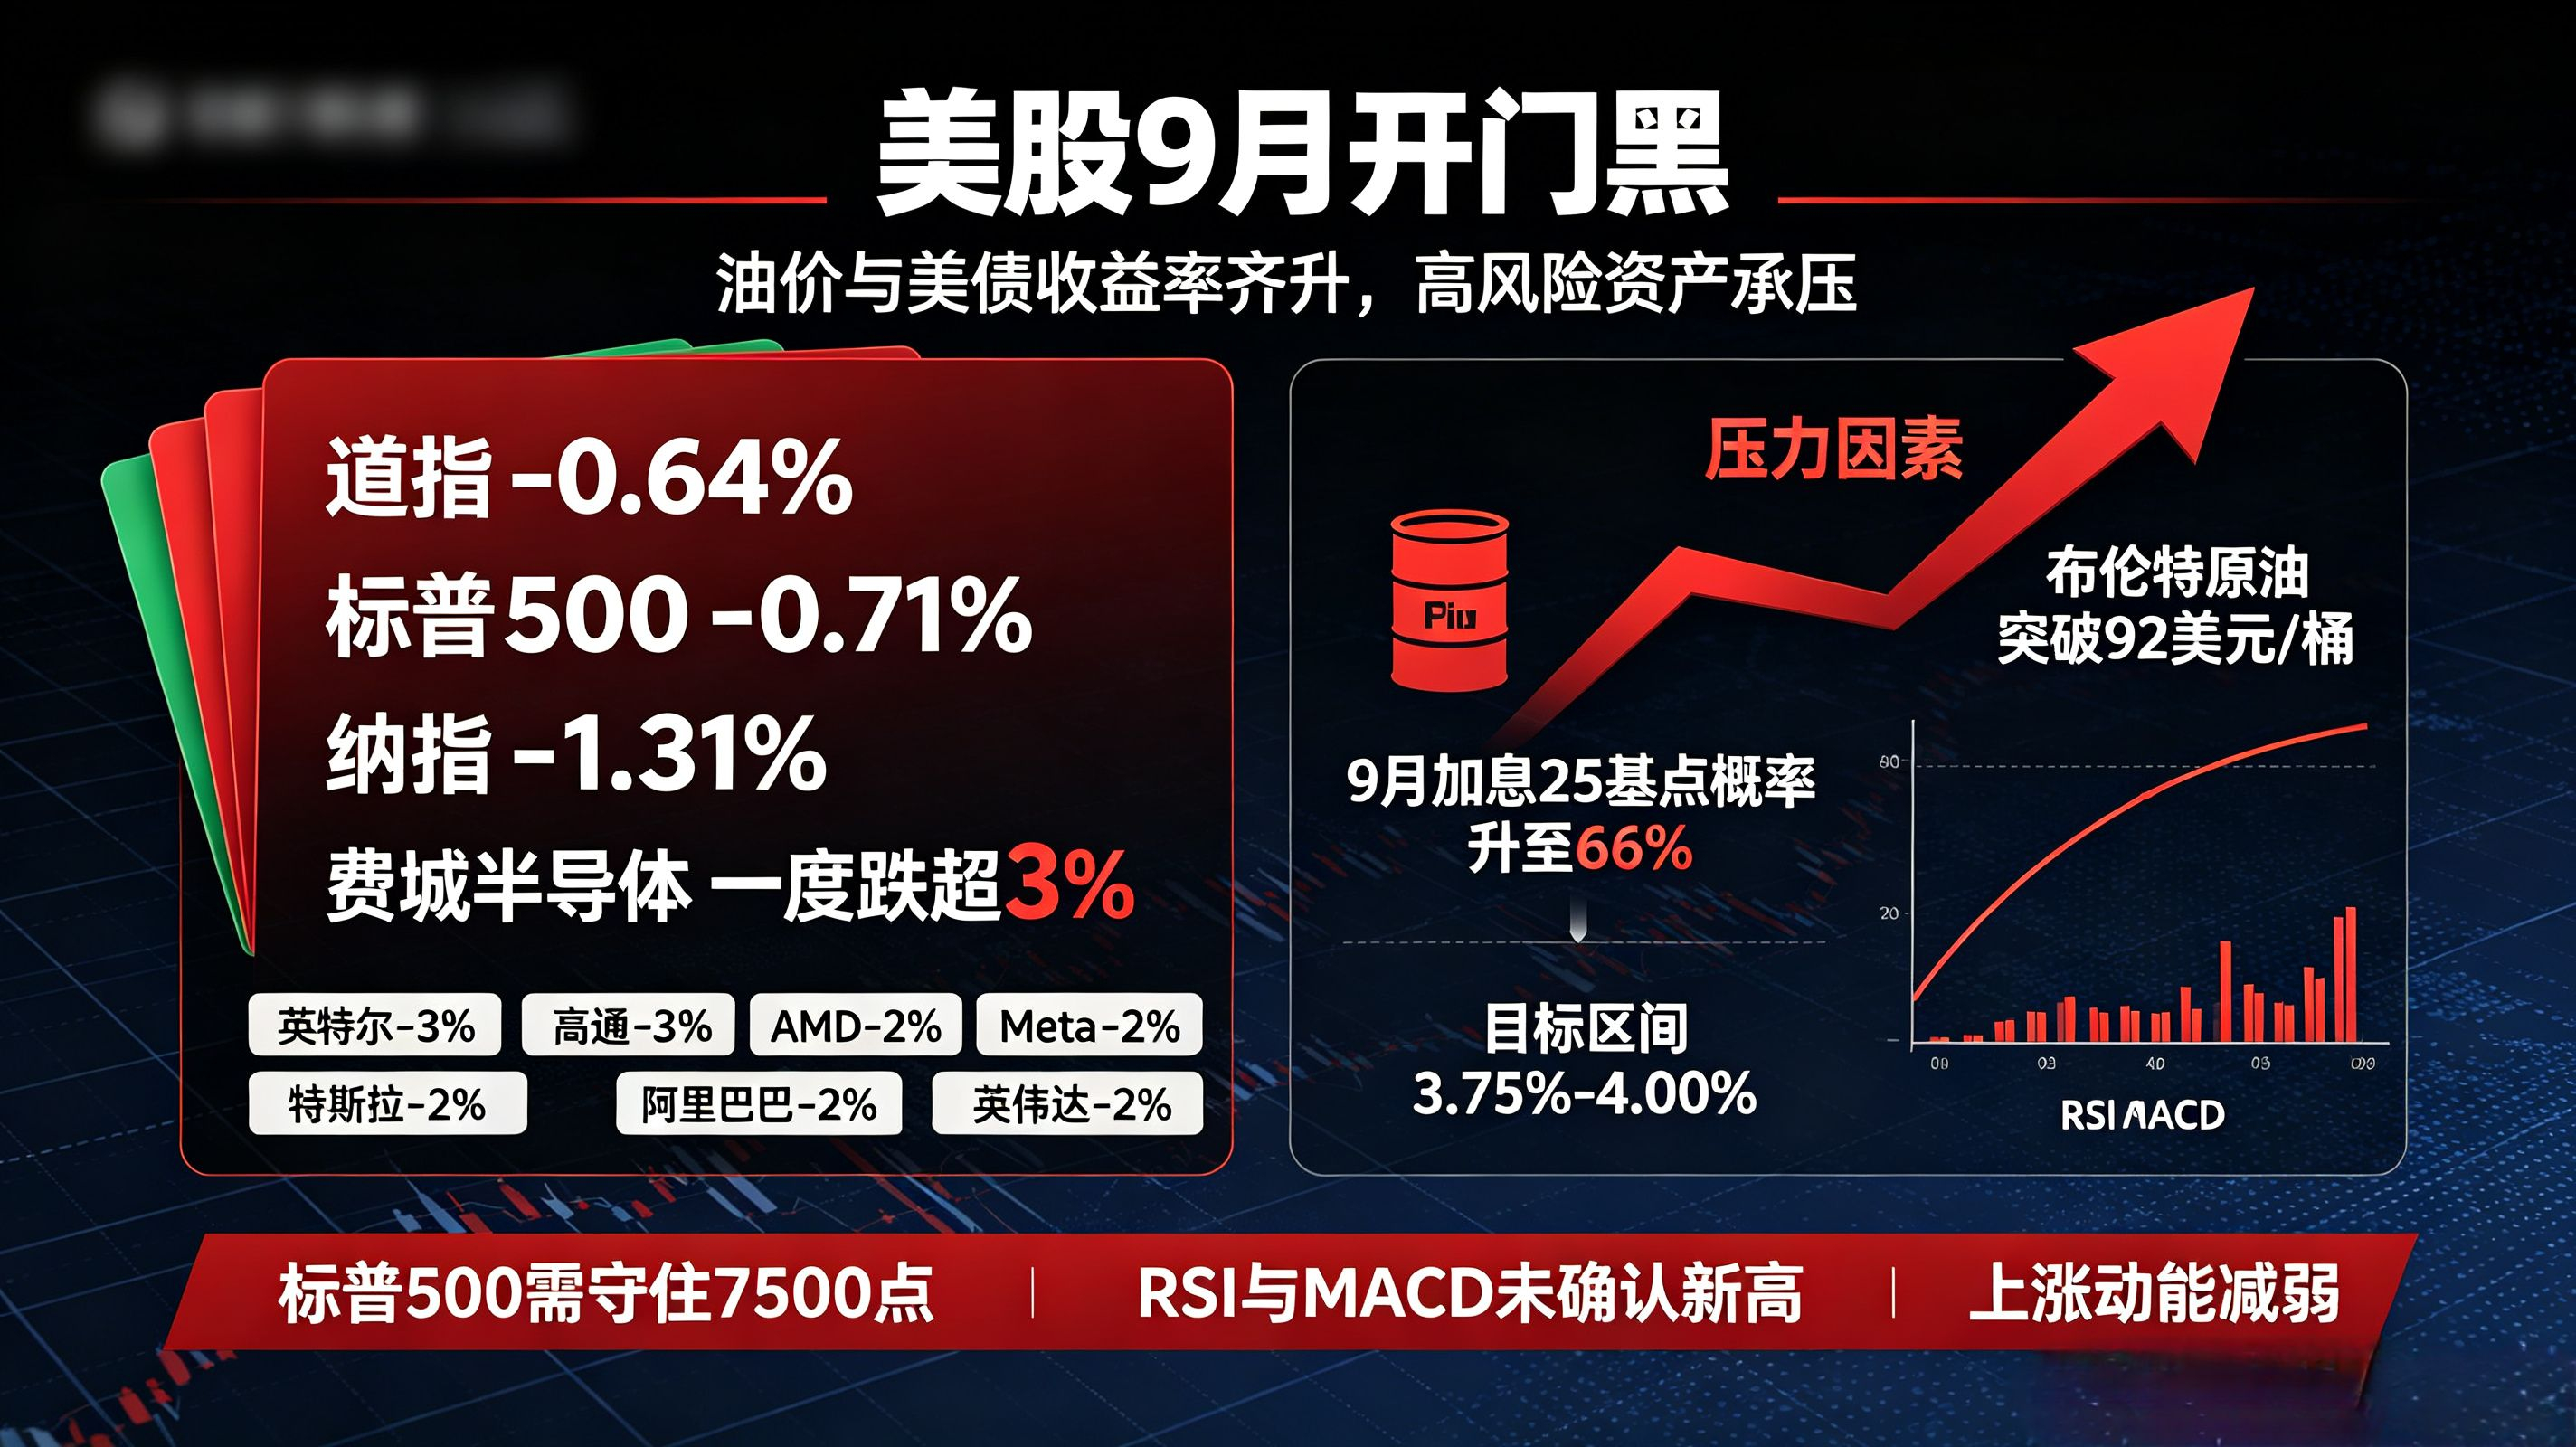
📢 US stocks see a “black opening” in September: oil prices and US Treasury yields rise together, putting pressure on high-risk assets
On September 1, the first trading day of the month, all three major US stock indexes opened lower. The Dow fell 0.64%, the S&P 500 dropped 0.71%, and the Nasdaq fell 1.31%. The Philadelphia Semiconductor Index once fell by more than 3%. Intel and Qualcomm both slid nearly 3%, while AMD and Meta fell more than 2%. Tesla, Alibaba, and Nvidia fell nearly 2%. $NVDAB $TSLAB
The core factor weighing on the market is that oil prices and global bond yields are moving higher in tandem. Brent crude broke through $92 per barrel during the session. With growing concerns about the situation in the Middle East and disruptions to shipping through the Strait of Hormuz, the market worries that energy prices and inflation will rise further, strengthening expectations for the Federal Reserve to raise rates. Currently, CME “FedWatch” shows the probability of a 25-basis-point rate hike in September to 3.75%-4.00% has risen to 66%.
Paul Ciana, a technical strategist at Bank of America, said that the upward breakout in the S&P 500 that began in August remains intact, but only if it holds above 7,500. Meanwhile, neither the RSI nor the MACD has confirmed the recent price highs, indicating that upside momentum is weakening. Ciana added that seasonal headwinds, election uncertainty, and rising front-end Treasury yields are presenting greater challenges to the market. Higher yields increase the risk that the stock market enters consolidation rather than accelerating higher.
Miller Tabak strategist Matt Maley also warned that the stock market had previously been able to ignore rising yields, but that doesn’t mean the pressure from high yields won’t eventually show up. JPMorgan believes that rising yields don’t necessarily become an insurmountable obstacle for a bull market, as they may reflect stronger momentum in economic activity.
On September 1, the first trading day of the month, all three major US stock indexes opened lower. The Dow fell 0.64%, the S&P 500 dropped 0.71%, and the Nasdaq fell 1.31%. The Philadelphia Semiconductor Index once fell by more than 3%. Intel and Qualcomm both slid nearly 3%, while AMD and Meta fell more than 2%. Tesla, Alibaba, and Nvidia fell nearly 2%. $NVDAB $TSLAB
The core factor weighing on the market is that oil prices and global bond yields are moving higher in tandem. Brent crude broke through $92 per barrel during the session. With growing concerns about the situation in the Middle East and disruptions to shipping through the Strait of Hormuz, the market worries that energy prices and inflation will rise further, strengthening expectations for the Federal Reserve to raise rates. Currently, CME “FedWatch” shows the probability of a 25-basis-point rate hike in September to 3.75%-4.00% has risen to 66%.
Paul Ciana, a technical strategist at Bank of America, said that the upward breakout in the S&P 500 that began in August remains intact, but only if it holds above 7,500. Meanwhile, neither the RSI nor the MACD has confirmed the recent price highs, indicating that upside momentum is weakening. Ciana added that seasonal headwinds, election uncertainty, and rising front-end Treasury yields are presenting greater challenges to the market. Higher yields increase the risk that the stock market enters consolidation rather than accelerating higher.
Miller Tabak strategist Matt Maley also warned that the stock market had previously been able to ignore rising yields, but that doesn’t mean the pressure from high yields won’t eventually show up. JPMorgan believes that rising yields don’t necessarily become an insurmountable obstacle for a bull market, as they may reflect stronger momentum in economic activity.
花涧空
·
--
📊 Historical data shows: between July and September, BTC has an interesting pattern—
🔹 In history, there has never been a case where both August and September rose for two consecutive months.
🔹 Instead, there are as many as 4 years where July and August both had consecutive gains, followed by a pullback in September.
That means September is more like a “cooling-off month,” not a “relay month.”
History won’t simply repeat, but the rhythm is worth paying attention to.🧐$BTC
#BTC #Crypto History #Market Watch #九月魔咒
🔹 In history, there has never been a case where both August and September rose for two consecutive months.
🔹 Instead, there are as many as 4 years where July and August both had consecutive gains, followed by a pullback in September.
That means September is more like a “cooling-off month,” not a “relay month.”
History won’t simply repeat, but the rhythm is worth paying attention to.🧐$BTC
#BTC #Crypto History #Market Watch #九月魔咒
花涧空
·
--
📢 US stocks see a “black opening” in September: oil prices and US Treasury yields rise together, putting pressure on high-risk assets
On September 1, the first trading day of the month, all three major US stock indexes opened lower. The Dow fell 0.64%, the S&P 500 dropped 0.71%, and the Nasdaq fell 1.31%. The Philadelphia Semiconductor Index once fell by more than 3%. Intel and Qualcomm both slid nearly 3%, while AMD and Meta fell more than 2%. Tesla, Alibaba, and Nvidia fell nearly 2%. $NVDAB $TSLAB
The core factor weighing on the market is that oil prices and global bond yields are moving higher in tandem. Brent crude broke through $92 per barrel during the session. With growing concerns about the situation in the Middle East and disruptions to shipping through the Strait of Hormuz, the market worries that energy prices and inflation will rise further, strengthening expectations for the Federal Reserve to raise rates. Currently, CME “FedWatch” shows the probability of a 25-basis-point rate hike in September to 3.75%-4.00% has risen to 66%.
Paul Ciana, a technical strategist at Bank of America, said that the upward breakout in the S&P 500 that began in August remains intact, but only if it holds above 7,500. Meanwhile, neither the RSI nor the MACD has confirmed the recent price highs, indicating that upside momentum is weakening. Ciana added that seasonal headwinds, election uncertainty, and rising front-end Treasury yields are presenting greater challenges to the market. Higher yields increase the risk that the stock market enters consolidation rather than accelerating higher.
Miller Tabak strategist Matt Maley also warned that the stock market had previously been able to ignore rising yields, but that doesn’t mean the pressure from high yields won’t eventually show up. JPMorgan believes that rising yields don’t necessarily become an insurmountable obstacle for a bull market, as they may reflect stronger momentum in economic activity.
On September 1, the first trading day of the month, all three major US stock indexes opened lower. The Dow fell 0.64%, the S&P 500 dropped 0.71%, and the Nasdaq fell 1.31%. The Philadelphia Semiconductor Index once fell by more than 3%. Intel and Qualcomm both slid nearly 3%, while AMD and Meta fell more than 2%. Tesla, Alibaba, and Nvidia fell nearly 2%. $NVDAB $TSLAB
The core factor weighing on the market is that oil prices and global bond yields are moving higher in tandem. Brent crude broke through $92 per barrel during the session. With growing concerns about the situation in the Middle East and disruptions to shipping through the Strait of Hormuz, the market worries that energy prices and inflation will rise further, strengthening expectations for the Federal Reserve to raise rates. Currently, CME “FedWatch” shows the probability of a 25-basis-point rate hike in September to 3.75%-4.00% has risen to 66%.
Paul Ciana, a technical strategist at Bank of America, said that the upward breakout in the S&P 500 that began in August remains intact, but only if it holds above 7,500. Meanwhile, neither the RSI nor the MACD has confirmed the recent price highs, indicating that upside momentum is weakening. Ciana added that seasonal headwinds, election uncertainty, and rising front-end Treasury yields are presenting greater challenges to the market. Higher yields increase the risk that the stock market enters consolidation rather than accelerating higher.
Miller Tabak strategist Matt Maley also warned that the stock market had previously been able to ignore rising yields, but that doesn’t mean the pressure from high yields won’t eventually show up. JPMorgan believes that rising yields don’t necessarily become an insurmountable obstacle for a bull market, as they may reflect stronger momentum in economic activity.
Partly True
📢 US stocks see a “black opening” in September: oil prices and US Treasury yields rise together, putting pressure on high-risk assets
On September 1, the first trading day of the month, all three major US stock indexes opened lower. The Dow fell 0.64%, the S&P 500 dropped 0.71%, and the Nasdaq fell 1.31%. The Philadelphia Semiconductor Index once fell by more than 3%. Intel and Qualcomm both slid nearly 3%, while AMD and Meta fell more than 2%. Tesla, Alibaba, and Nvidia fell nearly 2%. $NVDAB $TSLAB
The core factor weighing on the market is that oil prices and global bond yields are moving higher in tandem. Brent crude broke through $92 per barrel during the session. With growing concerns about the situation in the Middle East and disruptions to shipping through the Strait of Hormuz, the market worries that energy prices and inflation will rise further, strengthening expectations for the Federal Reserve to raise rates. Currently, CME “FedWatch” shows the probability of a 25-basis-point rate hike in September to 3.75%-4.00% has risen to 66%.
Paul Ciana, a technical strategist at Bank of America, said that the upward breakout in the S&P 500 that began in August remains intact, but only if it holds above 7,500. Meanwhile, neither the RSI nor the MACD has confirmed the recent price highs, indicating that upside momentum is weakening. Ciana added that seasonal headwinds, election uncertainty, and rising front-end Treasury yields are presenting greater challenges to the market. Higher yields increase the risk that the stock market enters consolidation rather than accelerating higher.
Miller Tabak strategist Matt Maley also warned that the stock market had previously been able to ignore rising yields, but that doesn’t mean the pressure from high yields won’t eventually show up. JPMorgan believes that rising yields don’t necessarily become an insurmountable obstacle for a bull market, as they may reflect stronger momentum in economic activity.
On September 1, the first trading day of the month, all three major US stock indexes opened lower. The Dow fell 0.64%, the S&P 500 dropped 0.71%, and the Nasdaq fell 1.31%. The Philadelphia Semiconductor Index once fell by more than 3%. Intel and Qualcomm both slid nearly 3%, while AMD and Meta fell more than 2%. Tesla, Alibaba, and Nvidia fell nearly 2%. $NVDAB $TSLAB
The core factor weighing on the market is that oil prices and global bond yields are moving higher in tandem. Brent crude broke through $92 per barrel during the session. With growing concerns about the situation in the Middle East and disruptions to shipping through the Strait of Hormuz, the market worries that energy prices and inflation will rise further, strengthening expectations for the Federal Reserve to raise rates. Currently, CME “FedWatch” shows the probability of a 25-basis-point rate hike in September to 3.75%-4.00% has risen to 66%.
Paul Ciana, a technical strategist at Bank of America, said that the upward breakout in the S&P 500 that began in August remains intact, but only if it holds above 7,500. Meanwhile, neither the RSI nor the MACD has confirmed the recent price highs, indicating that upside momentum is weakening. Ciana added that seasonal headwinds, election uncertainty, and rising front-end Treasury yields are presenting greater challenges to the market. Higher yields increase the risk that the stock market enters consolidation rather than accelerating higher.
Miller Tabak strategist Matt Maley also warned that the stock market had previously been able to ignore rising yields, but that doesn’t mean the pressure from high yields won’t eventually show up. JPMorgan believes that rising yields don’t necessarily become an insurmountable obstacle for a bull market, as they may reflect stronger momentum in economic activity.
📢 Gold and silver fall to two-week lows; global bond yields surge, weighing on precious metals
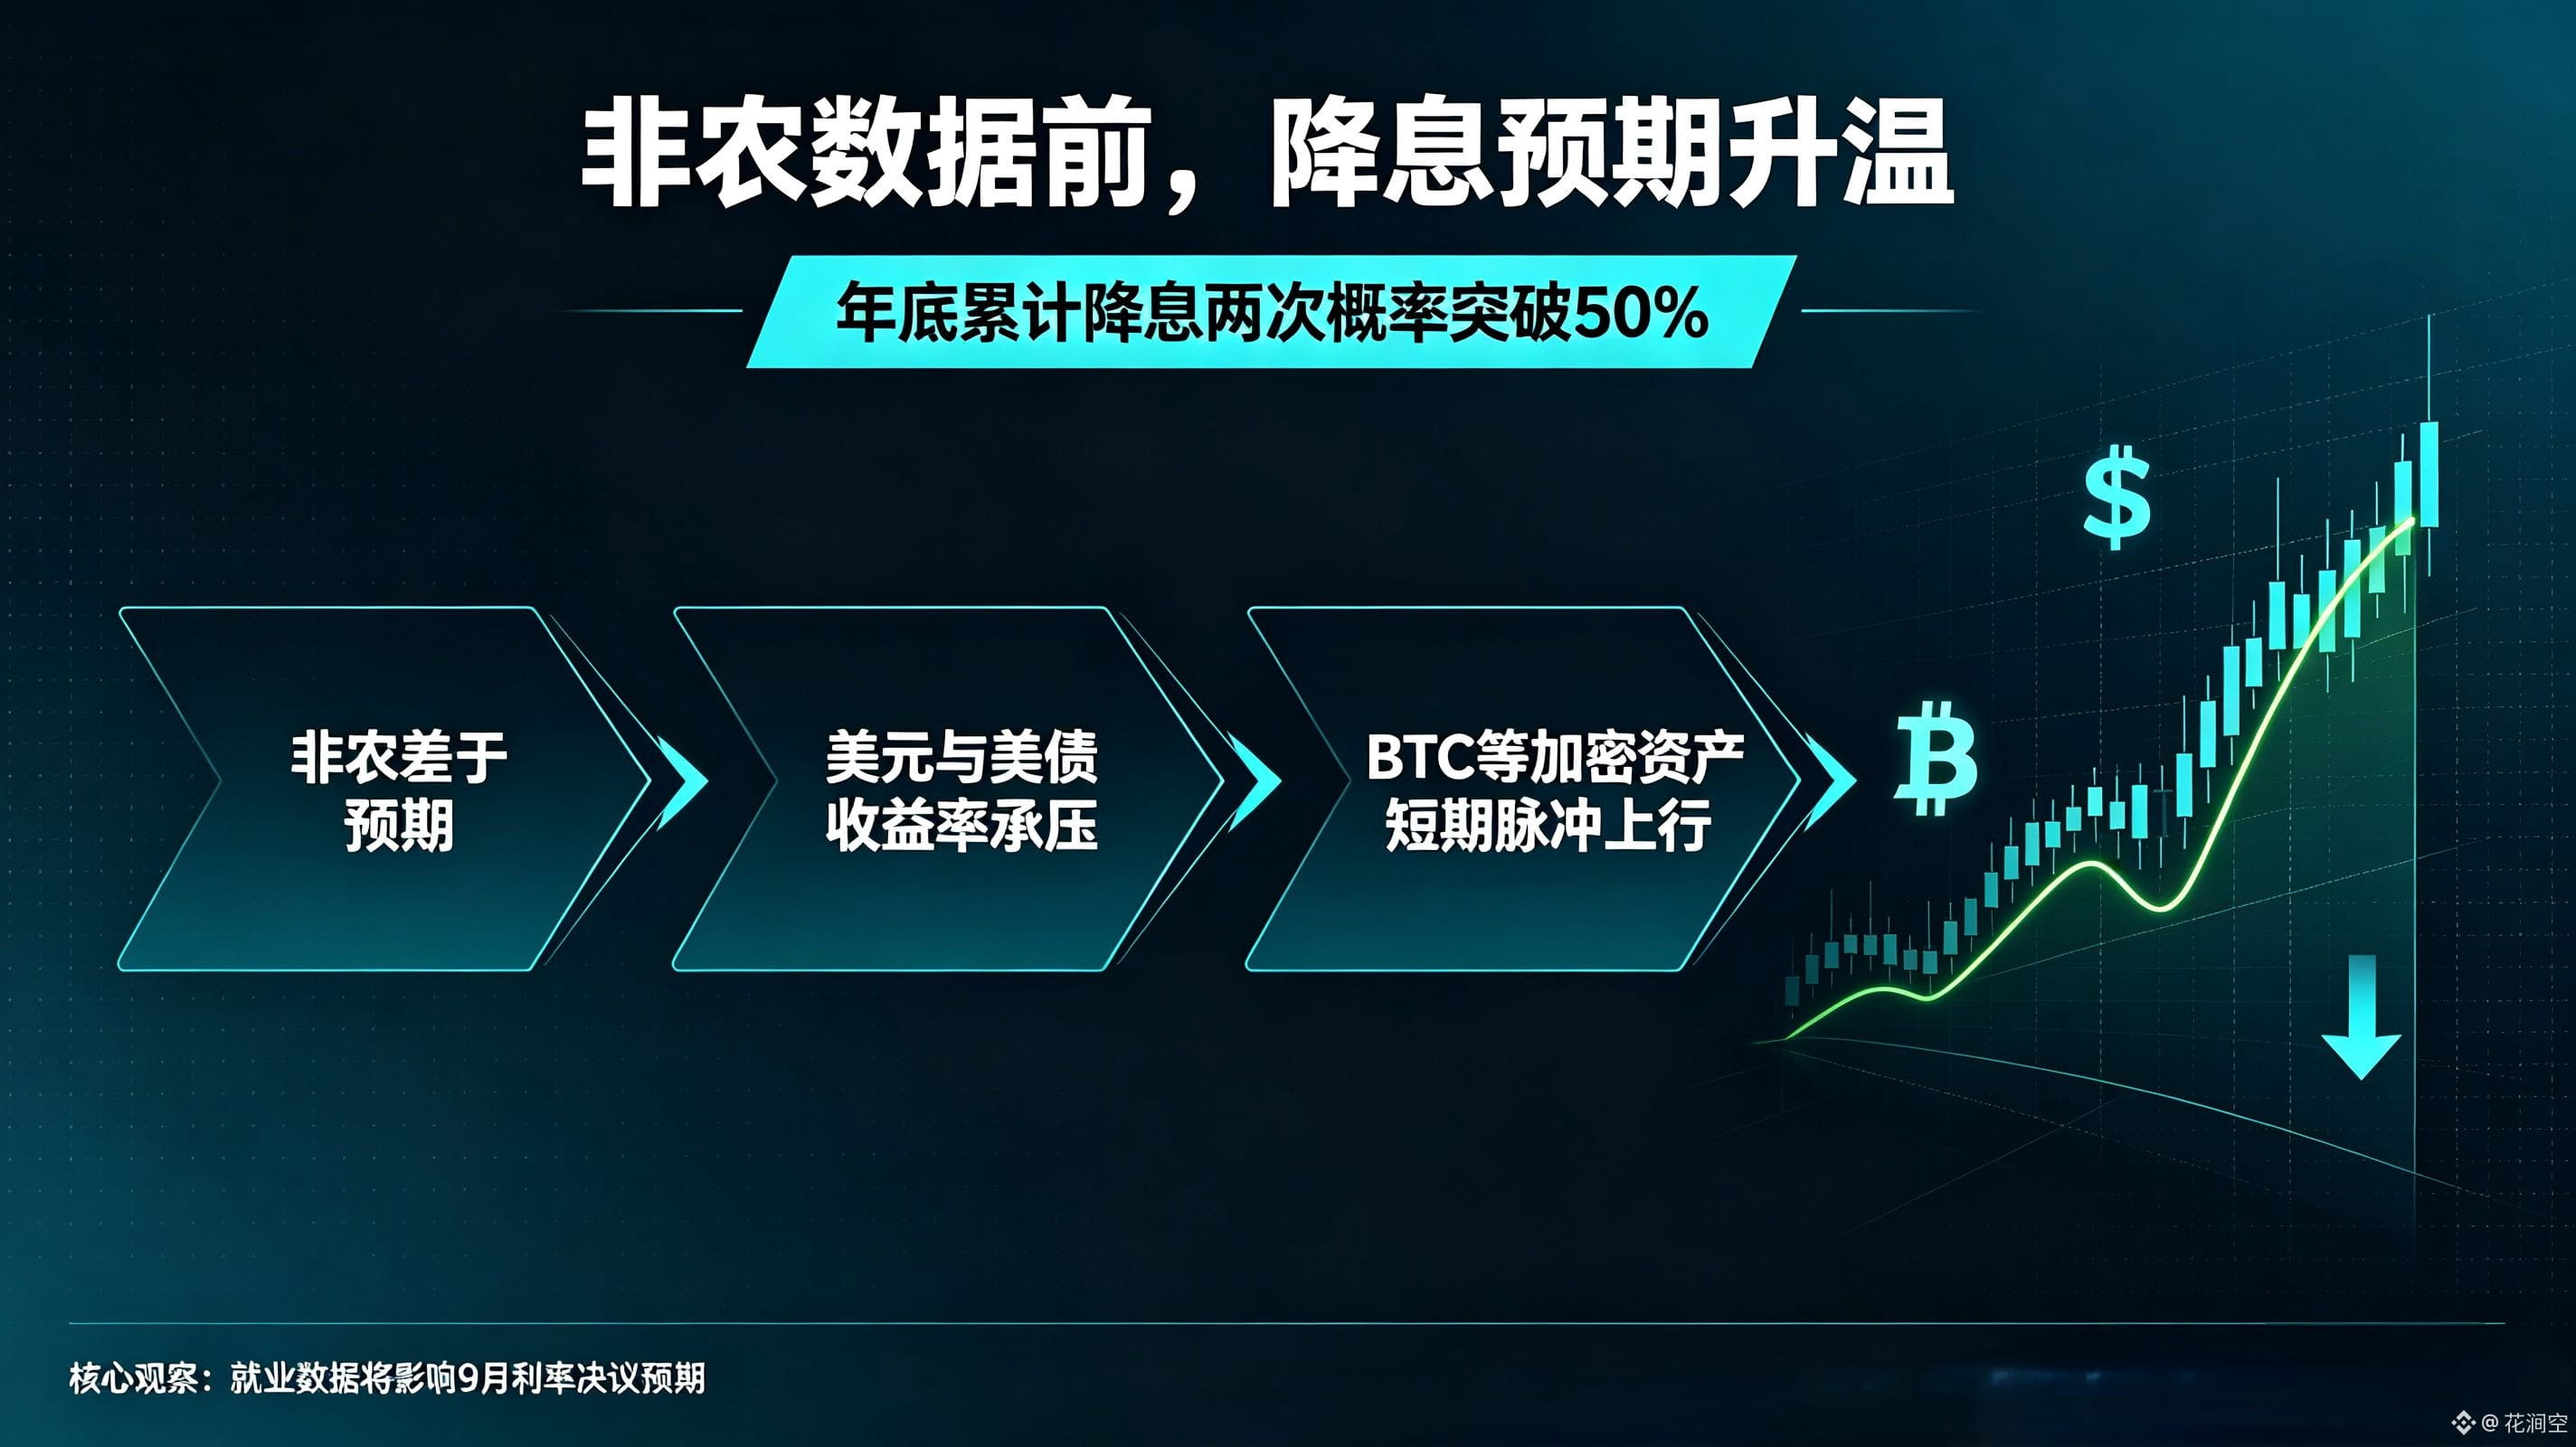
On September 1, according to Binance market data, gold and silver prices continued their recent downtrend. Amid widespread selloffs in major global bond markets and a rapid rise in long-term yields, safe-haven demand for precious metals was temporarily suppressed by the pressure of high interest rates. Spot gold fell intraday by nearly 1.8% at one point to around $4,370 per ounce, marking a new low since August 19; spot silver dropped by nearly 3% to around $64.5 per ounce.
That day, the yield on the U.S. 10-year Treasury note rose above 4.75%, Germany’s 10-year Treasury yield climbed to a 15-year high, and Japan’s 10-year Treasury yield broke above 3% for the first time since 1996. With market worries over an escalation in the situation in the Middle East pushing oil prices higher and stoking inflation, major central banks may be forced to maintain tightening policies—or even raise rates further—thereby continuously increasing the opportunity cost of holding non-yielding assets such as gold.
The market will next focus on the ADP employment data on September 2 and the U.S. nonfarm payrolls report on September 4 to gauge the Federal Reserve’s rate-hike expectations and the subsequent trend in bond yields.
$XAUT
$XAG
On September 1, according to Binance market data, gold and silver prices continued their recent downtrend. Amid widespread selloffs in major global bond markets and a rapid rise in long-term yields, safe-haven demand for precious metals was temporarily suppressed by the pressure of high interest rates. Spot gold fell intraday by nearly 1.8% at one point to around $4,370 per ounce, marking a new low since August 19; spot silver dropped by nearly 3% to around $64.5 per ounce.
That day, the yield on the U.S. 10-year Treasury note rose above 4.75%, Germany’s 10-year Treasury yield climbed to a 15-year high, and Japan’s 10-year Treasury yield broke above 3% for the first time since 1996. With market worries over an escalation in the situation in the Middle East pushing oil prices higher and stoking inflation, major central banks may be forced to maintain tightening policies—or even raise rates further—thereby continuously increasing the opportunity cost of holding non-yielding assets such as gold.
The market will next focus on the ADP employment data on September 2 and the U.S. nonfarm payrolls report on September 4 to gauge the Federal Reserve’s rate-hike expectations and the subsequent trend in bond yields.
$XAUT
$XAG
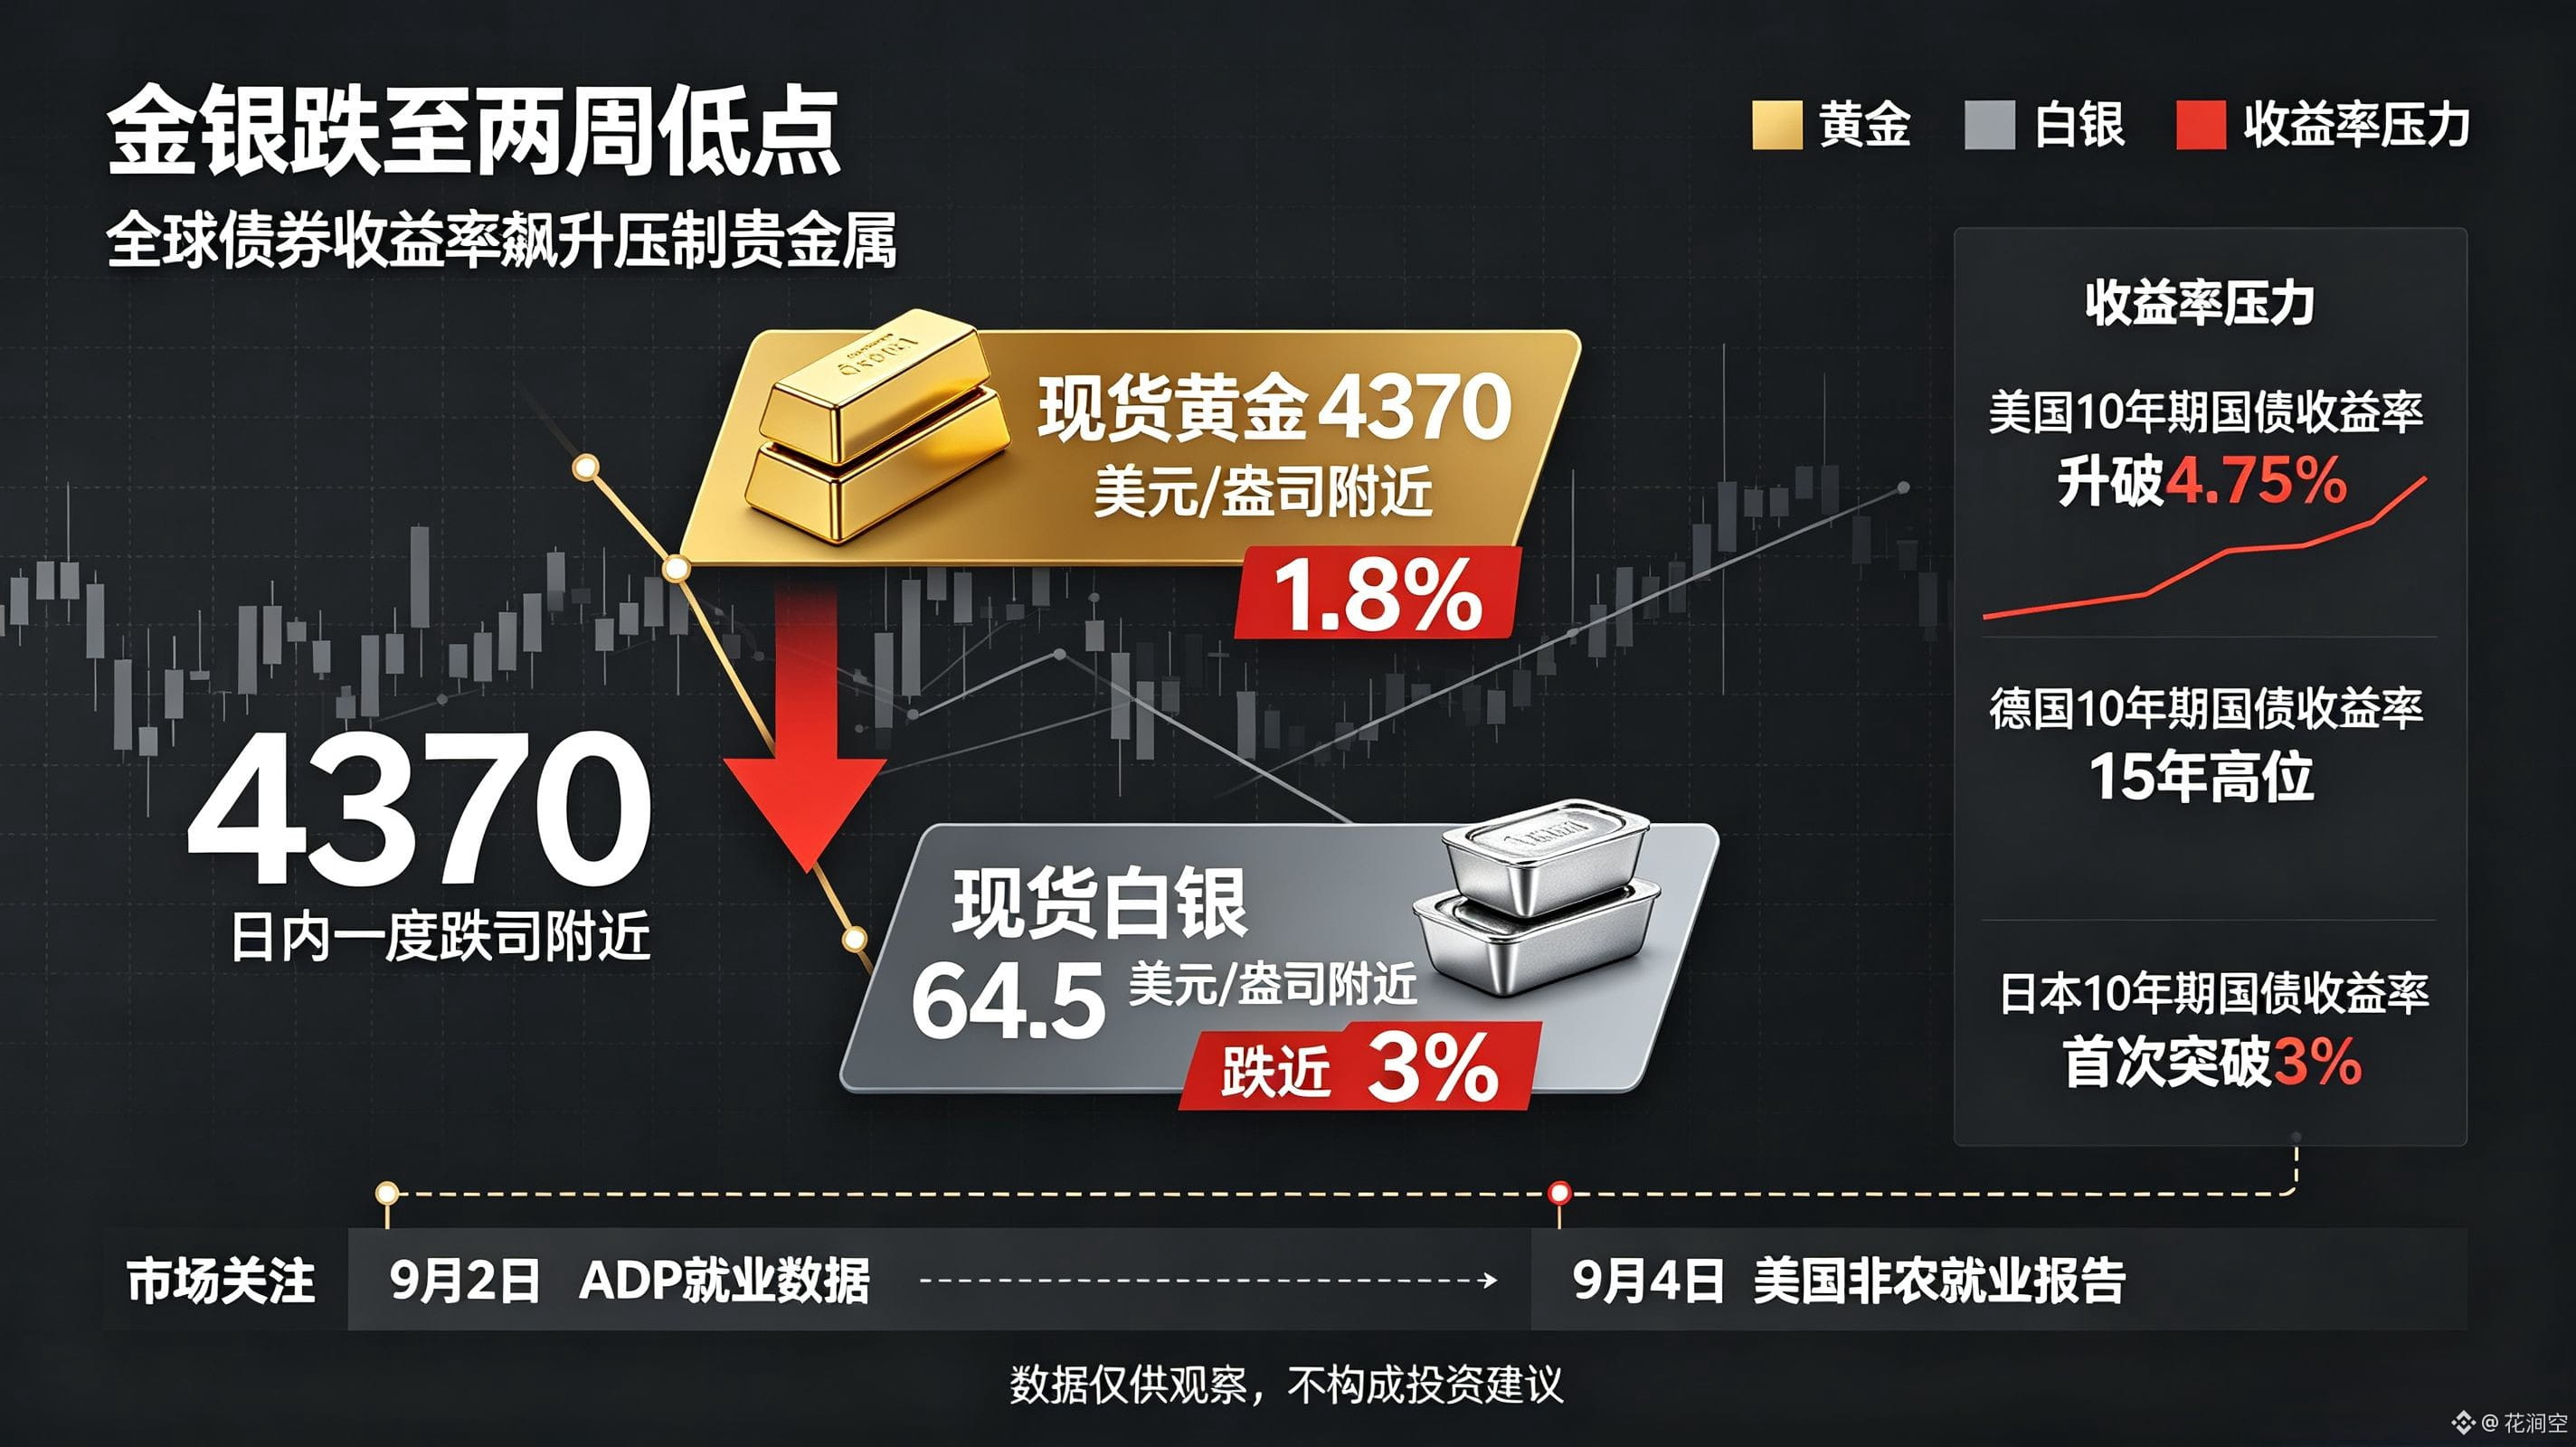
✨September Outlook Is Here
【Current Market Snapshot】
Total market cap is about $2.66 trillion, down 2.16% over the past 24 hours. BTC dominance is 59.2%, ETH is 11.2%. Overall, it’s a typical weak range-bound market, with capital clumping around BTC.
✨✨✨✨✨
【Key Scenarios for September】
1️⃣ The Fed is the biggest variable. Current federal funds rate is 3.75%, and the 10-year US Treasury yield is 4.65%—liquidity is still relatively tight. The good news: September rate-hike expectations are cooling down. Goldman Sachs even said the market is too hawkish, giving risk assets some breathing room.
2️⃣ BTC just violently rebounded from around $63,586 to near $80,000—up more than 20% in a week. But note: it hasn’t reclaimed this year’s losses yet. $97,900 (the year-to-date high) is the true bull vs. bear line.
3️⃣ Institutional script: 60% probability it holds above $58k–$60k, and 40% probability it retests $50k–$58k. A rebound doesn’t equal a reversal—trade the “market repair” first.
✨✨✨✨✨
【Sector Opportunities】
🔥 RWA surged +47% in 24h, and tokenized assets are up an eye-watering +97%! Capital is moving toward “on-chain compliant assets”—this is the brightest narrative for September.
❄️ Meme sector -4.2%, AI sector -3.3%. The hype is cooling off—don’t rush to chase big buys; let the bullets fly for a bit.
🔍 On the hot search list, new faces like Pons, Seeker, and Cash Cat have strong trading volumes. In short-term sentiment trades, everyone is crowding into DEXs to fight it out.
✨✨✨✨✨
【Trading Approach】
Spot crowd: If BTC dips back to $75k–$80k, scale in. Stop strictly if it breaks below $70k. Don’t increase position size before it stands firm above $97,900.
De-gens crowd: On BSC, be patient and wait for the new narrative to ignite—don’t catch the knife at the emotional low point. Money won’t disappoint smart babies, but de-gens will~
#比特币8月上涨23%跑赢黄金股市
Crypto assets are not legally protected on the Chinese mainland and do not constitute investment advice.
【Current Market Snapshot】
Total market cap is about $2.66 trillion, down 2.16% over the past 24 hours. BTC dominance is 59.2%, ETH is 11.2%. Overall, it’s a typical weak range-bound market, with capital clumping around BTC.
✨✨✨✨✨
【Key Scenarios for September】
1️⃣ The Fed is the biggest variable. Current federal funds rate is 3.75%, and the 10-year US Treasury yield is 4.65%—liquidity is still relatively tight. The good news: September rate-hike expectations are cooling down. Goldman Sachs even said the market is too hawkish, giving risk assets some breathing room.
2️⃣ BTC just violently rebounded from around $63,586 to near $80,000—up more than 20% in a week. But note: it hasn’t reclaimed this year’s losses yet. $97,900 (the year-to-date high) is the true bull vs. bear line.
3️⃣ Institutional script: 60% probability it holds above $58k–$60k, and 40% probability it retests $50k–$58k. A rebound doesn’t equal a reversal—trade the “market repair” first.
✨✨✨✨✨
【Sector Opportunities】
🔥 RWA surged +47% in 24h, and tokenized assets are up an eye-watering +97%! Capital is moving toward “on-chain compliant assets”—this is the brightest narrative for September.
❄️ Meme sector -4.2%, AI sector -3.3%. The hype is cooling off—don’t rush to chase big buys; let the bullets fly for a bit.
🔍 On the hot search list, new faces like Pons, Seeker, and Cash Cat have strong trading volumes. In short-term sentiment trades, everyone is crowding into DEXs to fight it out.
✨✨✨✨✨
【Trading Approach】
Spot crowd: If BTC dips back to $75k–$80k, scale in. Stop strictly if it breaks below $70k. Don’t increase position size before it stands firm above $97,900.
De-gens crowd: On BSC, be patient and wait for the new narrative to ignite—don’t catch the knife at the emotional low point. Money won’t disappoint smart babies, but de-gens will~
#比特币8月上涨23%跑赢黄金股市
Crypto assets are not legally protected on the Chinese mainland and do not constitute investment advice.
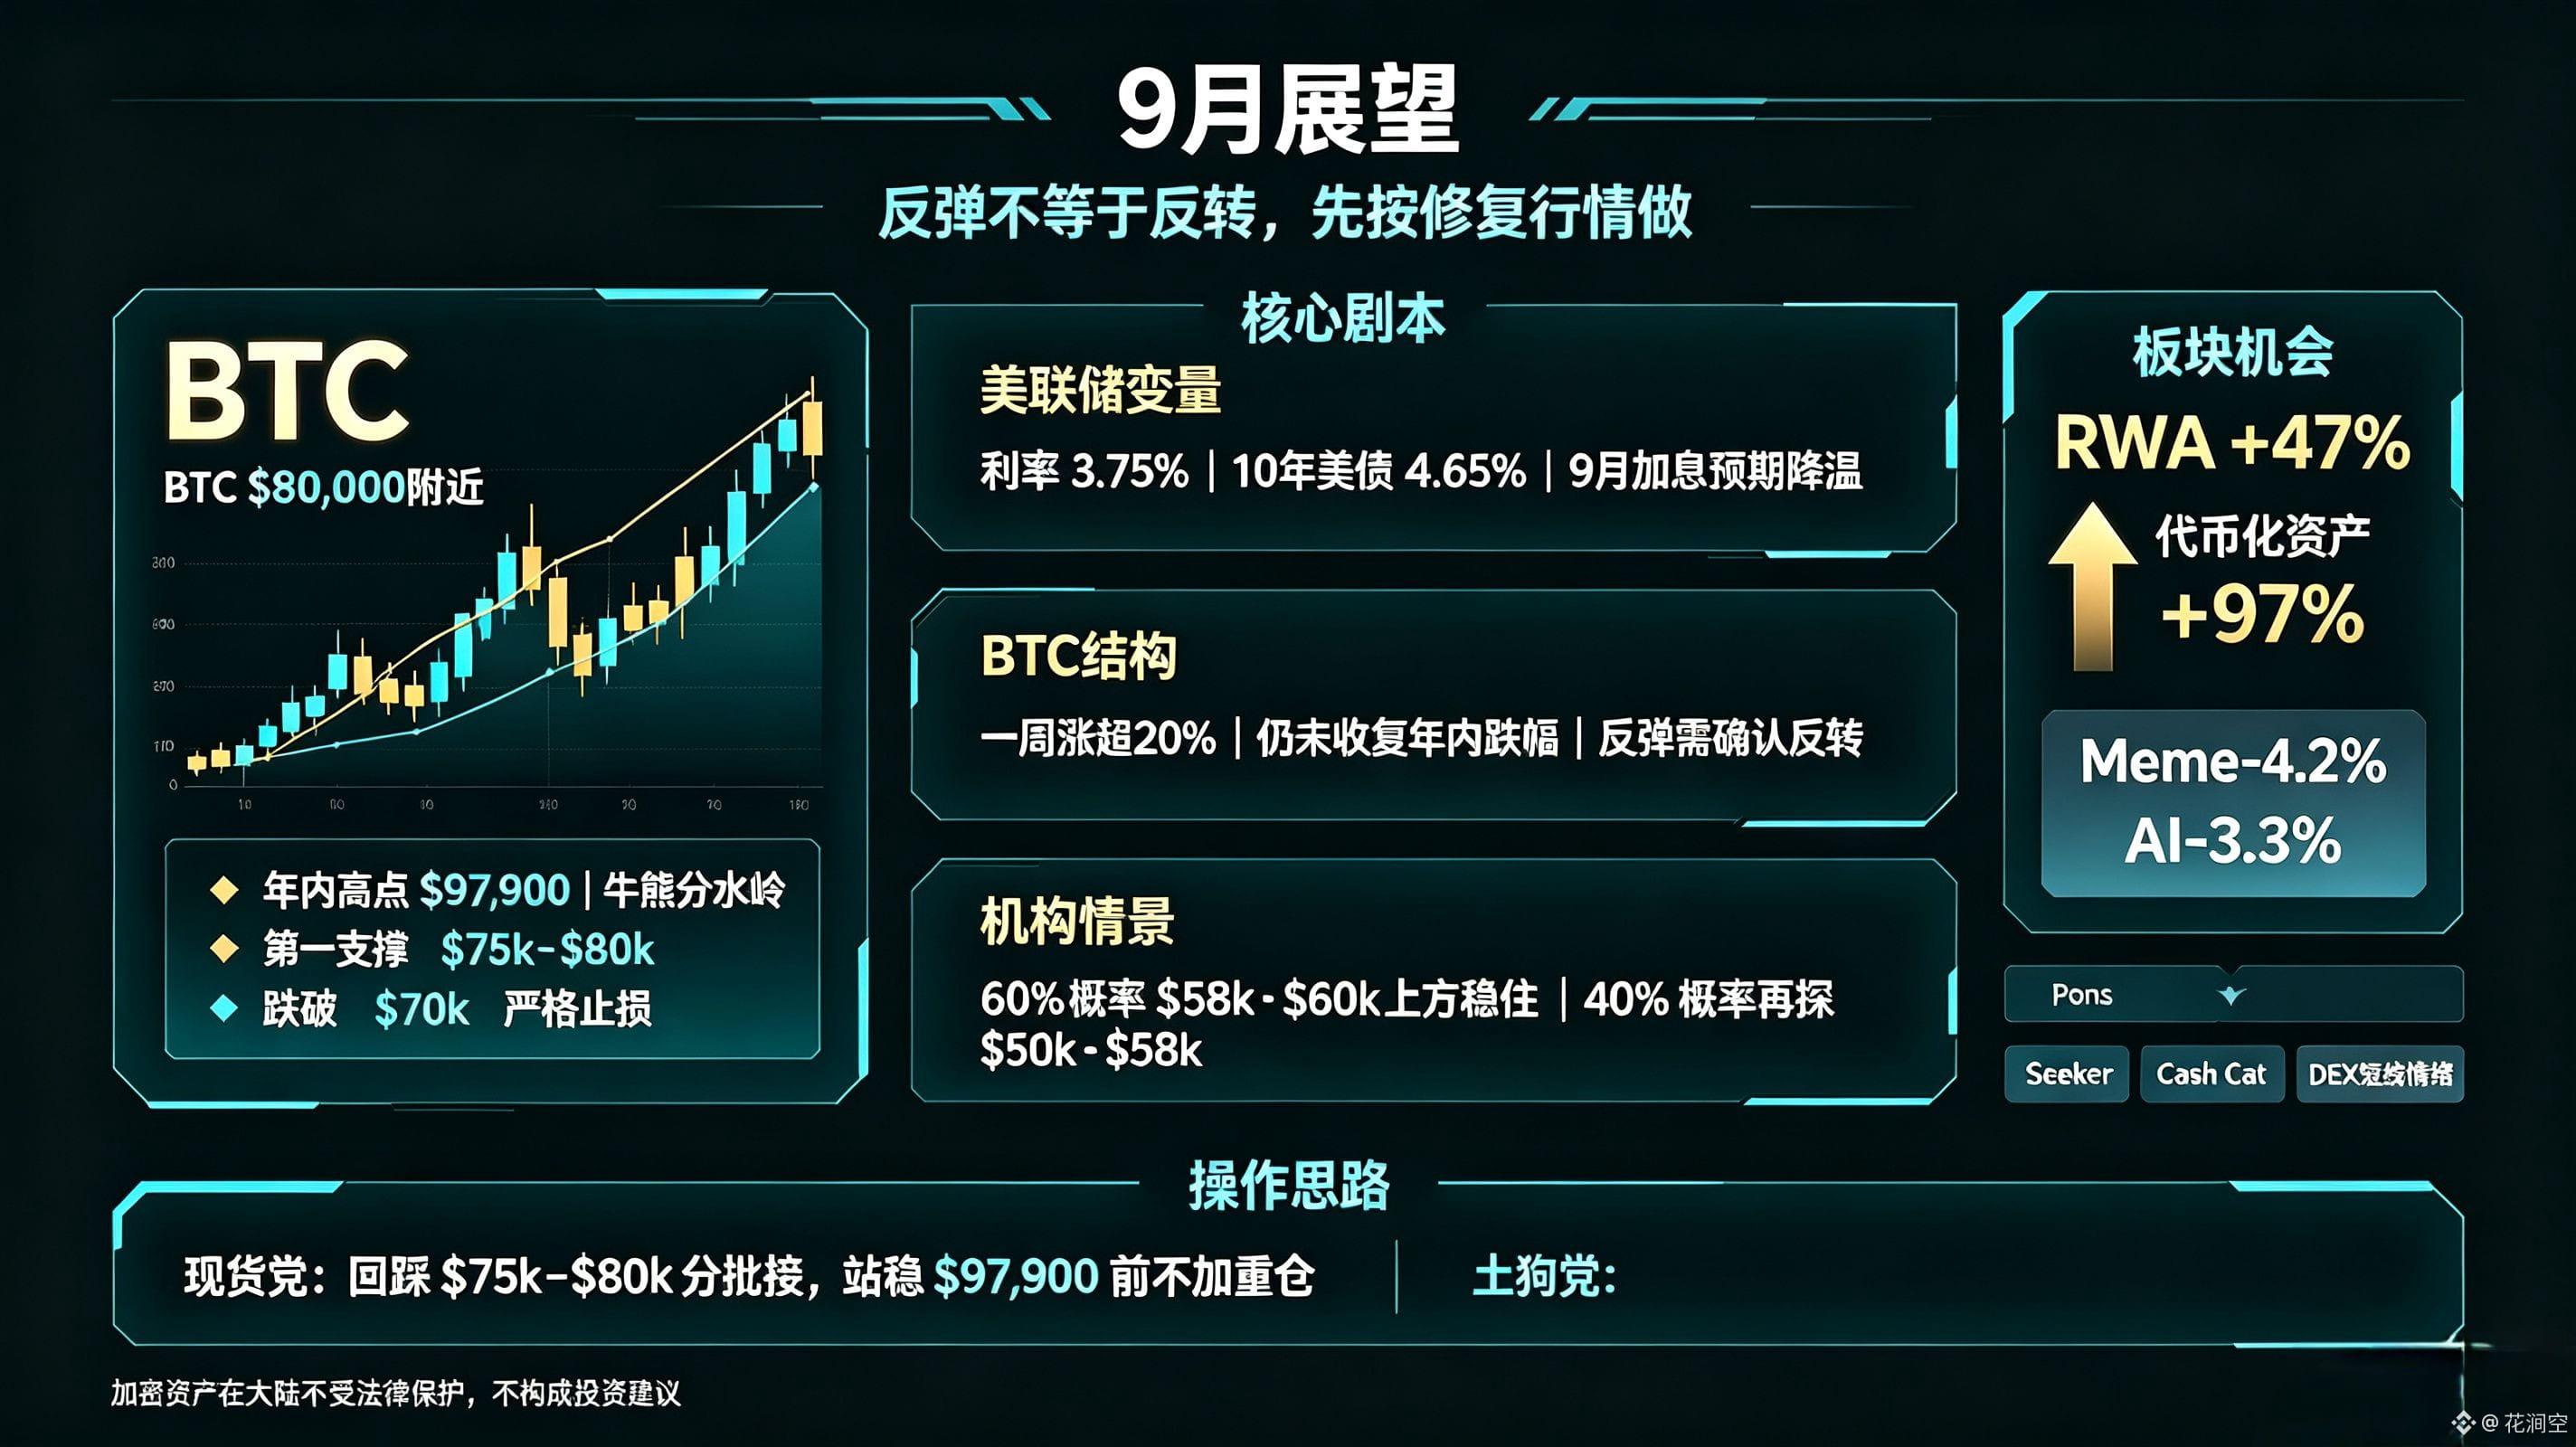
✨ This is the strongest August for BTC in the past 10 years—the comeback battle was fought beautifully~
【Market Overview】
🟢 BTC’s August cumulative gain is +25.58%, the strongest August since 2017. It briefly touched an $81k high intraday, then pulled back, and is now consolidating around $78,325.
🟢 ETH is “getting its share” too, around $2,450—its weekly chart was once up about +30%. Institutional capital has clearly started rotating from BTC into ETH.
📊 Total global market cap is $2.63T. BTC dominance is 59.7%. The past 24h saw a small pullback of 2.6%, but overall it’s still a bull-market structure.$BTC
$ETH
✨✨✨✨✨
【Flows: Institutions are scrambling to accumulate】
💰 Net inflows into BTC spot ETFs are as high as $2.6 billion for the week. BlackRock’s IBIT alone pulled in $503 million in a single day—this kind of force can only come from large institutions.
💰 ETH ETF inflows are also strong. Coupled with the rotation in market share, the powder keg of alt-season has already been set.
✨✨✨✨✨
【Macro & Policy】
🏛️ At the Jackson Hole annual conference on August 28, Fed Chair Warsh talked about inflation and innovation. PCE is still stuck at 3.7%, so rate cuts aren’t coming that fast—but the market is still rallying.
📜 The momentum for the U.S. CLARITY Act is heating up. September is a key milestone. Policy-wise, sentiment is shifting from being suppressed by negative factors to a compliant narrative—this reversal in market mood is crucial.
✨✨✨✨✨
【Hot Sectors】
🔥 Top trending across the network: PONS, Seeker(SKR), Pump.fun(PUMP), HYPE, XMR are all blowing up.
🔥 The capital narrative is clearly shifting toward AI / RWA / DePIN. Alt rotations are accelerating—choosing the right sector matters more than stubbornly holding.
🐮 The BSC chain you often watch isn’t the main battleground this time. Mainstream capital is focused on the BTC/ETH camp and the AI narrative.
【Trading Suggestions】
🎯 August ran up too hard—be prepared for high-level consolidation and pullbacks in September. $75k is BTC’s first support; if it breaks, watch $72k.
🎯 Don’t chase. Wait for the pullback and then get in; ETH is relatively strong, so it’s worth focusing on.
🎯 Don’t blindly chase big money. The main storyline here is institutional narrative, not a “shitcoin” market. First secure your mainstream positioning.
⚠️The above is only a market recap and does not constitute investment advice
#比特币8月上涨23%跑赢黄金股市
【Market Overview】
🟢 BTC’s August cumulative gain is +25.58%, the strongest August since 2017. It briefly touched an $81k high intraday, then pulled back, and is now consolidating around $78,325.
🟢 ETH is “getting its share” too, around $2,450—its weekly chart was once up about +30%. Institutional capital has clearly started rotating from BTC into ETH.
📊 Total global market cap is $2.63T. BTC dominance is 59.7%. The past 24h saw a small pullback of 2.6%, but overall it’s still a bull-market structure.$BTC
$ETH
✨✨✨✨✨
【Flows: Institutions are scrambling to accumulate】
💰 Net inflows into BTC spot ETFs are as high as $2.6 billion for the week. BlackRock’s IBIT alone pulled in $503 million in a single day—this kind of force can only come from large institutions.
💰 ETH ETF inflows are also strong. Coupled with the rotation in market share, the powder keg of alt-season has already been set.
✨✨✨✨✨
【Macro & Policy】
🏛️ At the Jackson Hole annual conference on August 28, Fed Chair Warsh talked about inflation and innovation. PCE is still stuck at 3.7%, so rate cuts aren’t coming that fast—but the market is still rallying.
📜 The momentum for the U.S. CLARITY Act is heating up. September is a key milestone. Policy-wise, sentiment is shifting from being suppressed by negative factors to a compliant narrative—this reversal in market mood is crucial.
✨✨✨✨✨
【Hot Sectors】
🔥 Top trending across the network: PONS, Seeker(SKR), Pump.fun(PUMP), HYPE, XMR are all blowing up.
🔥 The capital narrative is clearly shifting toward AI / RWA / DePIN. Alt rotations are accelerating—choosing the right sector matters more than stubbornly holding.
🐮 The BSC chain you often watch isn’t the main battleground this time. Mainstream capital is focused on the BTC/ETH camp and the AI narrative.
【Trading Suggestions】
🎯 August ran up too hard—be prepared for high-level consolidation and pullbacks in September. $75k is BTC’s first support; if it breaks, watch $72k.
🎯 Don’t chase. Wait for the pullback and then get in; ETH is relatively strong, so it’s worth focusing on.
🎯 Don’t blindly chase big money. The main storyline here is institutional narrative, not a “shitcoin” market. First secure your mainstream positioning.
⚠️The above is only a market recap and does not constitute investment advice
#比特币8月上涨23%跑赢黄金股市
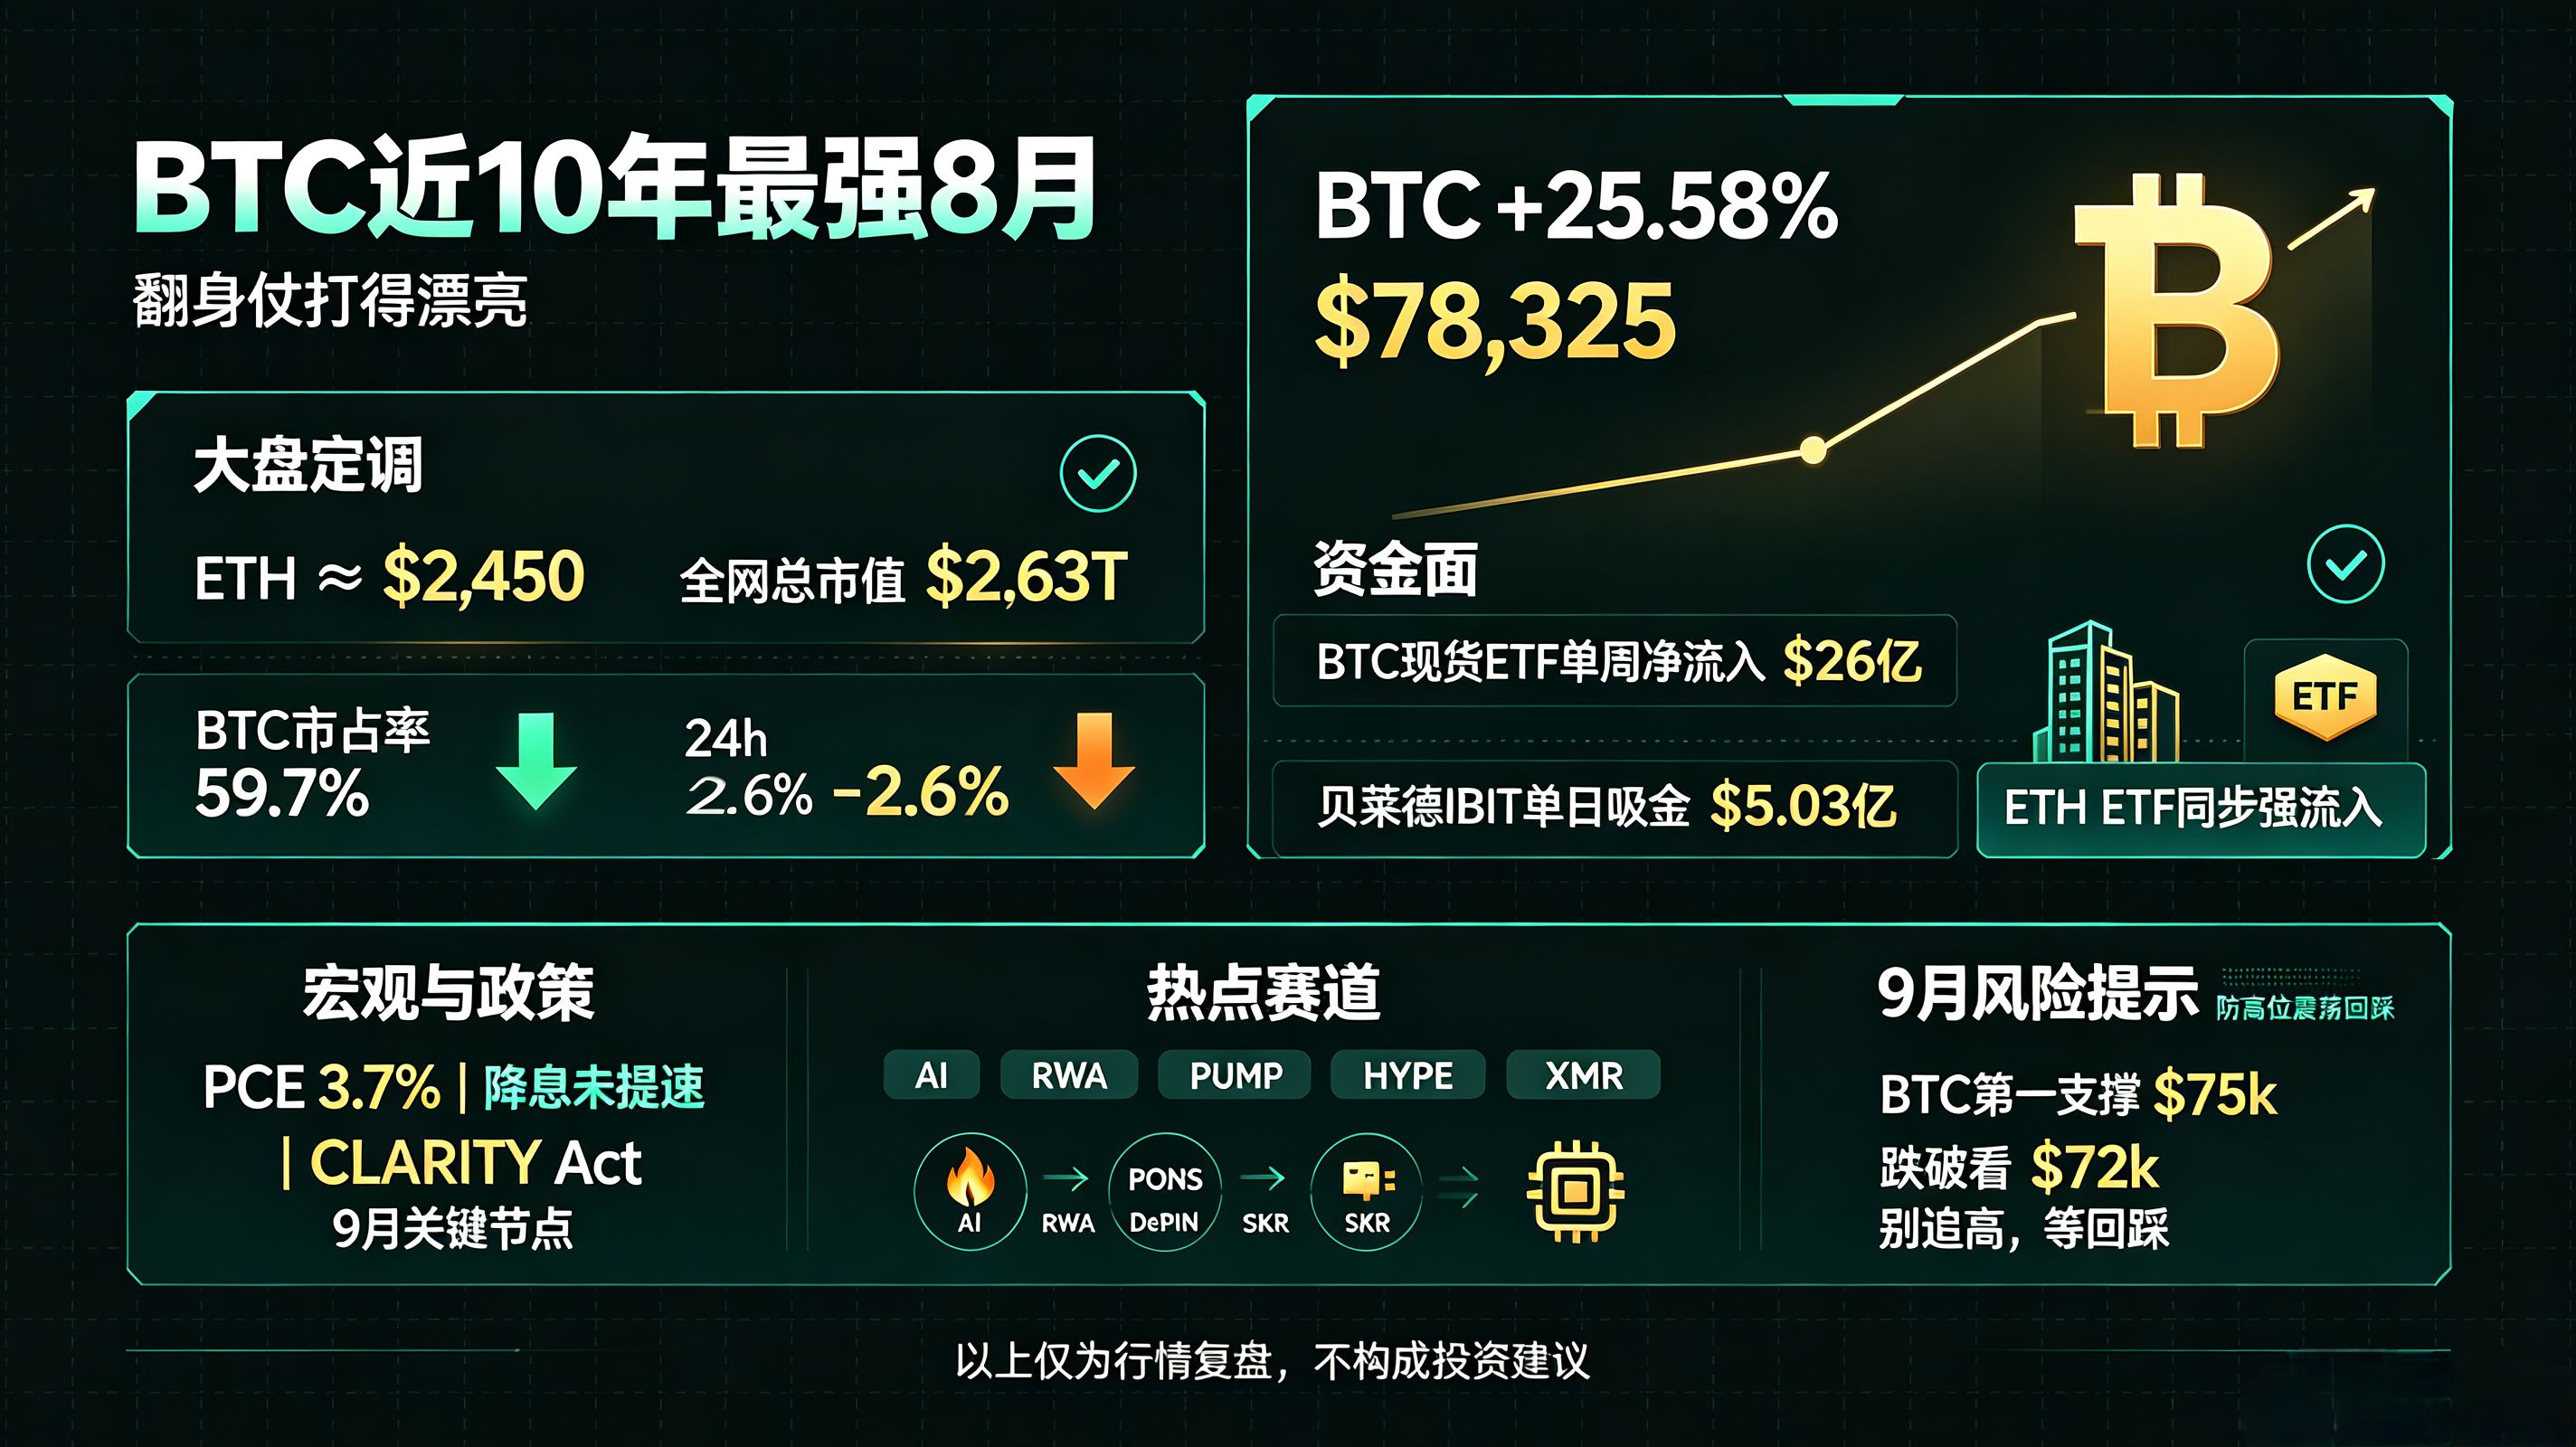
📢 Before the U.S. Non-Farm Payrolls data, the probability of the Fed cutting rates twice by year-end exceeds 50%
This Friday, the U.S. Non-Farm Employment data is about to be released and will become a key indicator shaping the core direction of the September rate decision. According to CME data, the market’s odds of two cumulative rate cuts by year-end have already surpassed 50%, and expectations for rate cuts are heating up significantly. (😏 modest positive)
Impact analysis: If employment weakens, it will pressure the Federal Reserve to accelerate rate cuts, improving macro liquidity and lifting risk-asset pricing. As rate-cut expectations rise, the stronger outlook will weigh on the U.S. dollar, and funds are likely to flow toward high-volatility risk markets.
If the Non-Farm data comes in worse than expected, impact on the crypto market:
A significant miss versus expectations would further reinforce the market’s “rate-cut trade.” U.S. Treasury yields and the dollar would fall, while interest-rate-sensitive crypto assets such as Bitcoin and Ethereum could easily see a short-term spike higher. Major coins may benefit from a liquidity premium, lifting overall market risk appetite. However, it’s important to note that if the data is so weak that it reflects a serious risk of a hard economic downturn, risk-off sentiment may take the upper hand—causing crypto assets to pull back alongside U.S. stocks, resulting in the “good news turns into bad news” scenario. At the moment of the Non-Farm release, trading volatility will also surge sharply, making wick spiking and rapid back-and-forth scanning of positions relatively common.
$BTC
Potential investment opportunities: If the Non-Farm data is worse than expected, you could consider short-term trading opportunities in interest-rate-sensitive projects, and be sure to manage position sizing and stop-loss controls.
⚠️ Macroeconomic data is for reference only. Crypto assets are extremely volatile and this does not constitute investment advice.
#BTC #非农就业数据
This Friday, the U.S. Non-Farm Employment data is about to be released and will become a key indicator shaping the core direction of the September rate decision. According to CME data, the market’s odds of two cumulative rate cuts by year-end have already surpassed 50%, and expectations for rate cuts are heating up significantly. (😏 modest positive)
Impact analysis: If employment weakens, it will pressure the Federal Reserve to accelerate rate cuts, improving macro liquidity and lifting risk-asset pricing. As rate-cut expectations rise, the stronger outlook will weigh on the U.S. dollar, and funds are likely to flow toward high-volatility risk markets.
If the Non-Farm data comes in worse than expected, impact on the crypto market:
A significant miss versus expectations would further reinforce the market’s “rate-cut trade.” U.S. Treasury yields and the dollar would fall, while interest-rate-sensitive crypto assets such as Bitcoin and Ethereum could easily see a short-term spike higher. Major coins may benefit from a liquidity premium, lifting overall market risk appetite. However, it’s important to note that if the data is so weak that it reflects a serious risk of a hard economic downturn, risk-off sentiment may take the upper hand—causing crypto assets to pull back alongside U.S. stocks, resulting in the “good news turns into bad news” scenario. At the moment of the Non-Farm release, trading volatility will also surge sharply, making wick spiking and rapid back-and-forth scanning of positions relatively common.
$BTC
Potential investment opportunities: If the Non-Farm data is worse than expected, you could consider short-term trading opportunities in interest-rate-sensitive projects, and be sure to manage position sizing and stop-loss controls.
⚠️ Macroeconomic data is for reference only. Crypto assets are extremely volatile and this does not constitute investment advice.
#BTC #非农就业数据
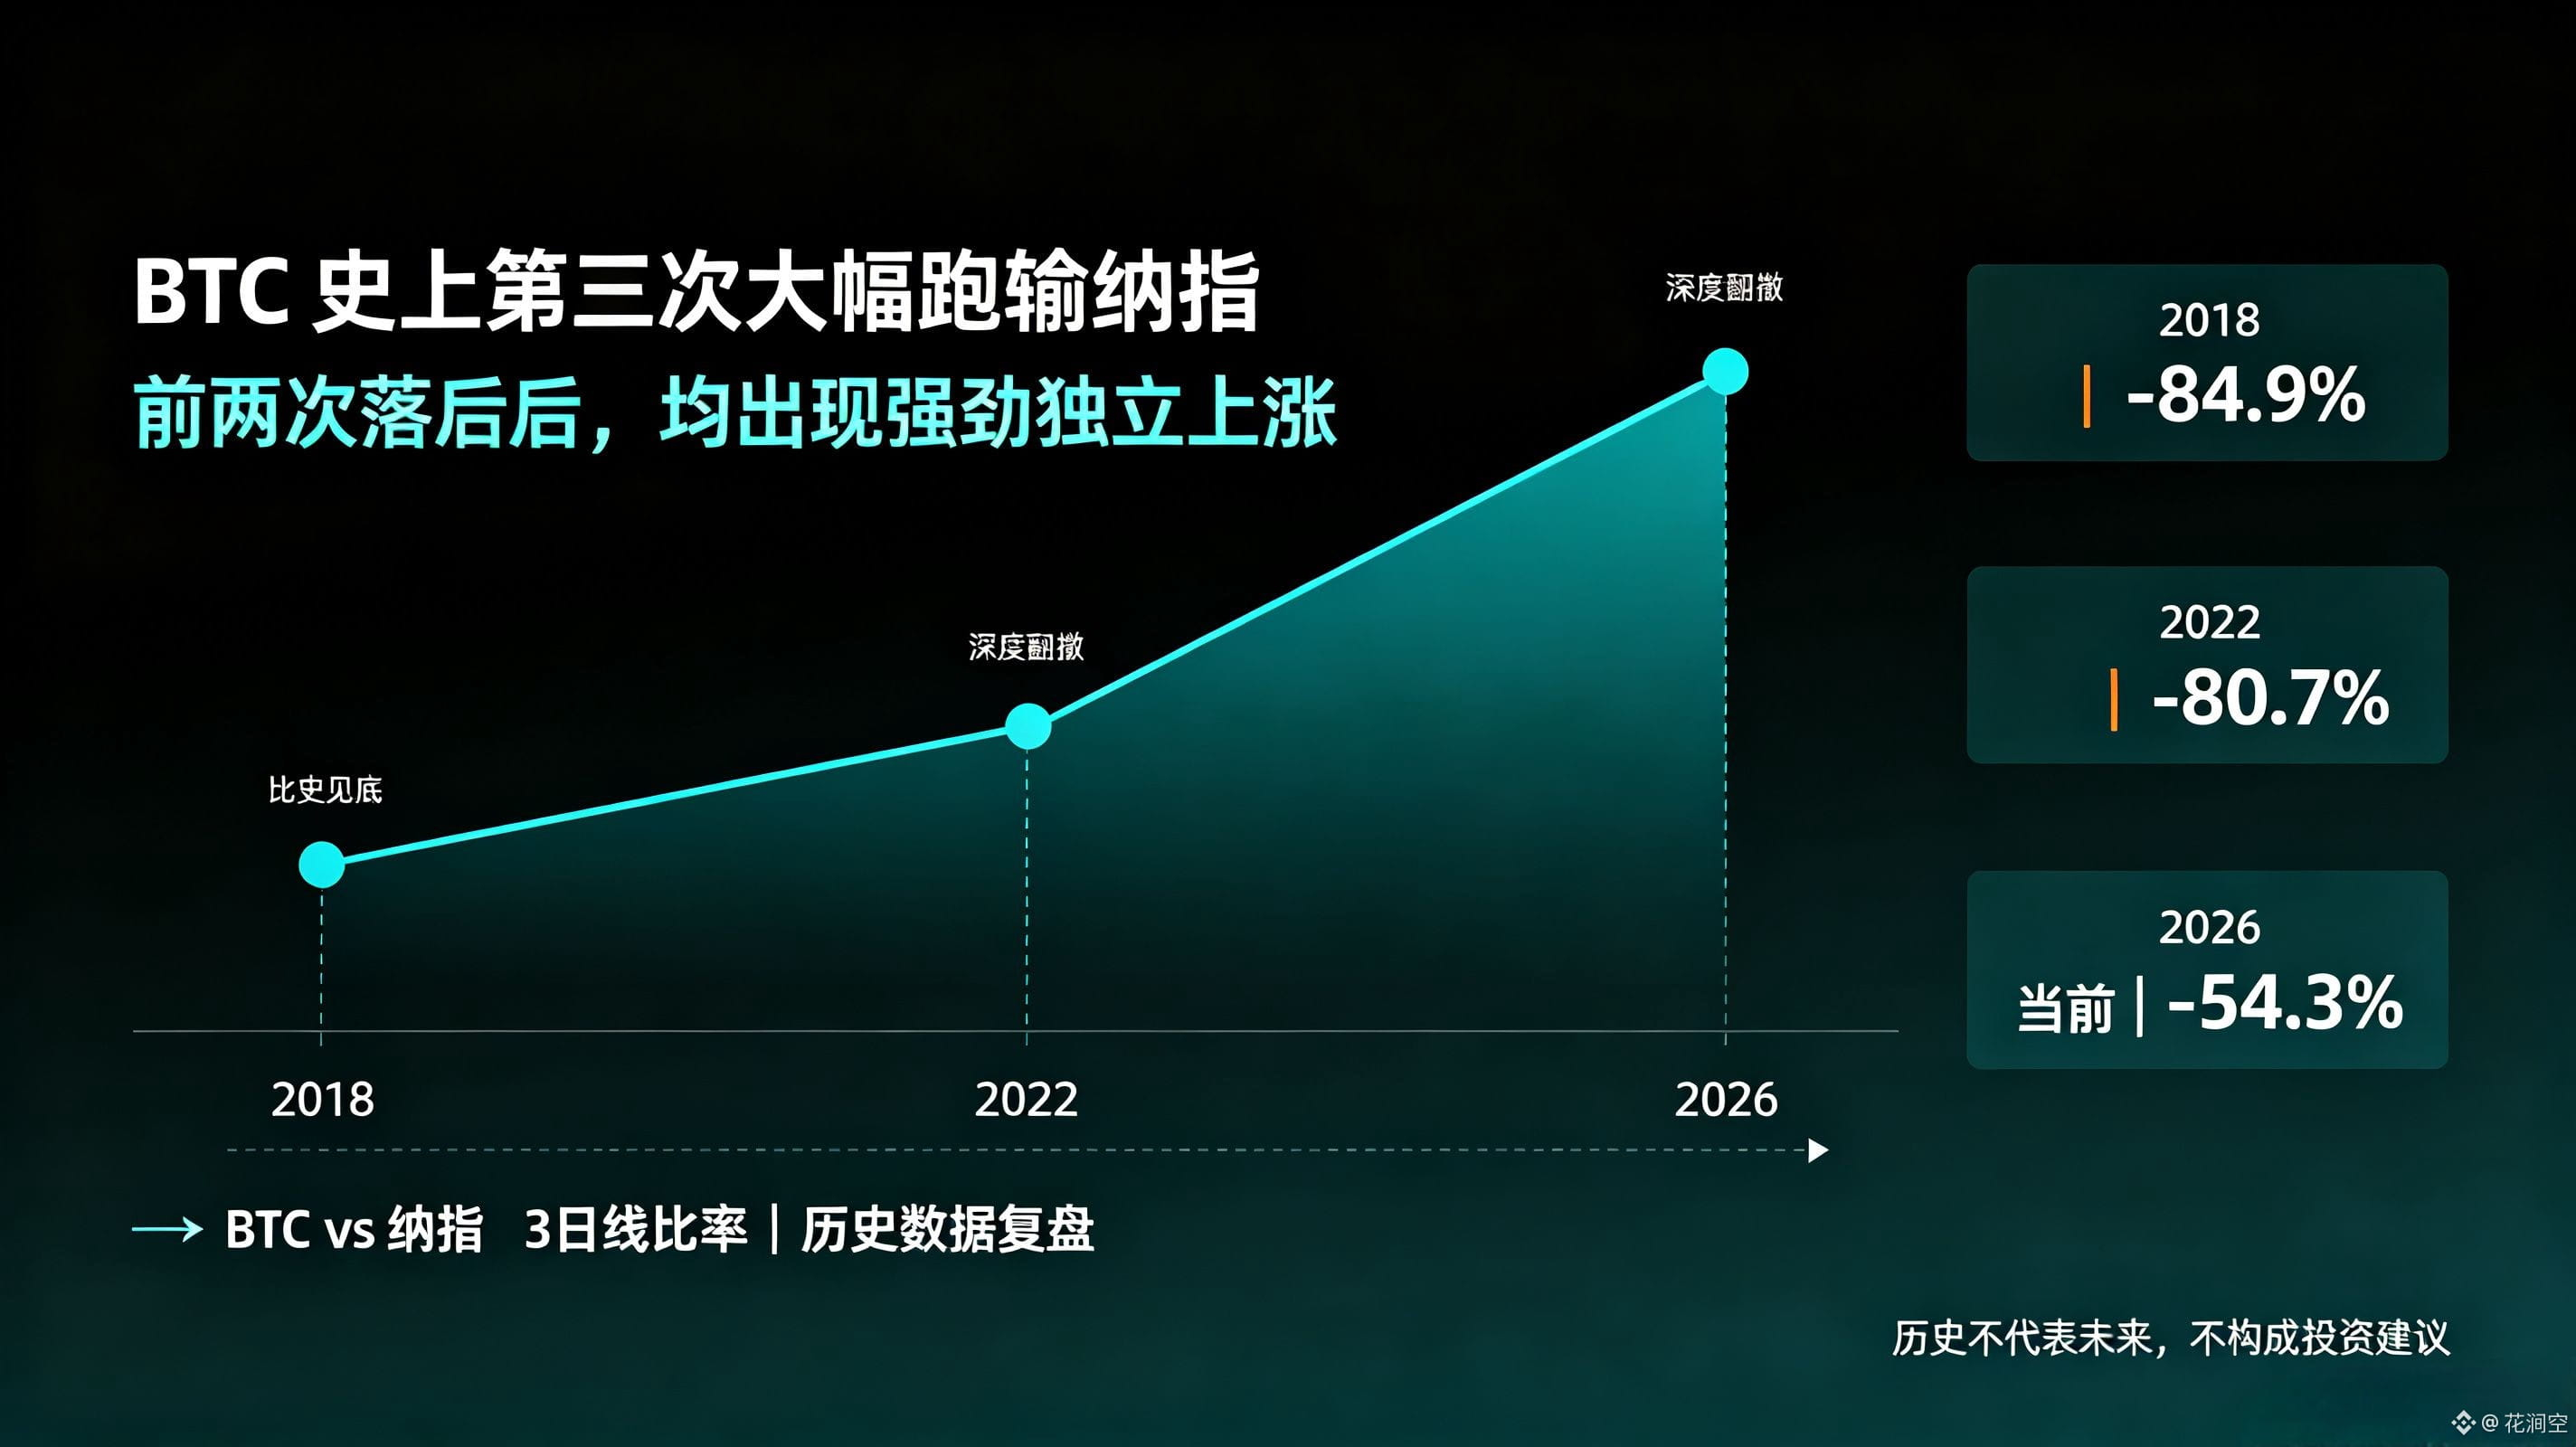
📢 Opinion|$BTC Again Significantly Underperforms the Nasdaq—Will History Recreate an Independent Major Bull Run for the Third Time?
On August 30, analyst Rekt Fencer shared a BTC/Nasdaq 3-day ratio chart. Data shows that this ratio has experienced three deep drawdowns: ‑84.9% in 2018, ‑80.7% in 2022, and ‑54.3% in 2026 during this latest drawdown.
Looking back at history, after the first two instances in which Bitcoin fell behind the Nasdaq by such a large margin, BTC went on to deliver an independent strong uptrend that broke away from tech stocks, followed by a wave of intense upside momentum.
Now, as the ratio falls again into historically extreme ranges, many market observers believe that a bottoming area is drawing near. If historical patterns repeat, Bitcoin could shake off U.S. stocks and restart its own行情.
#比特币现货ETF结束9日净流入
#首笔抗量子比特币交易主网完成
⚠️For historical data review only; history does not indicate the future and does not constitute investment advice.
On August 30, analyst Rekt Fencer shared a BTC/Nasdaq 3-day ratio chart. Data shows that this ratio has experienced three deep drawdowns: ‑84.9% in 2018, ‑80.7% in 2022, and ‑54.3% in 2026 during this latest drawdown.
Looking back at history, after the first two instances in which Bitcoin fell behind the Nasdaq by such a large margin, BTC went on to deliver an independent strong uptrend that broke away from tech stocks, followed by a wave of intense upside momentum.
Now, as the ratio falls again into historically extreme ranges, many market observers believe that a bottoming area is drawing near. If historical patterns repeat, Bitcoin could shake off U.S. stocks and restart its own行情.
#比特币现货ETF结束9日净流入
#首笔抗量子比特币交易主网完成
⚠️For historical data review only; history does not indicate the future and does not constitute investment advice.
Partly True
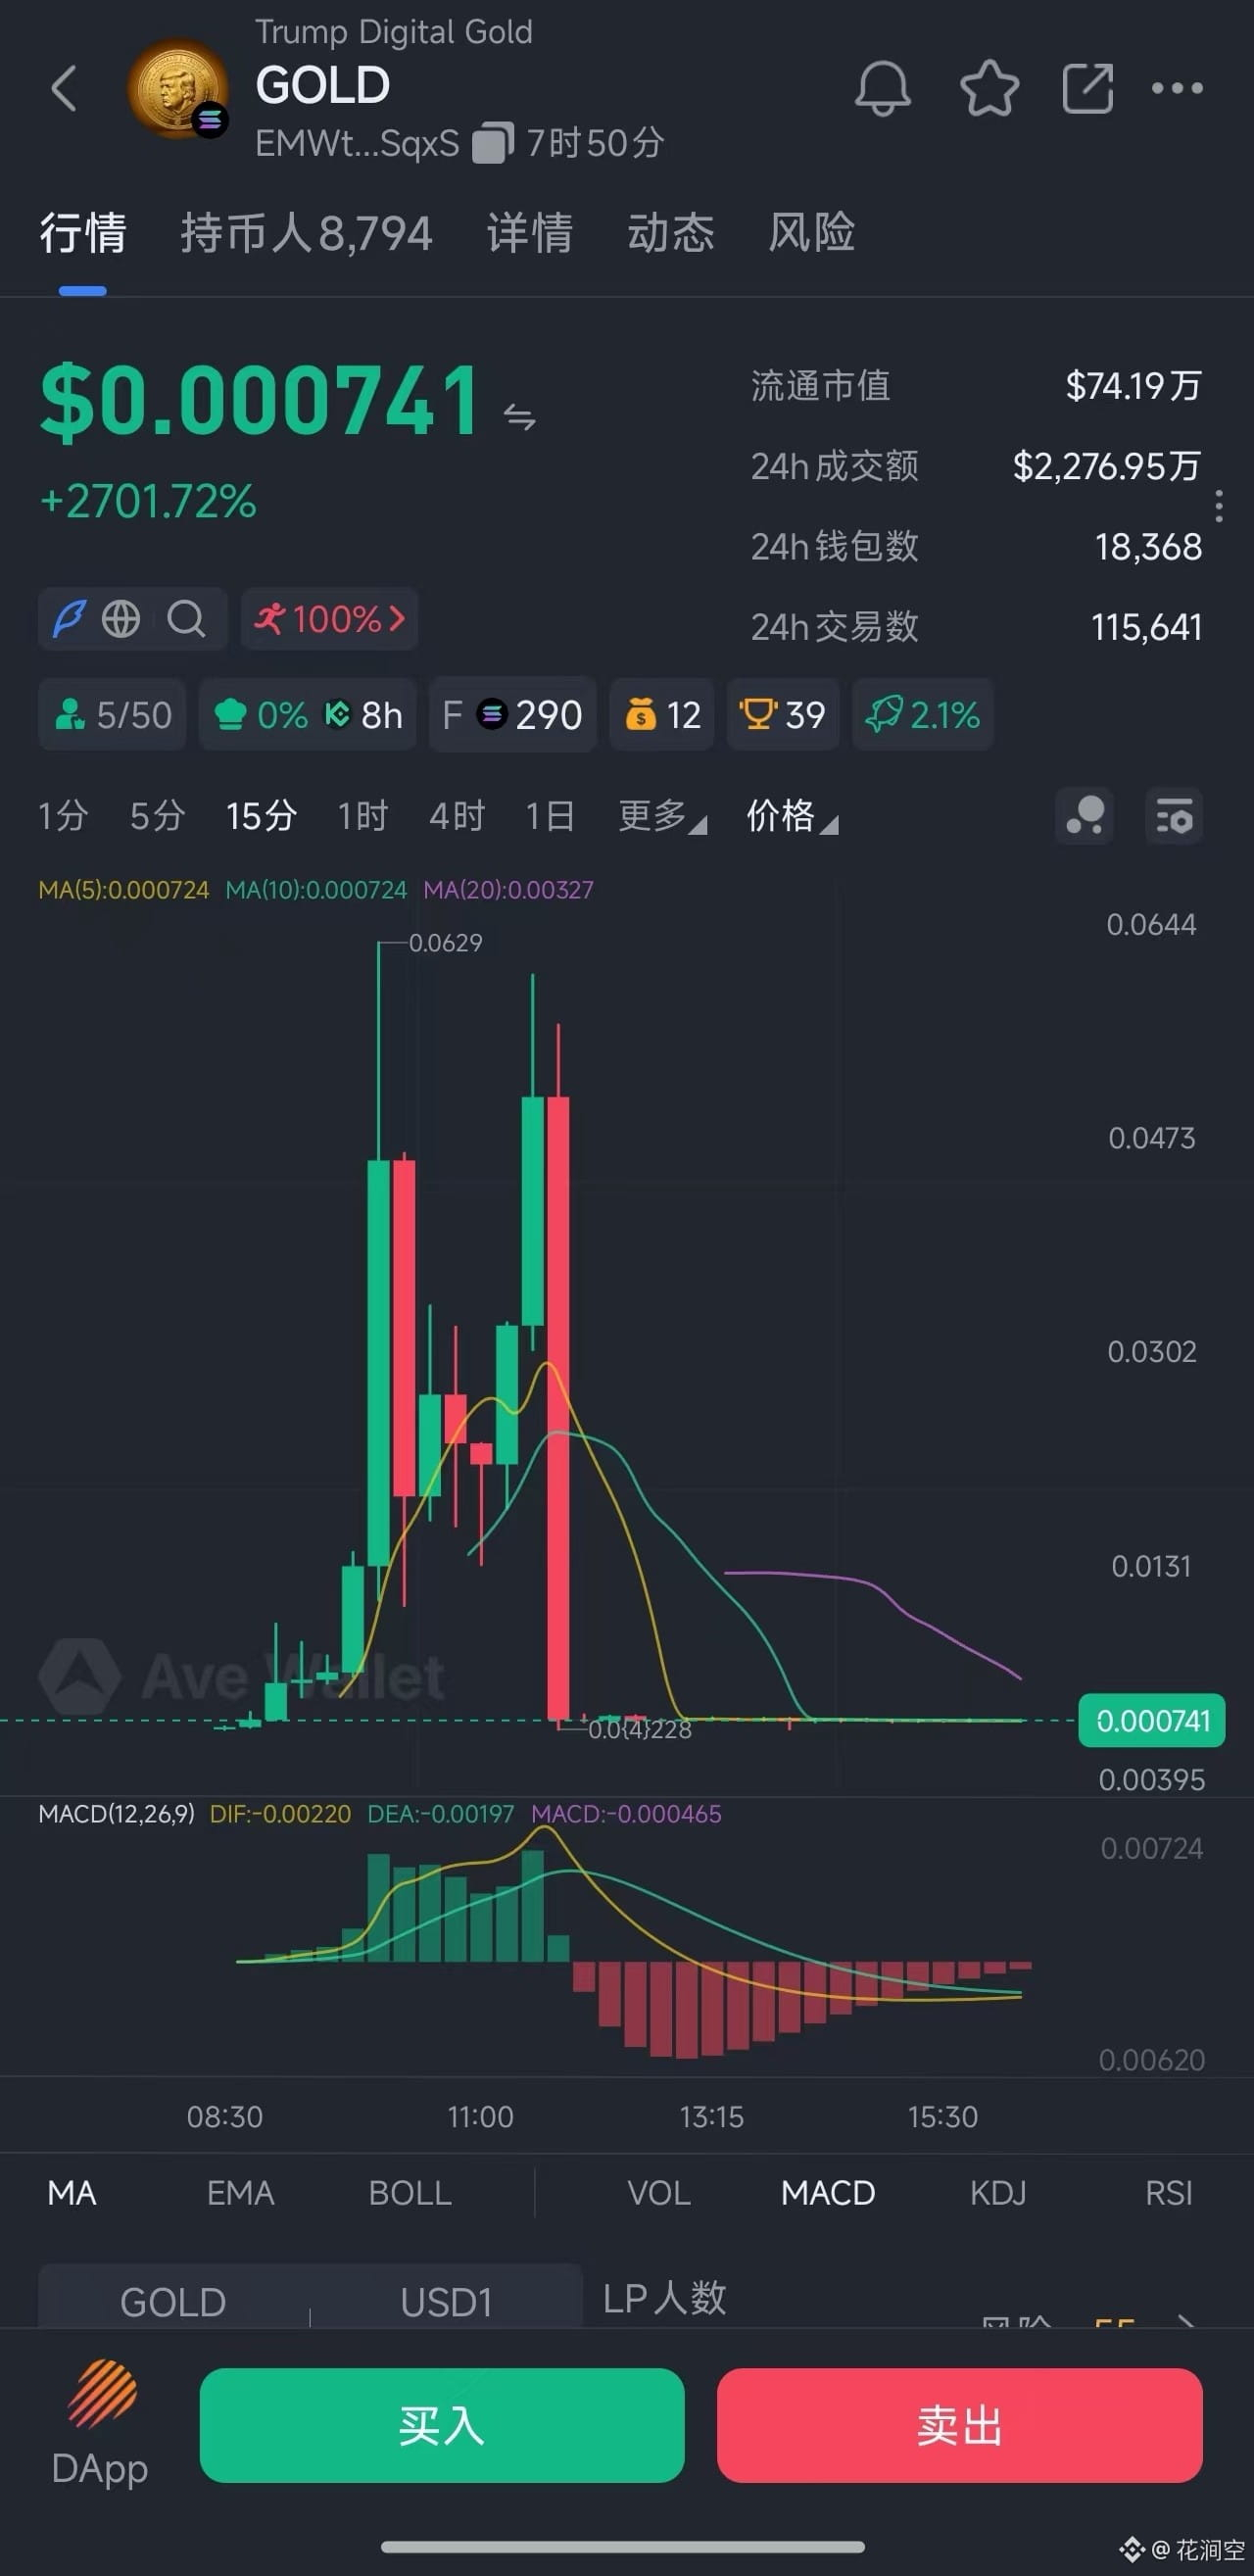
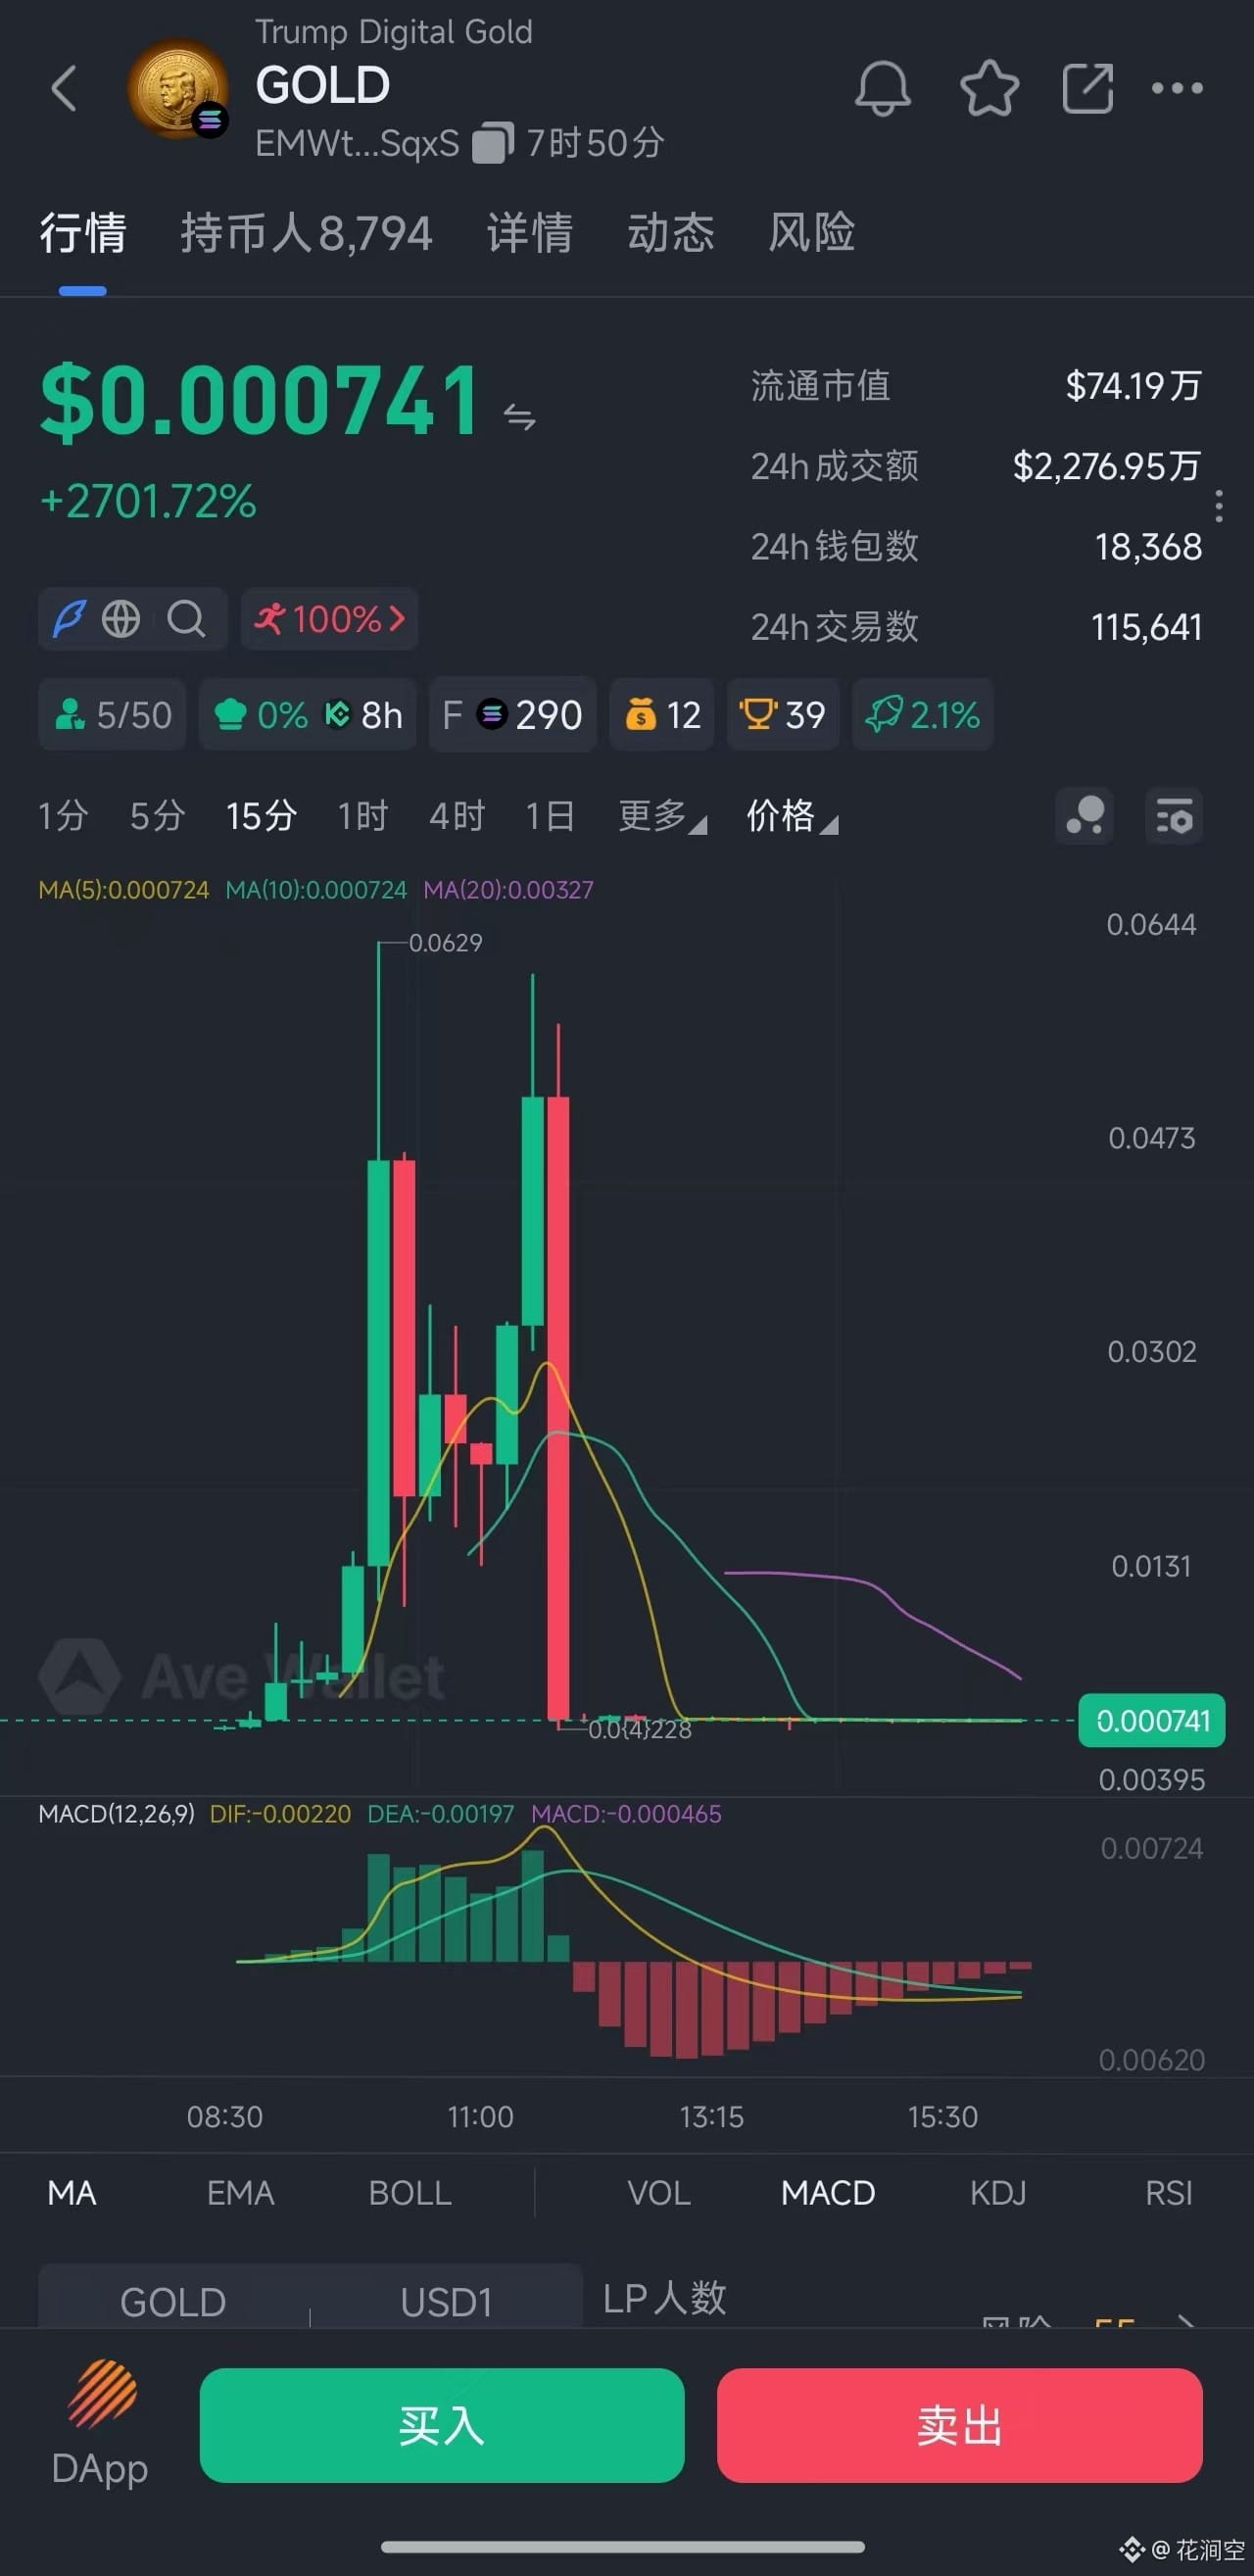
Trump Coin official denies launching any digital tokens, saying related reports are completely untrue, and attributes them to malicious third parties. After a tweet containing a contract address was deleted, the market value of the meme coin GOLD briefly reached $66 million. The team is working with relevant authorities to launch an investigation.
$TRUMP
$TRUMP
Verified
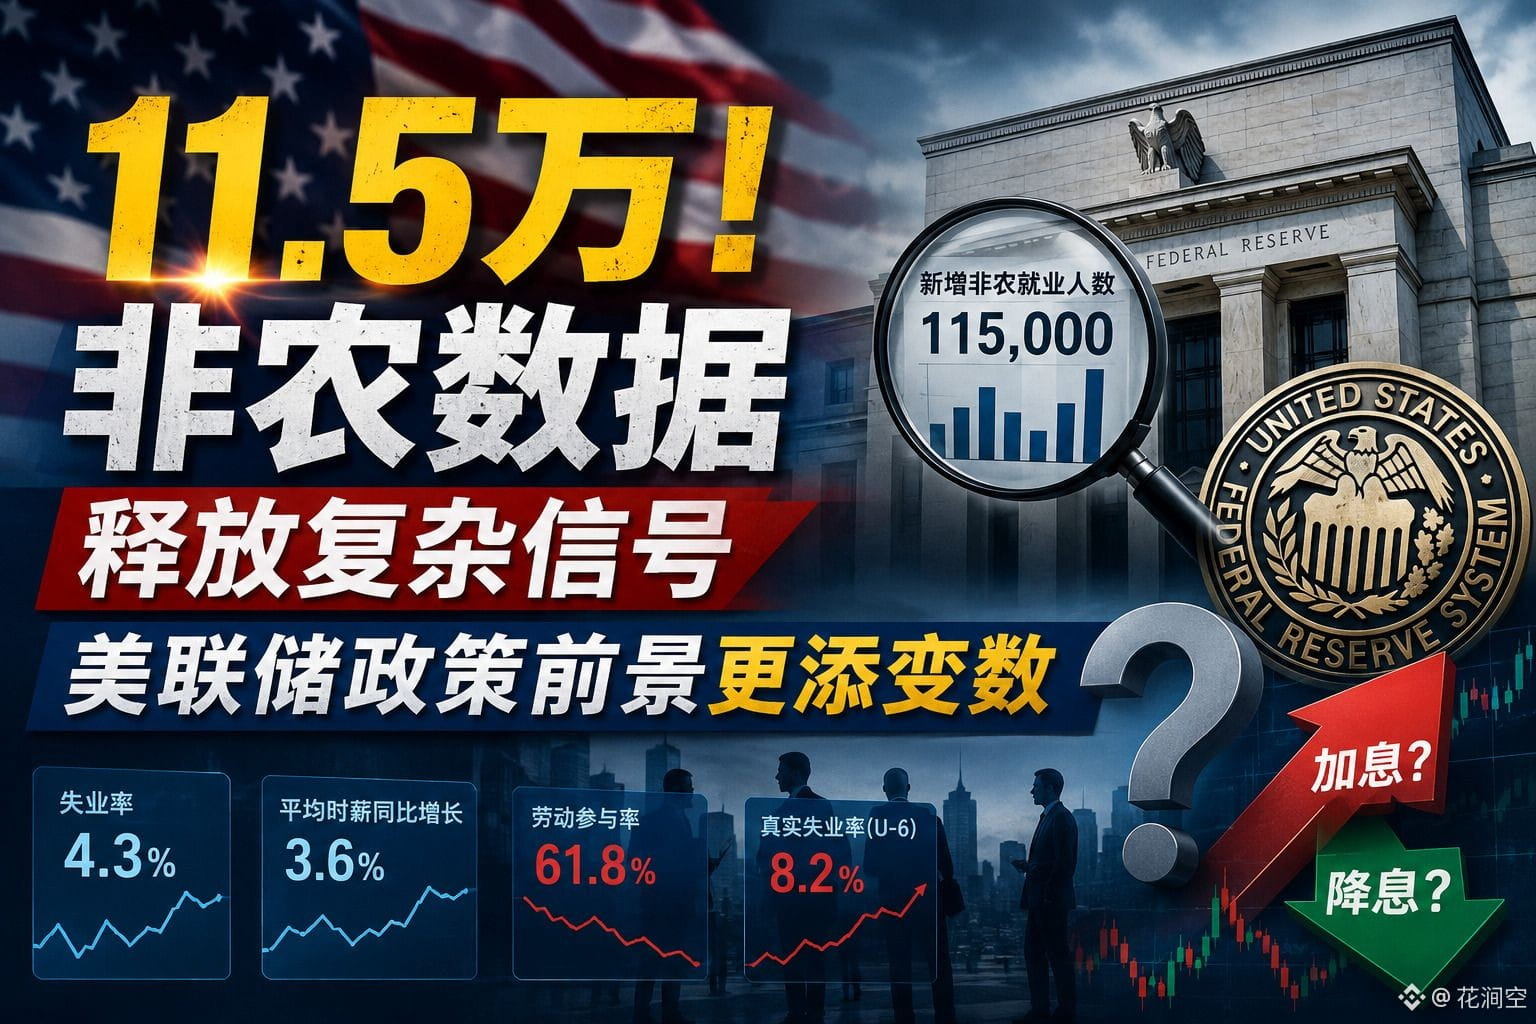
📢 Bloomberg Chief Economist: Next week’s Nonfarm Payrolls data may be weak, and the probability of Fed rate hikes may decline
Hua Jian Kong Quick News: On August 29, Bloomberg Chief Economist Anna Wong said in an analysis that the upcoming U.S. nonfarm payrolls report next week carries risks of weakening, and there is even a possibility of recording negative employment growth. This data will directly influence the Fed’s subsequent monetary policy stance.
She noted that, looking back at the policy history of the modern Federal Reserve, there has not been an example of initiating rate hikes in a backdrop of consecutive two periods of negative nonfarm employment growth. If employment continues to cool, market expectations for the Fed to tighten monetary policy would likely fall noticeably.
Employment is the key benchmark the Fed uses to weigh interest rates. Weak nonfarm data may dampen expectations for U.S. Treasuries and a stronger U.S. dollar, indirectly providing sentiment support for risk assets. However, it’s also important to remember that inflation data remains an important constraint; it does not necessarily mean a shift toward easing. The market still needs to wait for the data to be released and validated.#美联储9月加息概率升至57%
⚠️ Information sharing only and does not constitute investment advice.
Hua Jian Kong Quick News: On August 29, Bloomberg Chief Economist Anna Wong said in an analysis that the upcoming U.S. nonfarm payrolls report next week carries risks of weakening, and there is even a possibility of recording negative employment growth. This data will directly influence the Fed’s subsequent monetary policy stance.
She noted that, looking back at the policy history of the modern Federal Reserve, there has not been an example of initiating rate hikes in a backdrop of consecutive two periods of negative nonfarm employment growth. If employment continues to cool, market expectations for the Fed to tighten monetary policy would likely fall noticeably.
Employment is the key benchmark the Fed uses to weigh interest rates. Weak nonfarm data may dampen expectations for U.S. Treasuries and a stronger U.S. dollar, indirectly providing sentiment support for risk assets. However, it’s also important to remember that inflation data remains an important constraint; it does not necessarily mean a shift toward easing. The market still needs to wait for the data to be released and validated.#美联储9月加息概率升至57%
⚠️ Information sharing only and does not constitute investment advice.
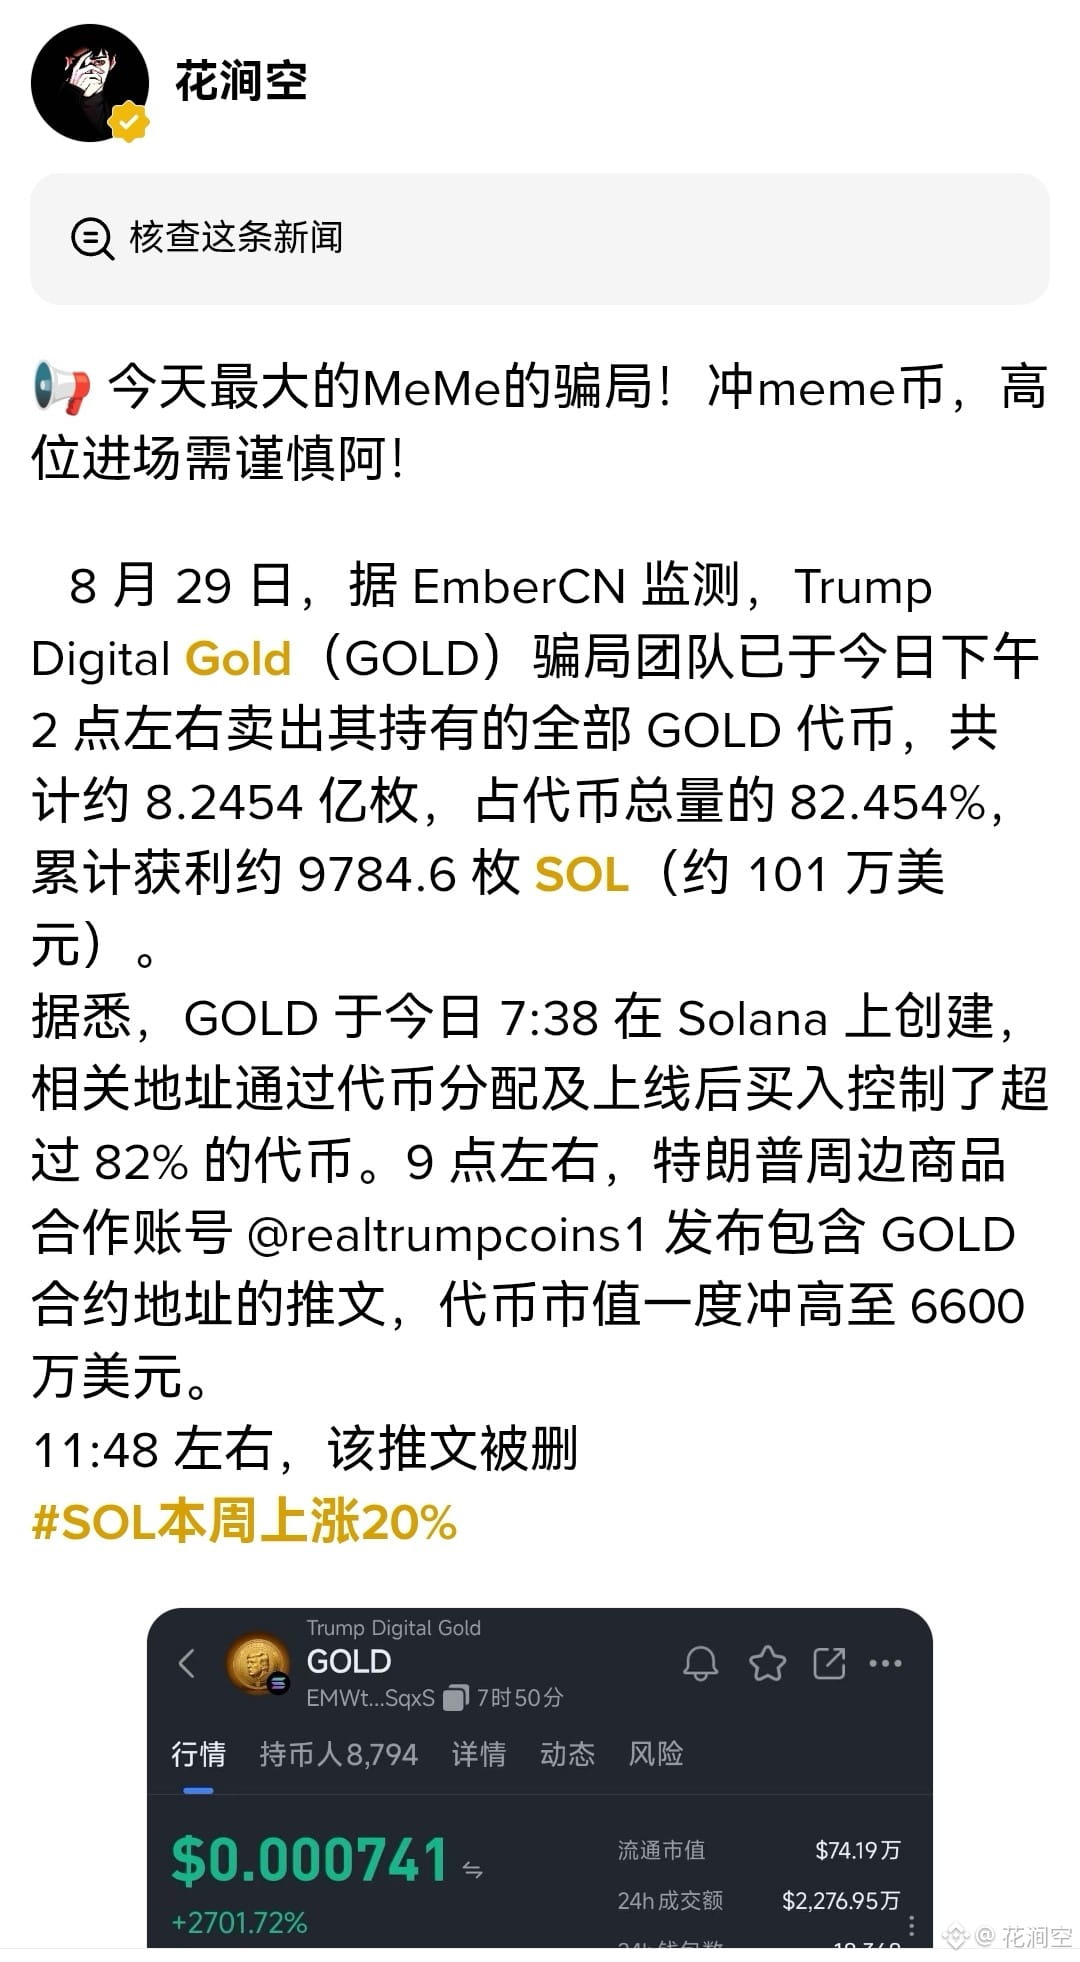
📢 The biggest MeMe scam today! Be careful when entering high—go for meme coins at your own risk!
On August 29, according to monitoring by EmberCN, the Trump Digital Gold (GOLD) scam team sold all of its held GOLD tokens at around 2:00 PM today, totaling approximately 824.54 million tokens, accounting for 82.454% of the total token supply. The team reportedly profited about 9,784.6 SOL (about $1.01 million) in total.
It is said that GOLD was created on Solana today at 7:38. Through token allocations and buying after the token launched, the related addresses controlled more than 82% of the tokens. Around 9:00, an account for merchandise partnerships around Trump, @realtrumpcoins1, posted a tweet containing the GOLD contract address, and the token market value briefly surged to $66 million.
Around 11:48, the tweet was deleted
#SOL本周上涨20%
On August 29, according to monitoring by EmberCN, the Trump Digital Gold (GOLD) scam team sold all of its held GOLD tokens at around 2:00 PM today, totaling approximately 824.54 million tokens, accounting for 82.454% of the total token supply. The team reportedly profited about 9,784.6 SOL (about $1.01 million) in total.
It is said that GOLD was created on Solana today at 7:38. Through token allocations and buying after the token launched, the related addresses controlled more than 82% of the tokens. Around 9:00, an account for merchandise partnerships around Trump, @realtrumpcoins1, posted a tweet containing the GOLD contract address, and the token market value briefly surged to $66 million.
Around 11:48, the tweet was deleted
#SOL本周上涨20%
Analyze the profile pictures of @CZ and #孙割 to see their personality traits!
CZ uses a simple vintage-style black-and-white photo as his profile picture, indicating that the owner’s emotions are reserved, with rationality outweighing sentiment. He stays calm about noise, has a strong sense of distance, pursues aesthetics, and prefers a high-end, minimalist vibe!
As for #孙割 , he uses his as the cover of Forbes as his profile picture! Such a person has a strong sense of goals, is realistic and pragmatic, believes in speaking with实力, and repeatedly emphasizes this coverage. He over-relies on external accolades to prove himself, fears that others will overlook his achievements, and internally needs to continuously receive external recognition!
CZ uses a simple vintage-style black-and-white photo as his profile picture, indicating that the owner’s emotions are reserved, with rationality outweighing sentiment. He stays calm about noise, has a strong sense of distance, pursues aesthetics, and prefers a high-end, minimalist vibe!
As for #孙割 , he uses his as the cover of Forbes as his profile picture! Such a person has a strong sense of goals, is realistic and pragmatic, believes in speaking with实力, and repeatedly emphasizes this coverage. He over-relies on external accolades to prove himself, fears that others will overlook his achievements, and internally needs to continuously receive external recognition!


Verified
6000-character long article summarized into nine pictures!
Big Brother Sun has such a huge news coming out,
why hasn’t $TRX caused much of a stir yet?
#波场主网激活TVM布拉格大阪兼容
Big Brother Sun has such a huge news coming out,
why hasn’t $TRX caused much of a stir yet?
#波场主网激活TVM布拉格大阪兼容

📢 U.S. California “meme coin bill” AB2409 passes both houses of the state legislature and awaits the governor’s signature
On August 28, California’s “meme coin” regulatory bill AB 2409 passed the California Assembly and Senate by vote. It has now been submitted to the Governor’s Office and is awaiting signature.
The bill would prohibit California public officials and government employees from issuing meme coins, and would prohibit digital asset service providers, effective January 1, 2027, from offering to California residents transaction services for meme coins issued or co-launched by federal officials or state and local public officials.
If signed by the governor, AB 2409 will become one of the first state-level regulations in the United States to limit activities related to the issuance of meme coins by political figures.
On August 28, California’s “meme coin” regulatory bill AB 2409 passed the California Assembly and Senate by vote. It has now been submitted to the Governor’s Office and is awaiting signature.
The bill would prohibit California public officials and government employees from issuing meme coins, and would prohibit digital asset service providers, effective January 1, 2027, from offering to California residents transaction services for meme coins issued or co-launched by federal officials or state and local public officials.
If signed by the governor, AB 2409 will become one of the first state-level regulations in the United States to limit activities related to the issuance of meme coins by political figures.

📢 Opinion: The US SEC is considering restarting public token financing, but ICO market demand has clearly weakened
Huajian Empty Express|Bloomberg news on Aug 28
A new SEC proposal would allow crypto projects to be exempt from full registration for publicly issuing tokens to U.S. investors: for startups, up to $5 million in funding over 4 years; for large projects, a 12-month cap of $75 million. The new rules establish a safe harbor, and once the project is completed, the tokens may be detached from their status as securities.
Compared with the brutal ICO era of 2017, this time there is mandatory disclosure attached, so compliance costs are high. Today, market funds are more inclined toward BTC, major coins, and derivatives, and the hype around newly issued tokens is far cooler than back then.
In the medium-to-long term, this is a positive narrative for the industry, but since it’s still only a proposal and not yet implemented, it’s unlikely that the ICO bull market of those years can be replicated in the short term. New projects still carry extremely high risk. #比特币升破8万美元创三月新高
⚠️ Information sharing only; not investment advice#
Huajian Empty Express|Bloomberg news on Aug 28
A new SEC proposal would allow crypto projects to be exempt from full registration for publicly issuing tokens to U.S. investors: for startups, up to $5 million in funding over 4 years; for large projects, a 12-month cap of $75 million. The new rules establish a safe harbor, and once the project is completed, the tokens may be detached from their status as securities.
Compared with the brutal ICO era of 2017, this time there is mandatory disclosure attached, so compliance costs are high. Today, market funds are more inclined toward BTC, major coins, and derivatives, and the hype around newly issued tokens is far cooler than back then.
In the medium-to-long term, this is a positive narrative for the industry, but since it’s still only a proposal and not yet implemented, it’s unlikely that the ICO bull market of those years can be replicated in the short term. New projects still carry extremely high risk. #比特币升破8万美元创三月新高
⚠️ Information sharing only; not investment advice#

Log in to explore more content