$VTHO
Key Observations:
1. Price Action:
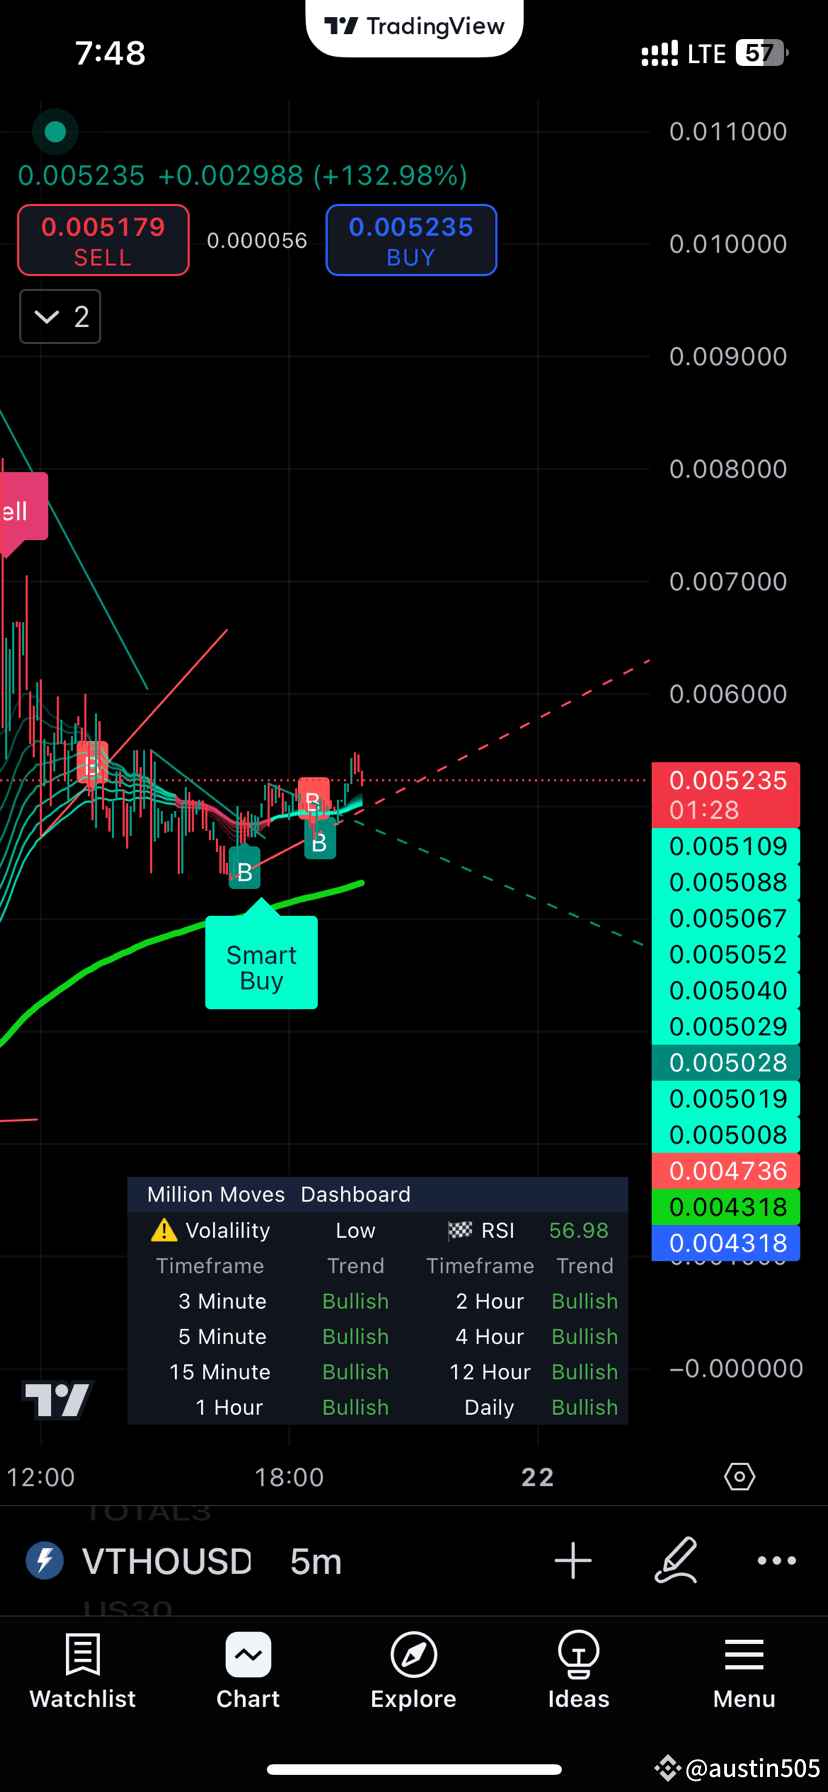
• The price experienced a massive spike, reaching a high of 0.012000, followed by a sharp retracement to 0.005340.
• The current price is consolidating near the 7-period MA (0.005251), indicating a potential stabilization after the drop.
2. Volume:
• A significant increase in trading volume occurred during the spike, but the volume is now tapering off, suggesting waning momentum.
3. Moving Averages (MA):
• The price is trading above the 25-period MA (0.003698) and the 99-period MA (0.002858), signaling a bullish sentiment in the mid-to-long term.
• Short-term moving averages like MA(7) are beginning to converge, hinting at a potential breakout direction soon.
4. RSI:
• RSI values are:
• 6-period RSI: 57.4
• 12-period RSI: 59.7
• 24-period RSI: 60.7
• These values are in a neutral-to-slightly bullish zone, suggesting no overbought or oversold conditions yet.
Trading Strategy:
Entry Point (Buying):
• Look for a buy entry if the price breaks above 0.006000 with increasing volume, as it would indicate renewed bullish momentum.
• Alternatively, if the price retests the 25-period MA (around 0.0037) or shows a bullish reversal pattern, this could be a good accumulation zone.
Exit Point (Selling):
• Partial profit-taking can be considered near 0.007000 or 0.008000, where previous resistance levels might apply.
• Exit the market entirely if the price approaches 0.012000 again, as this is a significant resistance zone from the spike.
Key Observations:
1. Price Action:
• The price experienced a massive spike, reaching a high of 0.012000, followed by a sharp retracement to 0.005340.
• The current price is consolidating near the 7-period MA (0.005251), indicating a potential stabilization after the drop.
2. Volume:
• A significant increase in trading volume occurred during the spike, but the volume is now tapering off, suggesting waning momentum.
3. Moving Averages (MA):
• The price is trading above the 25-period MA (0.003698) and the 99-period MA (0.002858), signaling a bullish sentiment in the mid-to-long term.
• Short-term moving averages like MA(7) are beginning to converge, hinting at a potential breakout direction soon.
4. RSI:
• RSI values are:
• 6-period RSI: 57.4
• 12-period RSI: 59.7
• 24-period RSI: 60.7
• These values are in a neutral-to-slightly bullish zone, suggesting no overbought or oversold conditions yet.
Trading Strategy:
Entry Point (Buying):
• Look for a buy entry if the price breaks above 0.006000 with increasing volume, as it would indicate renewed bullish momentum.
• Alternatively, if the price retests the 25-period MA (around 0.0037) or shows a bullish reversal pattern, this could be a good accumulation zone.
Exit Point (Selling):
• Partial profit-taking can be considered near 0.007000 or 0.008000, where previous resistance levels might apply.
• Exit the market entirely if the price approaches 0.012000 again, as this is a significant resistance zone from the spike.