


Bitcoin price is attempting to break out of $34,500 again. If there is a close below the 100 hourly simple moving average, BTC could start a major downside correction.
Bitcoin is still struggling to break above the $35,000 resistance level.
The price is trading above $34,200 and the 100 hourly simple moving average.
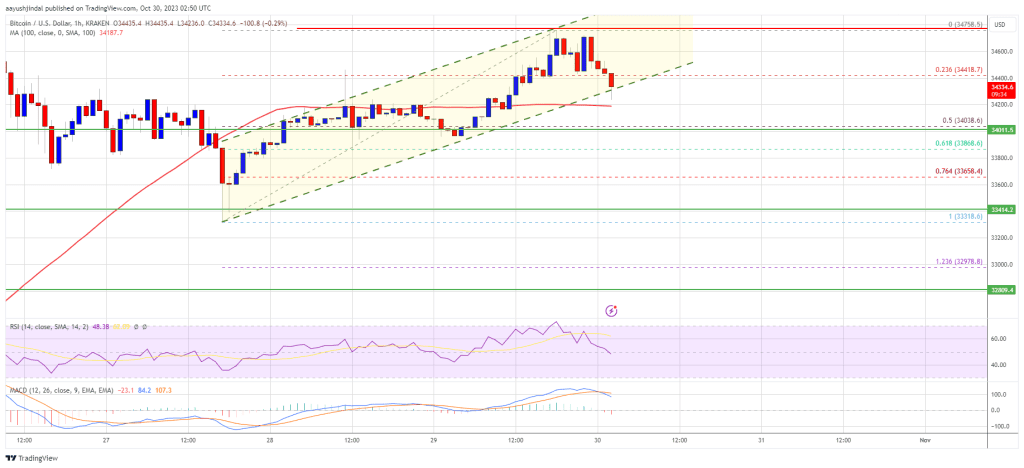
There is a key ascending channel forming with support near $34,300 on the hourly chart of the BTC/USD pair.
The pair could decline sharply if there is a close below $34,000 and then below $33,400.
Bitcoin price holds key support
Bitcoin price has again risen above the $34,200 resistance level. BTC climbed towards the $35,000 resistance area, but it lacked momentum.

The price traded as high as $34,758 and struggled to move higher. Currently, it has corrected higher below $34,500. There was a break below the 23.6% Fib retracement level of the upward move from the $33,318 swing low to $34,758 high.
Bitcoin is currently trading above $34,200 and the 100 hourly simple moving average. There is also a key ascending channel forming with support near $34,300 on the hourly chart of the BTC/USD pair.
On the upside, an immediate resistance is near the $34,500 level. The next key resistance could be near the $34,750 level or the upper trendline of the channel. The main resistance remains near the $35,000 area. A clear break above the $35,000 resistance could start another steady rise.
The next key resistance could be $35,500, above which the price could test $36,200. If Bitcoin rises further, a move to the $36,500 level is possible in the near term.
Downside Correction for Bitcoin?
If bitcoin fails to clear the $34,750 resistance, it could start another decline. An immediate support on the downside is near the $34,200 level and the 100 hourly simple moving average.
The next major support is near $34,000, which is the 50% Fib retracement level of the upward move from the $33,318 swing low to $34,758 high. If it falls below $34,000, there is a risk of further downside. In the mentioned case, the price could drop to $33,400 or even $32,500.
Technical indicators:
Hourly MACD – The MACD is now losing speed in the bullish zone.
Hourly RSI (Relative Strength Index) – The RSI for BTC/USD is currently below the 50 level.
Major Support Level – $34,200, followed by $34,000.
Major Resistance Levels – $34,500, $34,750 and $35,000.
PEPE: How the meme coin achieved +15% returns
If BTC does not fall below $34,000, PEPE could rebound at the critical level above $0.00000110.

PEPE fell back to a key level of support and liquidity on the chart.
Demand in the futures market fluctuated, but funding rates remained positive.
Pepe [PEPE] sellers re-entered the market after the Meme coin hit a critical barrier of $0.00000130 on Thursday, October 26. The sellers’ move netted them a 17% gain on their short position after pushing PEPE to $0.00000112.
A previous PEPE price prediction report by AMBCrypto posits that continued bullish momentum could flip the $0.00000140 support level.
However, sellers overwhelmed the bulls at the barrier and earned +17% short gains during the pullback.
Will the bulls defend this support?
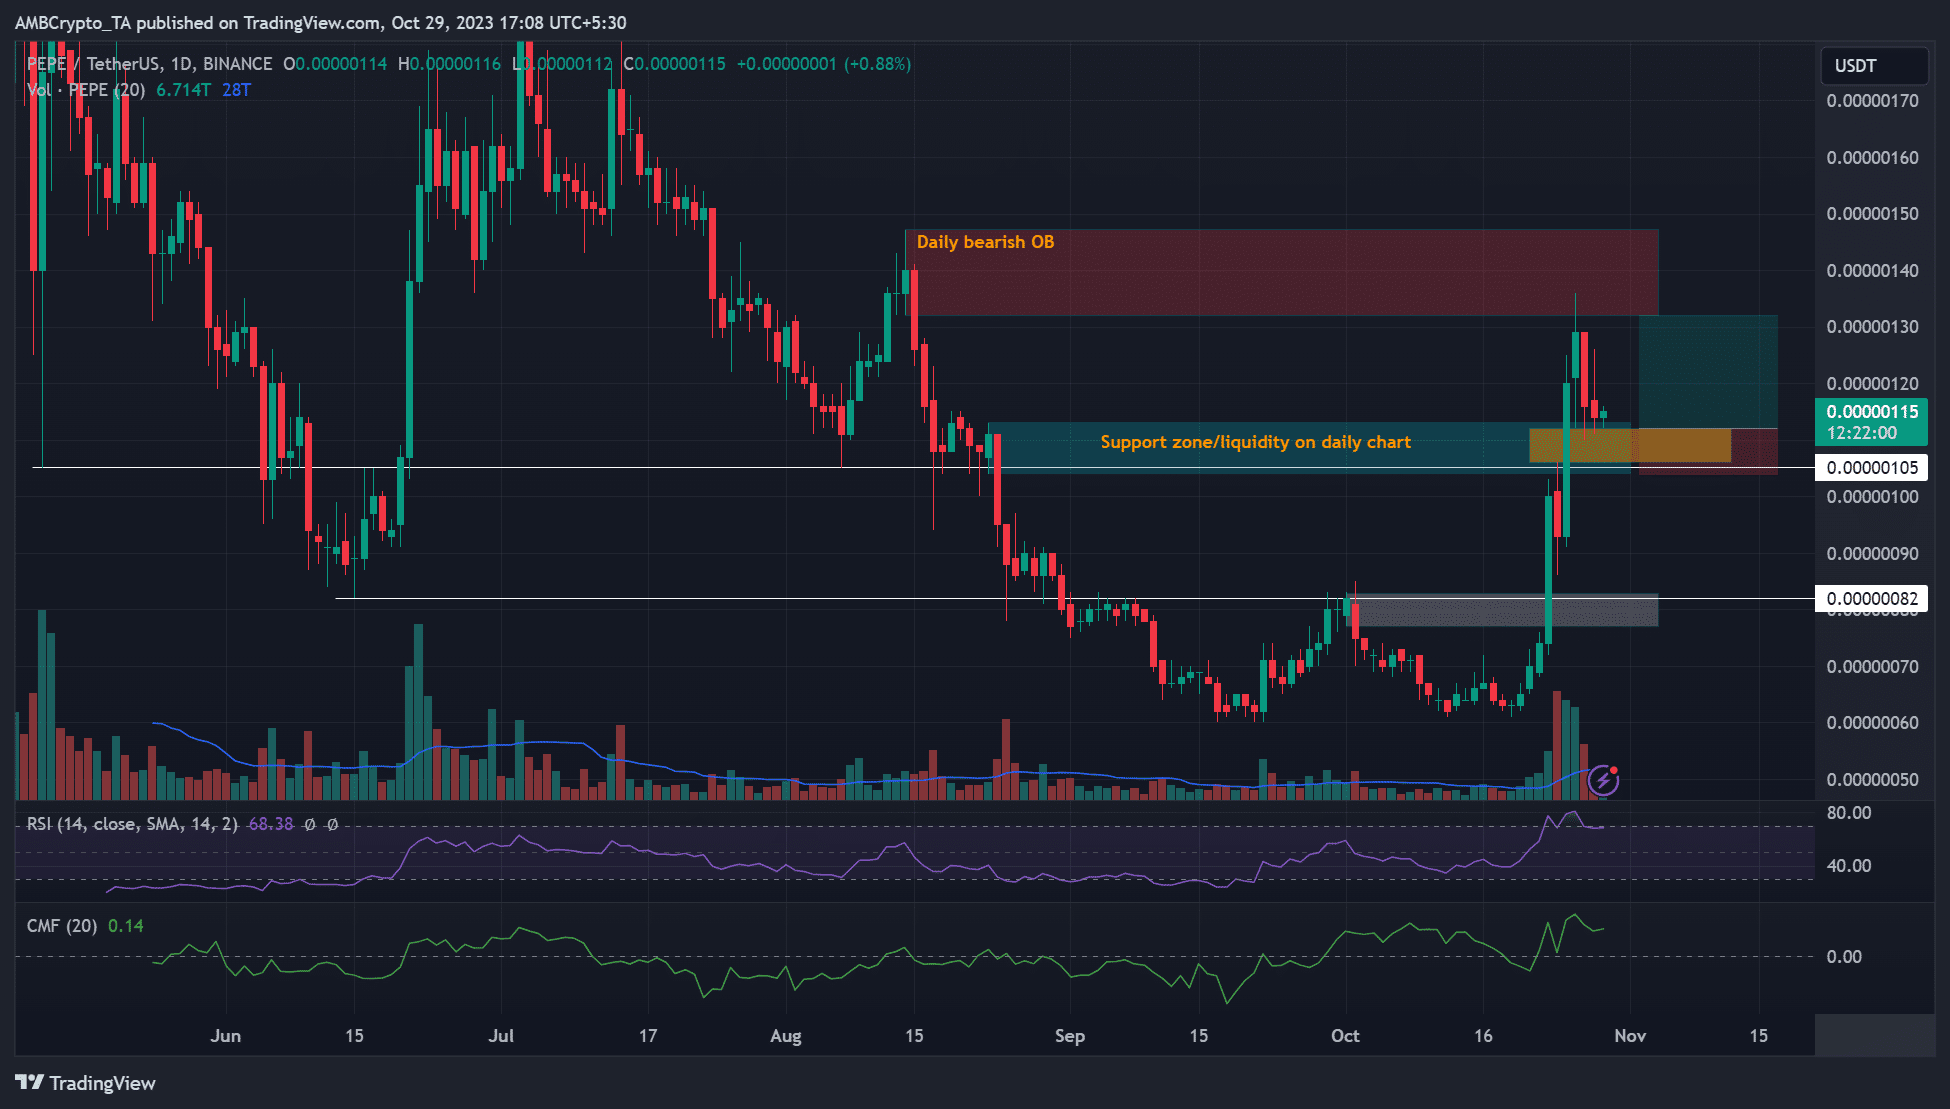
PEPE retested the previous resistance and bearish order block (OB) at $0.00000105 (cyan). This level is aligned with the liquidity on the chart at $0.00000106 – $0.00000112 (orange). Therefore, this arrangement can act as a solid bullish zone and foreshadow an upside reversal.
Buying at liquidity could result in +15% gains if the reversal retests the overhead barrier at $0.00000130 (red).
But the bullish bias would be invalidated if an extremely pessimistic scenario drags PEPE below the current support zone of $0.00000104 to $0.00000114 (cyan). Such a move could drop the price to $0.00000085.
Meanwhile, Meme Coin remains under significant buying pressure, as shown by the RSI being in overbought territory. Moreover, capital inflows over the past few days have also been impressive, as evidenced by the positive performance of the CMF.
Funding rates are positive, but demand fluctuates
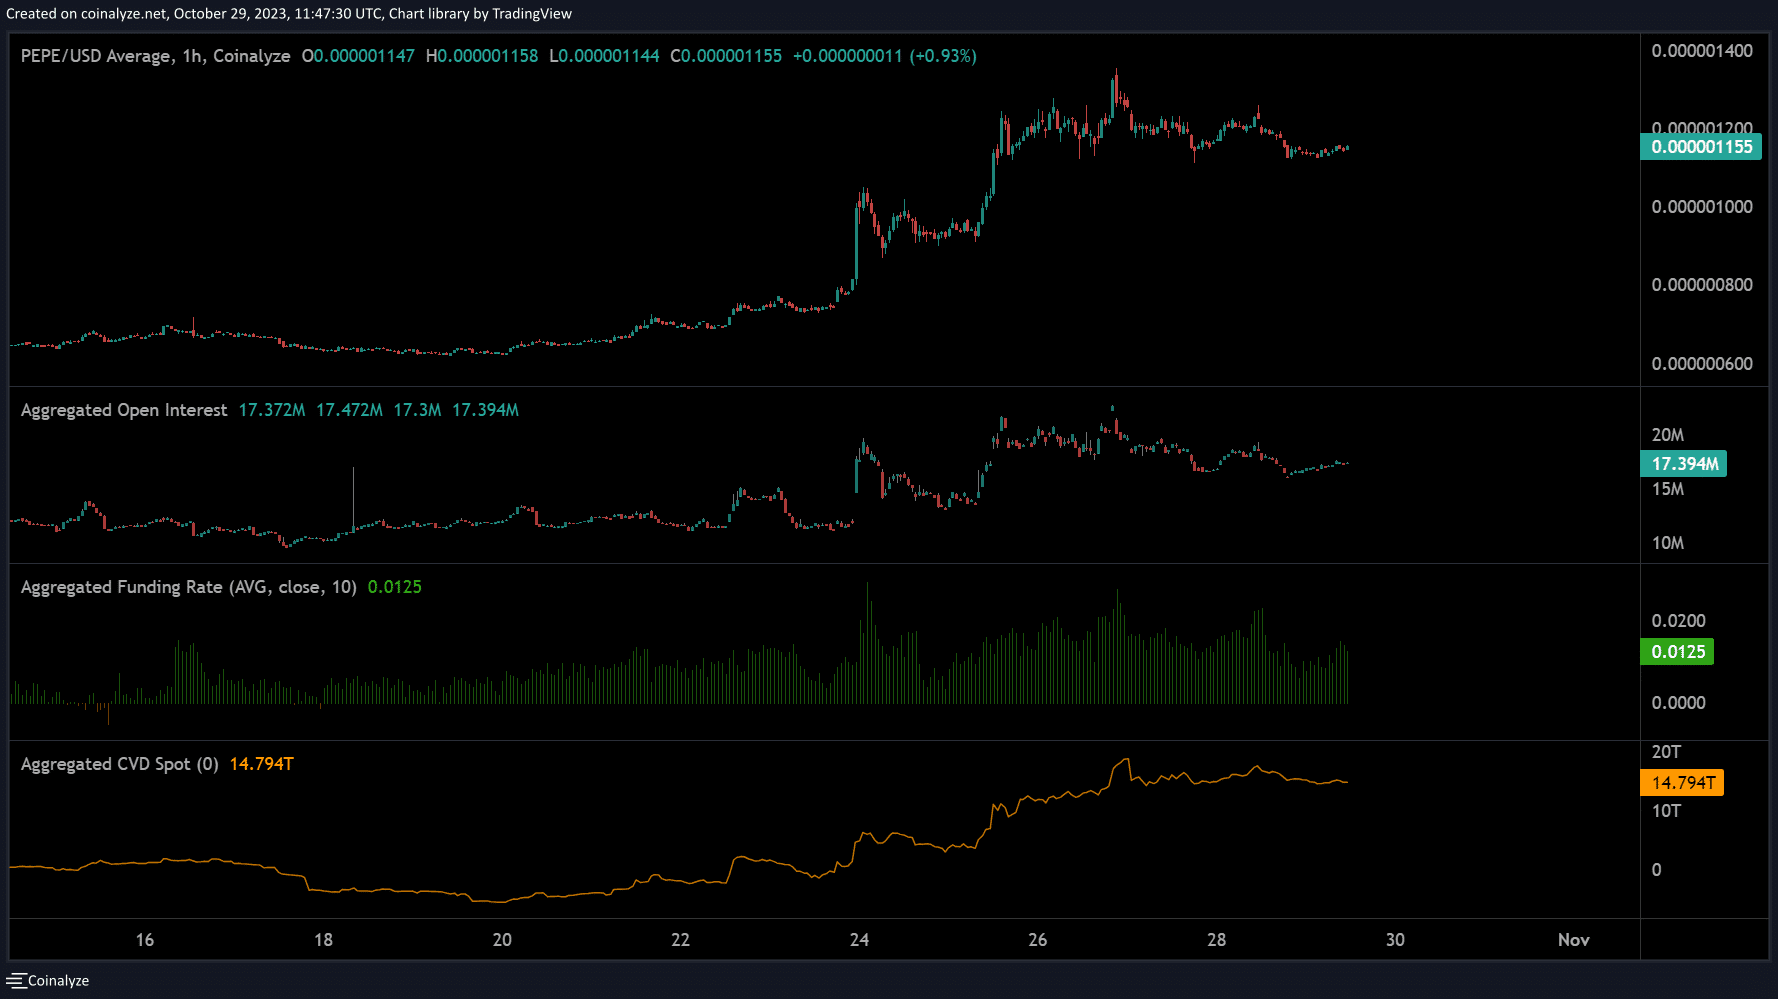
In the futures market, demand for meme coins has slowed slightly, as indicated by a decline in the open interest (OI) rate.
But funding rates remain positive, highlighting the bullish sentiment among most players in the derivatives space. The positive slope of CVD (cumulative volume delta) further confirms the leverage of buyers.
Therefore, PEPE could bounce above $0.00000110 if support and liquidity align on the chart. This idea could accelerate if BTC does not see more losses or fall below $34,000.
Today’s article ends here. If you like it, please follow me.
The homepage can get other channels and learn more about the sharing of practical articles