

The boring market has made the cryptocurrency circle quiet again, with less emotions and bubbles and more anxiety and suspicion.
Hoarding Bitcoin is the only suggestion for the current market situation. The reason is not only the cyclical law of trying to find a sword by carving a mark on the boat, but more because of its own "religious" belief.
This thread deeply interprets the historical trends of the cryptocurrency market. If you are anxious and lack confidence, it is recommended to read it repeatedly.
1/12
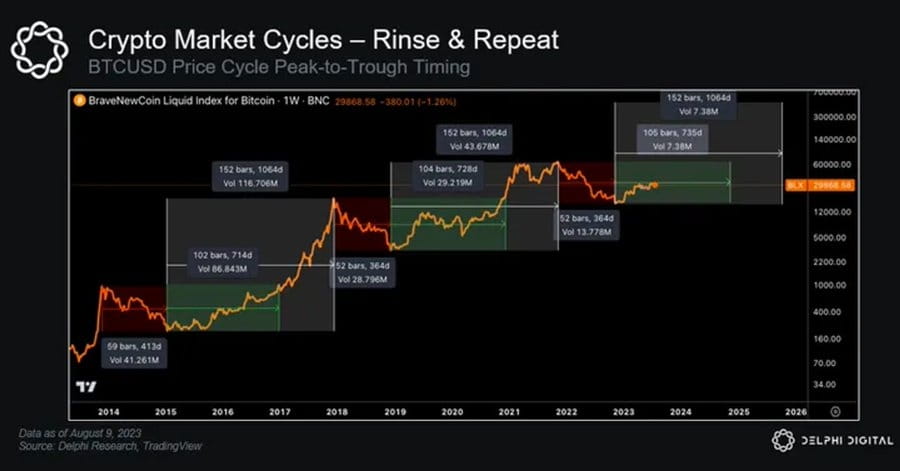
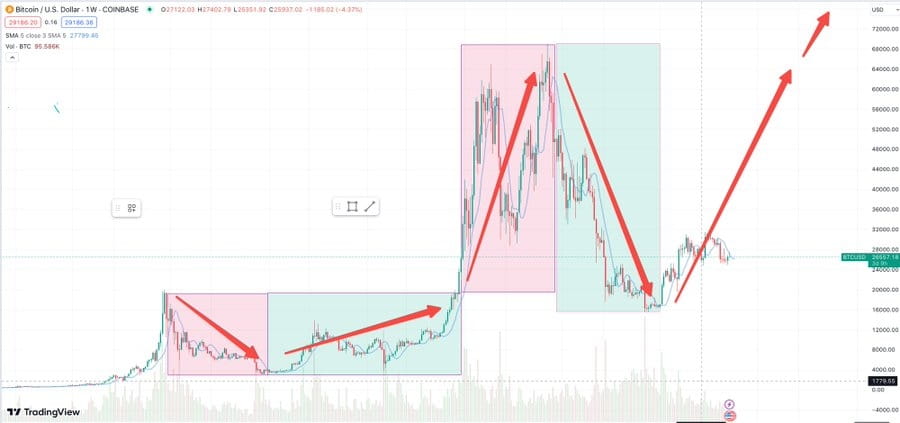
A typical BTC cycle trend: BTC reaches a new high → one year later, it falls 80% from the highest point → after two years, it recovers to the previous high → one year later, it creates a new high. This is not a subjective assumption. If you look at the figure below, you will find that since 2014, the trend of BTC has been almost the same as above.
2/12
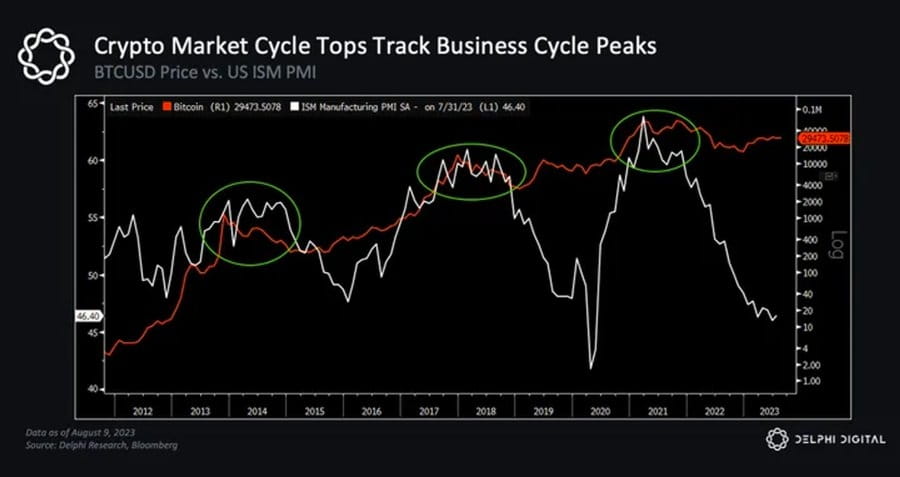
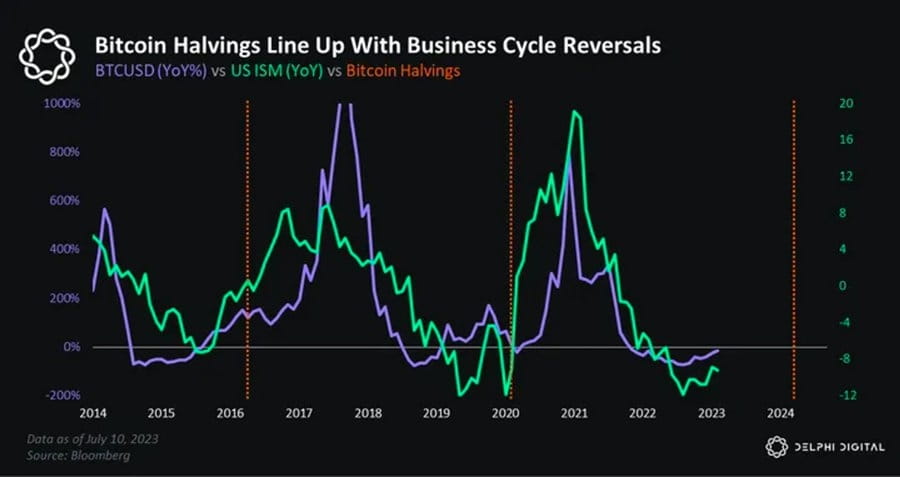
Each cycle usually lasts about 4 years, however, this is not random. As can be seen in the figure below, the highest point of BTC price in each cycle almost coincides with the highest point of ISM index, as do active addresses, transaction volume, and gas fees. This means that as the business cycle shows signs of recovery, people's enthusiasm for cryptocurrencies will also rise.
3/12
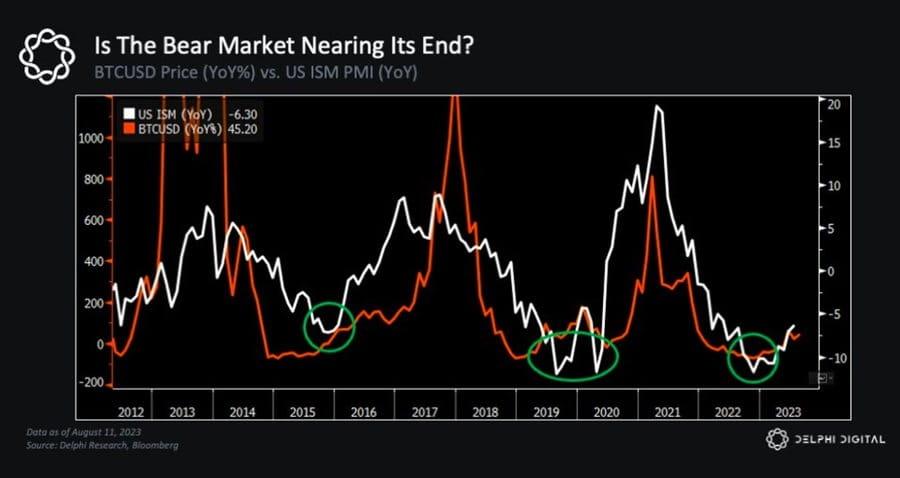
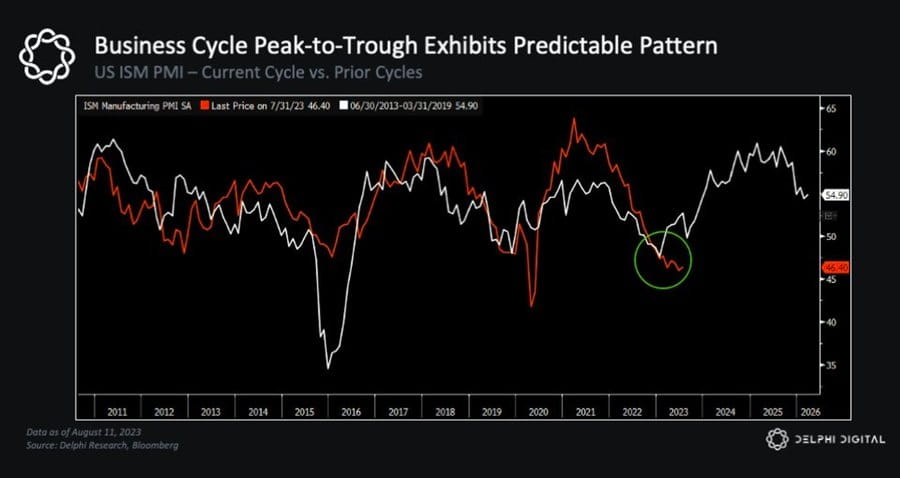
In fact, the reversal inflection point of BTC's year-on-year change usually appears at the bottom of the ISM index's year-on-year change, and so far, this is exactly what we have seen this time. In addition, just looking at the trend of ISM alone, it can be found that it will start a new cycle every 3.5 years.
4/12
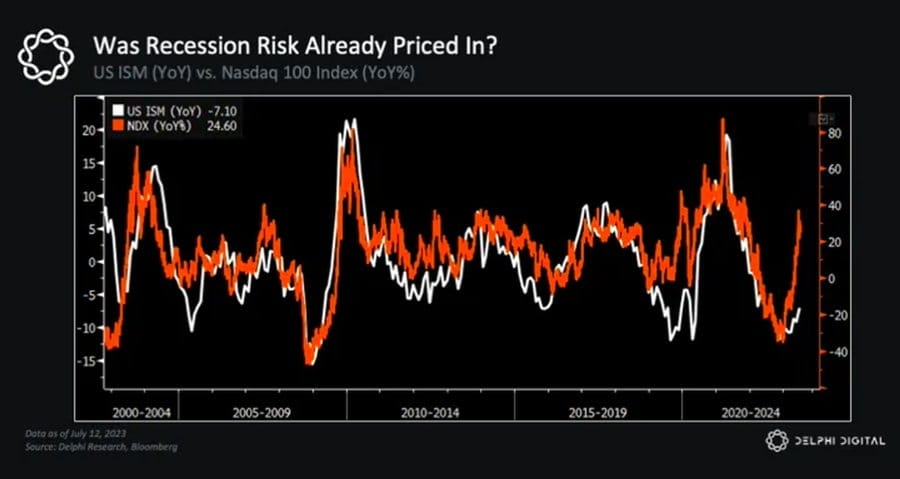
Higher interest rates, stagflation, and fears of a recession have all contributed to apathy for risk assets this year. But the market is forward-looking, and people's concerns about the future have been reflected in the performance of the stock market. The chart below shows the overlap between the Nasdaq 100 Index and the ISM.
5/12
Through historical backtesting, we can find that the turning point of the business cycle is a good opportunity to increase risk exposure, and now the ISM index seems to have reached the final stage of a two-year downward trend. In addition, I think we should most compare the market environment from 2015 to 2017 with the current one for the following reasons:
6/12
First, let’s look at how the market is trading, the SPX Index is highly similar to its 2015-17 price action, especially when the double bottom occurred…
7/12
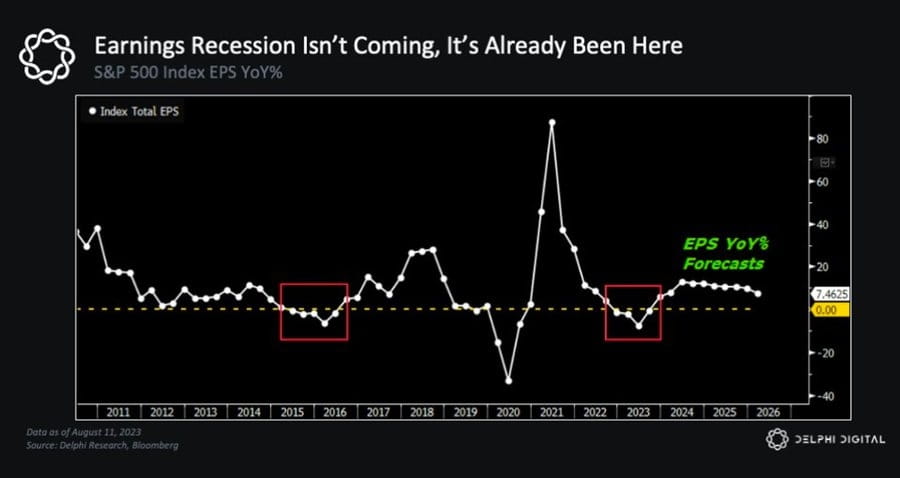
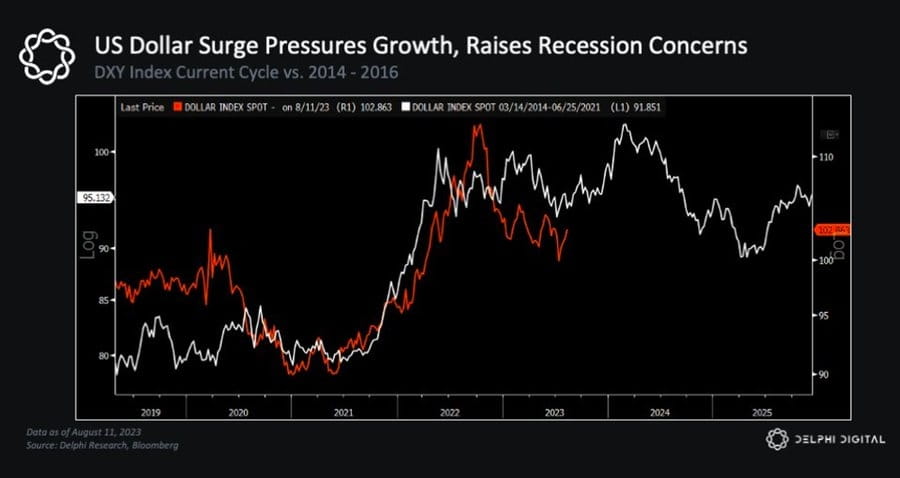
I remember the doomsday pessimism in 2015-16, the continued deterioration of risk sentiment, the gradual decline in earnings expectations, and the massive sell-off... It is almost exactly the same market environment as now. In addition, we have been in an earnings recession for several quarters (similar to 2015-16). At that time, the global growth outlook also became bleak, partly because the US dollar was experiencing its strongest rise in 15 years.
8/12
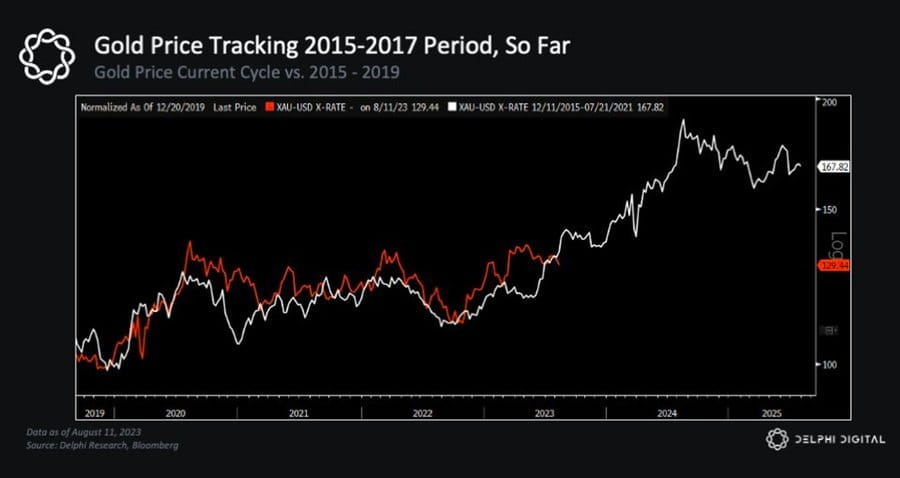
What’s also interesting is that the trend of gold in the past two years is very similar to that in 2015-2016. Gold = an asset to hedge against currency depreciation. Gold is severely affected by factors such as changes in the global liquidity cycle and the weakness of the US dollar.
9/12
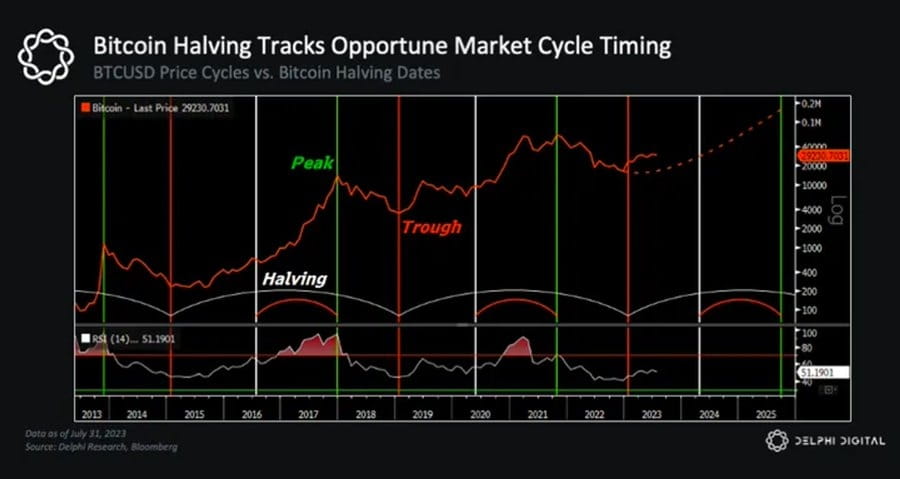
So what does all this have to do with cryptocurrencies? Obviously, the cryptocurrency market cycle is clearly related to the macroeconomic cycle. There is another important factor, which is the Bitcoin halving narrative. The next Bitcoin halving is expected to occur in April 2024.
10/12
The previous two halvings occurred:
-About 18 months after BTC bottomed
-About 7 months before BTC breaks new high
If BTC follows the above cycle, this means a new ATH will occur by Q4 2024 (and a new cycle peak will occur by Q4 2025).
11/12
Just like previous cycles, the timing of Bitcoin’s next halving couldn’t be better, as it coincides with the time when economic indicators such as the ISM show signs of bottoming out, after which an upward trend is about to begin…
12/12
Finally, from the K-line, the price trend of Bitcoin strictly follows the following three characteristics:
1) Fall 80% from the previous peak and reach the lowest point one year later (Q4 2022)
2) Recover within two years and reach the previous peak (Q4 2024)
3) Prices continue to rise for another year and reach new highs (Q4 2025)
#公链生态 #一起来跟单 #注意资金安全 #DeFiChallenge #美联储是否加息?
【Disclaimer】The market is risky, so be cautious when investing. This article does not constitute investment advice, and users should consider whether any opinions, views or conclusions in this article are suitable for their specific circumstances. Investing based on this is at your own risk.