

#zecanalysis
zecanalysis
39,428 views
208 Discussing
Hot
Latest

·
--
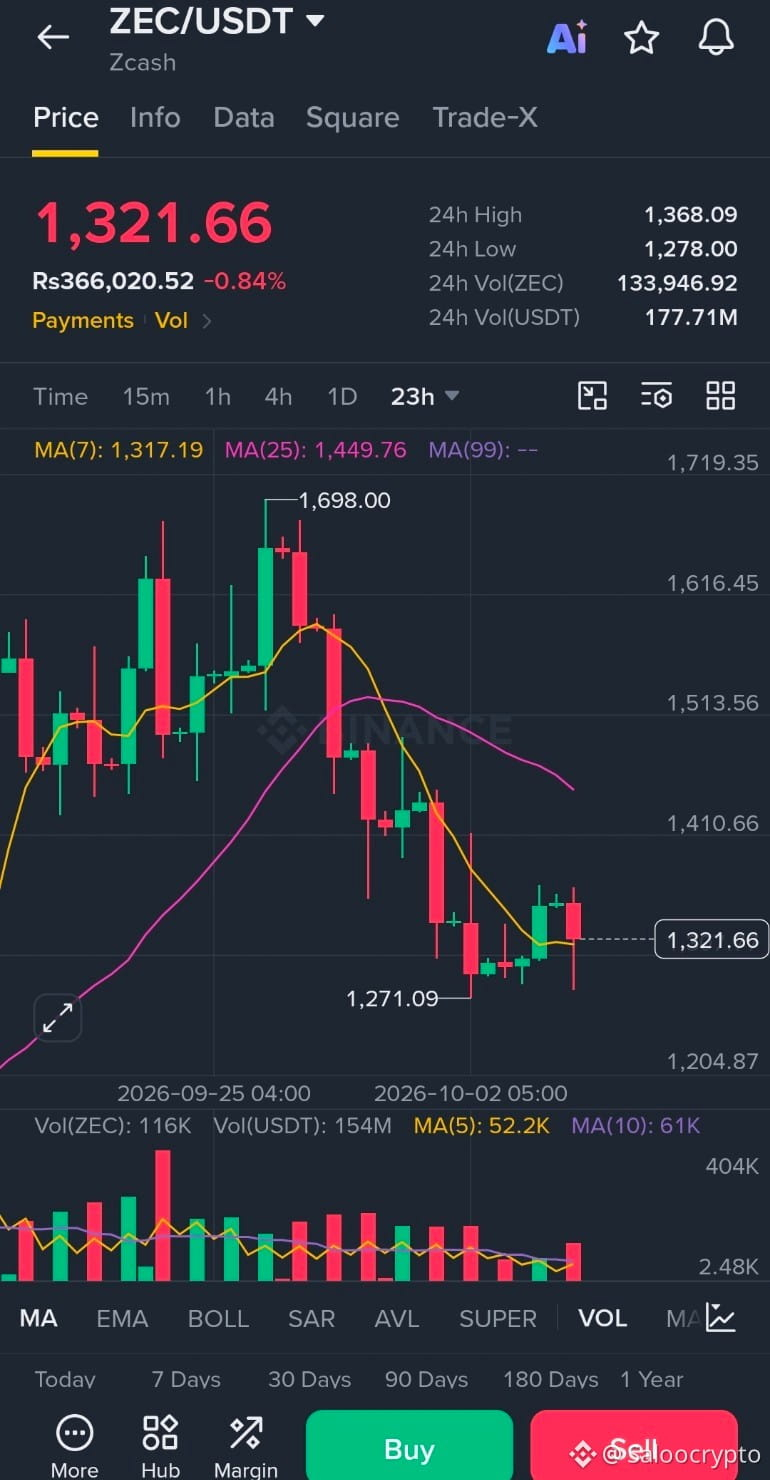
ZEC is down 23% from $1,698. So, something interesting is happening behind the scenes only the pro-traders know📉
ZEC has been down pretty bad lately and is currently trading around $1,300 after that big rally to $1,698.
There is more going on than meets the eye though. Grayscale's ZCSH had $93M in outflows last week, meaning that there are still plenty of sellers around. 💸 At the same time though, Zcash isn't slowing down. NU7 is now in public testing, THORChain just added a ZEC liquidity pool, and the ecosystem itself is still growing while the price is cooling off. 🚀
The chart is what interests me the most though. $1,270-$1,300 is showing some strength for the moment.
Should buyers push the price back above $1,341, I'd start watching $1,413. 📈
If $1,270 breaks, I wouldn't be surprised to see another flush. ⚠️ After that monstrous run, is this a rug pull or did ZEC just make its peak?
#ZEC.每日智能策略 #zecash #ZECAnalysis $ZEC
{spot}(ZECUSDT)
ZEC is down 23% from $1,698. So, something interesting is happening behind the scenes only the pro-traders know📉
ZEC has been down pretty bad lately and is currently trading around $1,300 after that big rally to $1,698.
There is more going on than meets the eye though. Grayscale's ZCSH had $93M in outflows last week, meaning that there are still plenty of sellers around. 💸 At the same time though, Zcash isn't slowing down. NU7 is now in public testing, THORChain just added a ZEC liquidity pool, and the ecosystem itself is still growing while the price is cooling off. 🚀
The chart is what interests me the most though. $1,270-$1,300 is showing some strength for the moment.
Should buyers push the price back above $1,341, I'd start watching $1,413. 📈
If $1,270 breaks, I wouldn't be surprised to see another flush. ⚠️ After that monstrous run, is this a rug pull or did ZEC just make its peak?
#ZEC.每日智能策略 #zecash #ZECAnalysis $ZEC
ZEC has been down pretty bad lately and is currently trading around $1,300 after that big rally to $1,698.
There is more going on than meets the eye though. Grayscale's ZCSH had $93M in outflows last week, meaning that there are still plenty of sellers around. 💸 At the same time though, Zcash isn't slowing down. NU7 is now in public testing, THORChain just added a ZEC liquidity pool, and the ecosystem itself is still growing while the price is cooling off. 🚀
The chart is what interests me the most though. $1,270-$1,300 is showing some strength for the moment.
Should buyers push the price back above $1,341, I'd start watching $1,413. 📈
If $1,270 breaks, I wouldn't be surprised to see another flush. ⚠️ After that monstrous run, is this a rug pull or did ZEC just make its peak?
#ZEC.每日智能策略 #zecash #ZECAnalysis $ZEC

1
273

{future}(ZECUSDT)
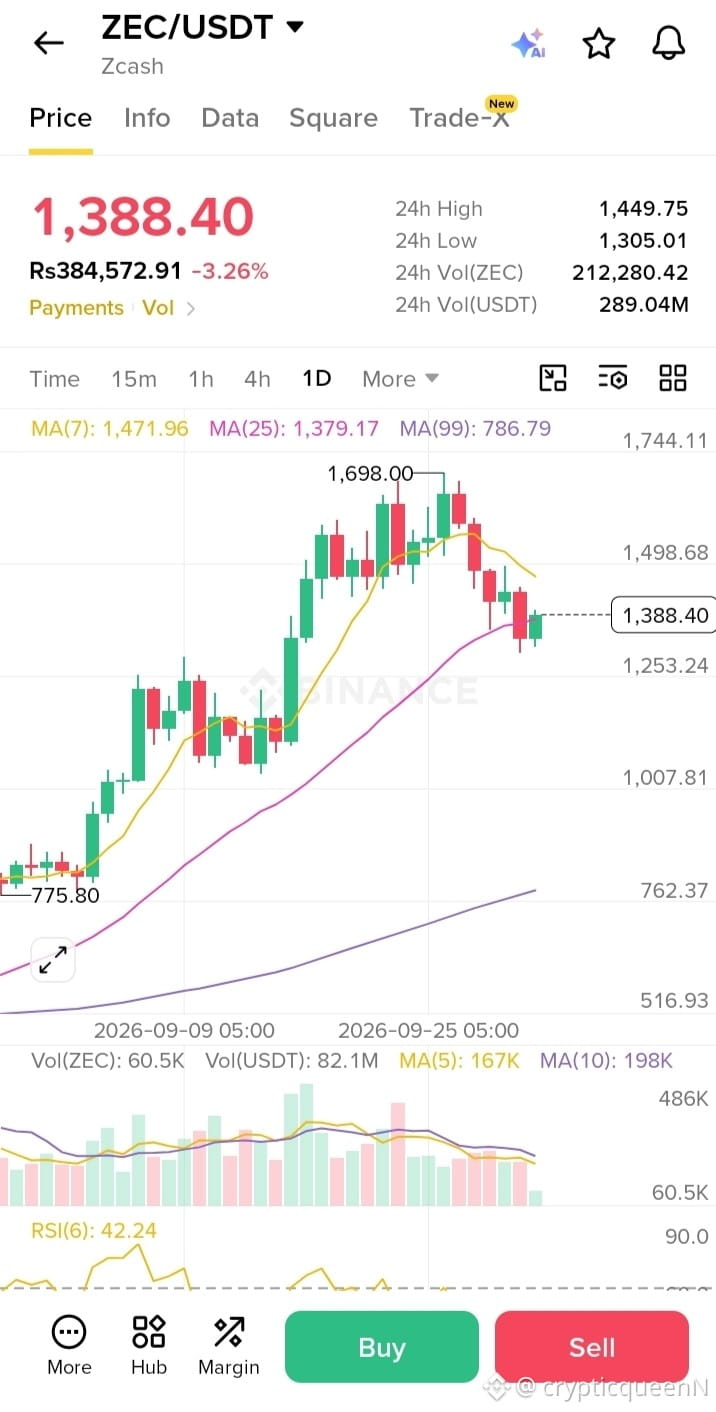
$ZEC is currently navigating a period of pullbacks following its recent rally towards the $1,698.00 peak. Here is a technical breakdown of the 1D chart action
#EtherGains70.9%InQ3
#zec
#ZECAnalysis
$ZEC is currently navigating a period of pullbacks following its recent rally towards the $1,698.00 peak. Here is a technical breakdown of the 1D chart action
#EtherGains70.9%InQ3
#zec
#ZECAnalysis
#EtherGains70.9%InQ3
#zec
#ZECAnalysis
245

Verified
30D trade $ZEC 24.9 USDT
🚨$ZEC just lost the momentum that drove its parabolic run and the sell off has a real catalyst.
After surging toward $1,700, Zcash is now fighting to hold the $1,400 area as institutional flows weaken and leverage unwinds.
The question is whether this is healthy profit-taking or the beginning of a deeper correction.
ZEC has fallen roughly 15% across three consecutive sessions, with the latest move taking price toward the $1,400 region. One of the clearest developments behind the weakness is a change in institutional flows. Grayscale’s Zcash-focused ZCSH ETF recorded more than $8 million in outflows on Monday, after previously attracting substantial capital during ZEC’s explosive September rally. That matters because the ETF had become an important source of institutional exposure to Zcash. Earlier in September, ZCSH had accumulated more than $233 million in inflows since its launch, showing how dramatically sentiment had shifted before the recent reversal.
There is also a broader market component. It decline happened while Bitcoin and other risk assets were under pressure from elevated Treasury yields, rising oil prices and renewed expectations around Federal Reserve rate hikes. CoinDesk reported that it dropped about 12% on September 29, making it one of the weakest major cryptocurrencies during that session. At the same time, derivatives positioning was being reduced: reports showed it’s open interest falling as traders cut leveraged exposure after the huge September rally. That combination can accelerate downside because profit taking and liquidations reinforce each other.
🛑 The important level now is the $1,400 zone. The chart shows $ZEC attempting to stabilize after the sharp fall from above $1,600. If buyers reclaim higher resistance and volume returns, the recent sell-off could prove to be a reset after an enormous rally. But continued weakness around $1,400 would keep the $1,300 area on traders’ radar, which FXStreet identifies as the next significant support zone.
{future}(ZECUSDT)
#zecusdt #ZECAnalysis #ZEC.每日智能策略
🚨$ZEC just lost the momentum that drove its parabolic run and the sell off has a real catalyst.
After surging toward $1,700, Zcash is now fighting to hold the $1,400 area as institutional flows weaken and leverage unwinds.
The question is whether this is healthy profit-taking or the beginning of a deeper correction.
ZEC has fallen roughly 15% across three consecutive sessions, with the latest move taking price toward the $1,400 region. One of the clearest developments behind the weakness is a change in institutional flows. Grayscale’s Zcash-focused ZCSH ETF recorded more than $8 million in outflows on Monday, after previously attracting substantial capital during ZEC’s explosive September rally. That matters because the ETF had become an important source of institutional exposure to Zcash. Earlier in September, ZCSH had accumulated more than $233 million in inflows since its launch, showing how dramatically sentiment had shifted before the recent reversal.
There is also a broader market component. It decline happened while Bitcoin and other risk assets were under pressure from elevated Treasury yields, rising oil prices and renewed expectations around Federal Reserve rate hikes. CoinDesk reported that it dropped about 12% on September 29, making it one of the weakest major cryptocurrencies during that session. At the same time, derivatives positioning was being reduced: reports showed it’s open interest falling as traders cut leveraged exposure after the huge September rally. That combination can accelerate downside because profit taking and liquidations reinforce each other.
🛑 The important level now is the $1,400 zone. The chart shows $ZEC attempting to stabilize after the sharp fall from above $1,600. If buyers reclaim higher resistance and volume returns, the recent sell-off could prove to be a reset after an enormous rally. But continued weakness around $1,400 would keep the $1,300 area on traders’ radar, which FXStreet identifies as the next significant support zone.
#zecusdt #ZECAnalysis #ZEC.每日智能策略
After surging toward $1,700, Zcash is now fighting to hold the $1,400 area as institutional flows weaken and leverage unwinds.
The question is whether this is healthy profit-taking or the beginning of a deeper correction.
ZEC has fallen roughly 15% across three consecutive sessions, with the latest move taking price toward the $1,400 region. One of the clearest developments behind the weakness is a change in institutional flows. Grayscale’s Zcash-focused ZCSH ETF recorded more than $8 million in outflows on Monday, after previously attracting substantial capital during ZEC’s explosive September rally. That matters because the ETF had become an important source of institutional exposure to Zcash. Earlier in September, ZCSH had accumulated more than $233 million in inflows since its launch, showing how dramatically sentiment had shifted before the recent reversal.
There is also a broader market component. It decline happened while Bitcoin and other risk assets were under pressure from elevated Treasury yields, rising oil prices and renewed expectations around Federal Reserve rate hikes. CoinDesk reported that it dropped about 12% on September 29, making it one of the weakest major cryptocurrencies during that session. At the same time, derivatives positioning was being reduced: reports showed it’s open interest falling as traders cut leveraged exposure after the huge September rally. That combination can accelerate downside because profit taking and liquidations reinforce each other.
🛑 The important level now is the $1,400 zone. The chart shows $ZEC attempting to stabilize after the sharp fall from above $1,600. If buyers reclaim higher resistance and volume returns, the recent sell-off could prove to be a reset after an enormous rally. But continued weakness around $1,400 would keep the $1,300 area on traders’ radar, which FXStreet identifies as the next significant support zone.
#zecusdt #ZECAnalysis #ZEC.每日智能策略
1
55

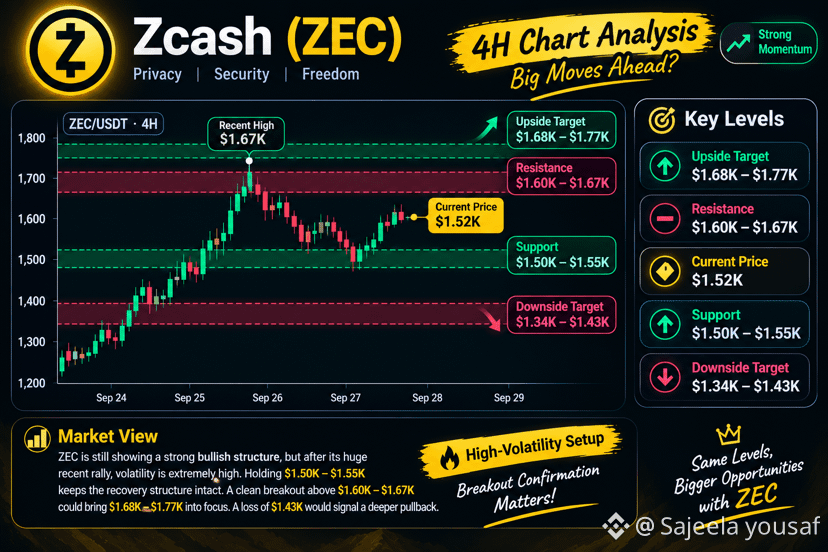
$ZEC Current Price: ~$1.52K
🔴 Resistance: $1.58K–$1.65K
🟢 Support: $1.43K–$1.45K
📈 Upside Target: $1.68K–$1.77K
📉 Downside Target: $1.34K–$1.43K
Market View:
ZEC is still showing a strong bullish structure, but after its huge recent rally, volatility is extremely high. Holding $1.43K–$1.45K keeps the recovery structure intact. A clean breakout above $1.65K could bring $1.68K–$1.77K into focus. A loss of $1.43K would signal a deeper pullback.
🔥 High-volatility setup — breakout confirmation matters.
#ZEC #Trading #Zecanalysis
$ZEC Current Price: ~$1.52K
🔴 Resistance: $1.58K–$1.65K
🟢 Support: $1.43K–$1.45K
📈 Upside Target: $1.68K–$1.77K
📉 Downside Target: $1.34K–$1.43K
Market View:
ZEC is still showing a strong bullish structure, but after its huge recent rally, volatility is extremely high. Holding $1.43K–$1.45K keeps the recovery structure intact. A clean breakout above $1.65K could bring $1.68K–$1.77K into focus. A loss of $1.43K would signal a deeper pullback.
🔥 High-volatility setup — breakout confirmation matters.
#ZEC #Trading #Zecanalysis
🔴 Resistance: $1.58K–$1.65K
🟢 Support: $1.43K–$1.45K
📈 Upside Target: $1.68K–$1.77K
📉 Downside Target: $1.34K–$1.43K
Market View:
ZEC is still showing a strong bullish structure, but after its huge recent rally, volatility is extremely high. Holding $1.43K–$1.45K keeps the recovery structure intact. A clean breakout above $1.65K could bring $1.68K–$1.77K into focus. A loss of $1.43K would signal a deeper pullback.
🔥 High-volatility setup — breakout confirmation matters.
#ZEC #Trading #Zecanalysis
206 Atlas:
Holding a recovery structure after a -9.37% drop is optimistic. The risk of a deeper pullback outweighs the breakout potential right now.
1
254

·
--
$ZEC
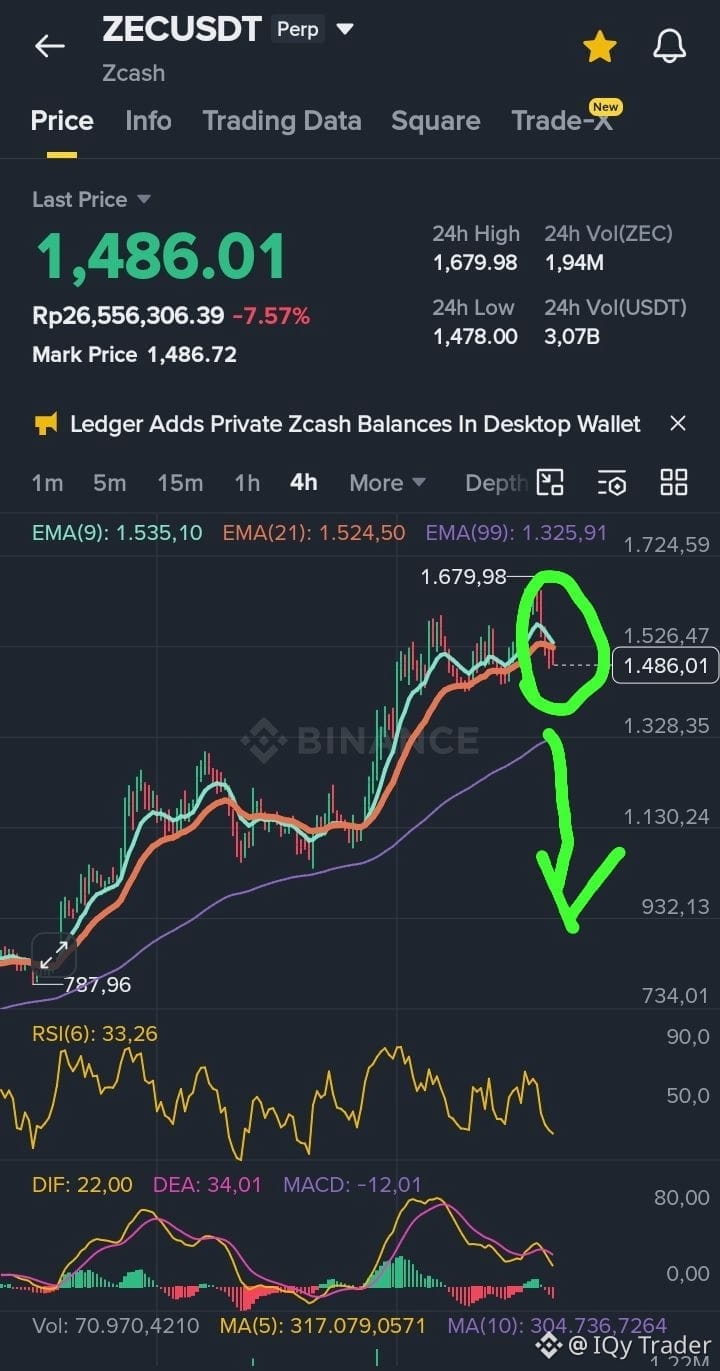
There’s always a trick with Zec. As long as his head doesn't actually slump all the way down, he’s just exhausted and recharging his head-thrusting power. That’s why we always get fooled.
#ZECAnalysis
$ZEC
There’s always a trick with Zec. As long as his head doesn't actually slump all the way down, he’s just exhausted and recharging his head-thrusting power. That’s why we always get fooled.
#ZECAnalysis
There’s always a trick with Zec. As long as his head doesn't actually slump all the way down, he’s just exhausted and recharging his head-thrusting power. That’s why we always get fooled.
#ZECAnalysis
554
·
--
Bullish
30D trade $ZEC 24.9 USDT
🚨 $ZEC ISN’T DONE YET — $2,000 IS NEXT?
It has completely flipped the structure.
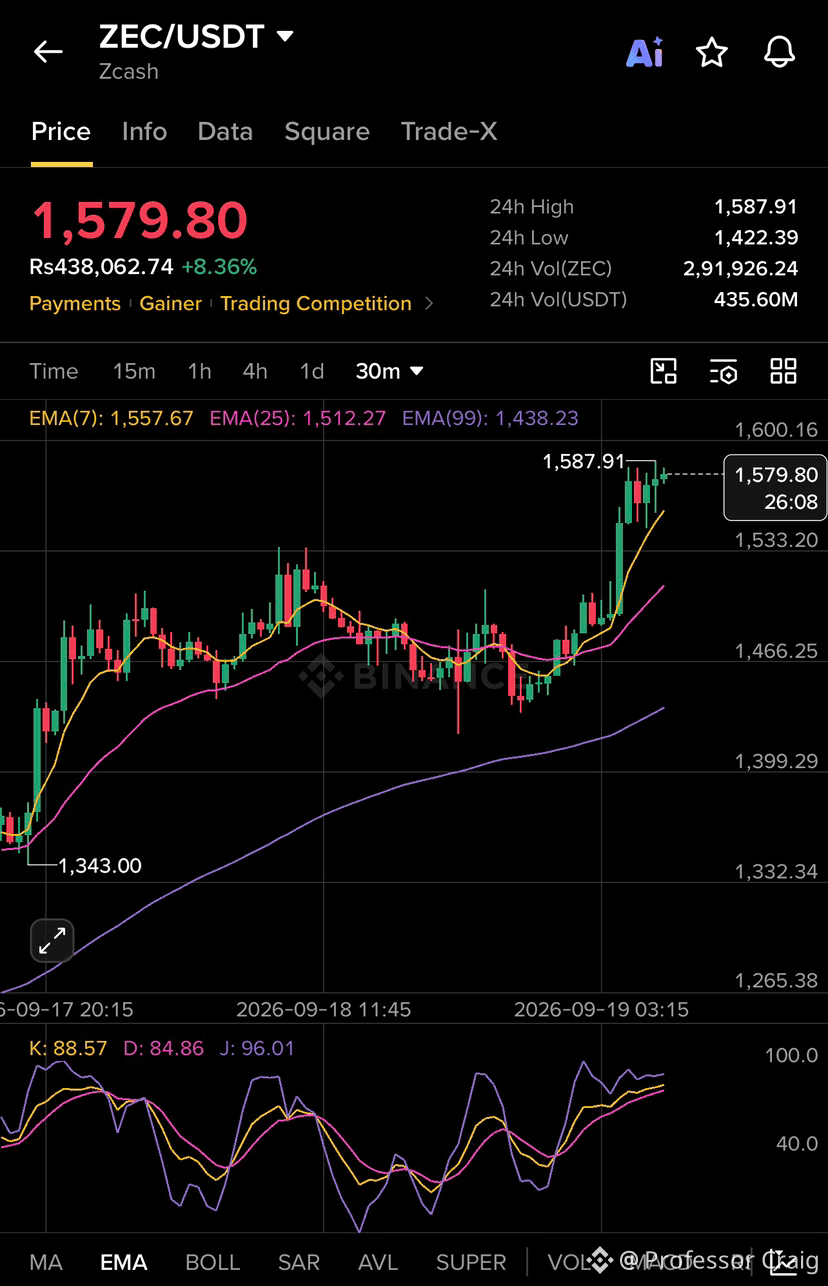
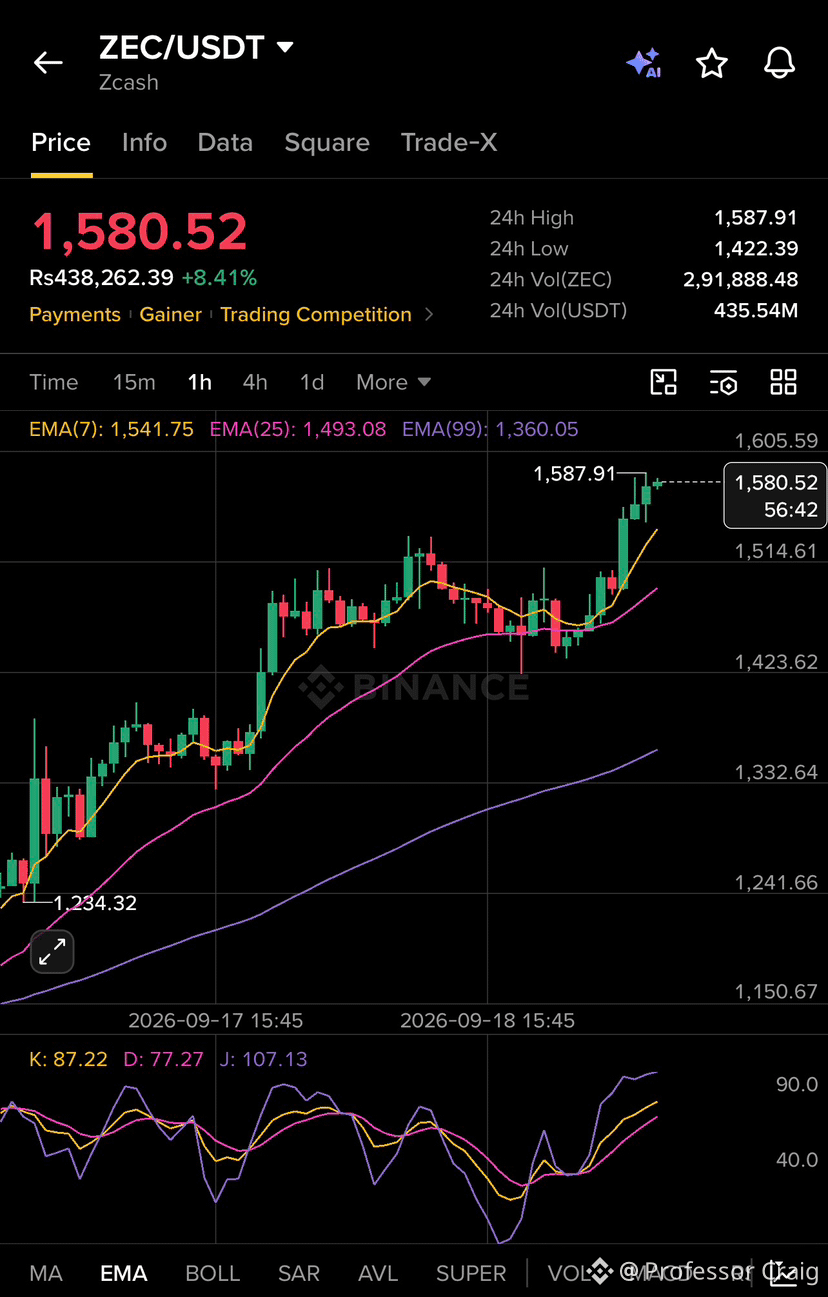
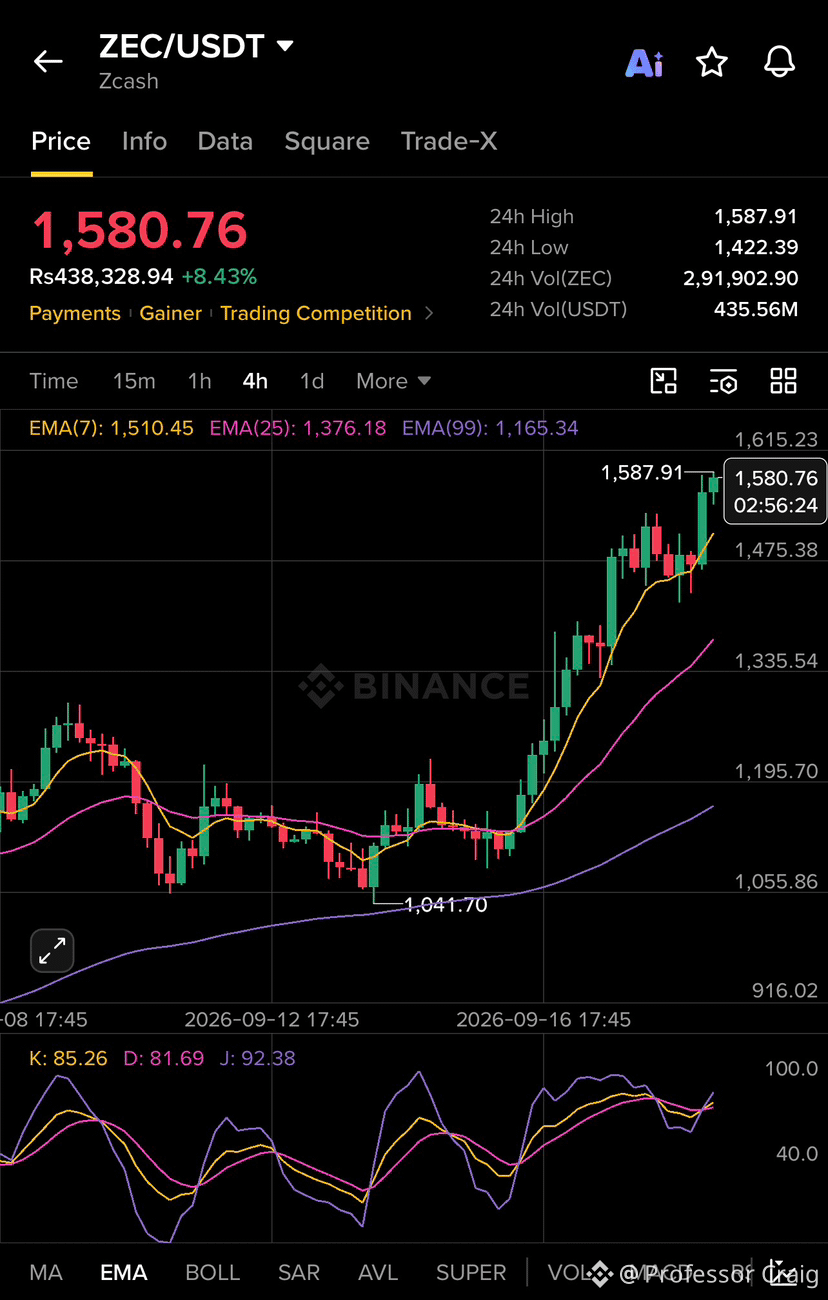
After breaking above the previous $1,300 resistance zone, ZEC pushed aggressively toward $1,600, printing a fresh local high around $1,587.91.
Now the chart is holding near the highs instead of giving back the entire move. That matters.
On the 1H and 4H charts, price remains above the 7 EMA and 25 EMA, while the 99 EMA is sitting far below. The trend is clearly stretched to the upside, but momentum is still strong.
The immediate level everyone should be watching is $1,600.
A clean move through $1,600 would put ZEC into another major breakout area, with the current structure leaving room for the next expansion toward $2,000.
But don’t confuse strong momentum with a straight-line move. The $1,587 to $1,600 zone is the immediate battle after this massive run.
ZEC went from struggling below $1,100 to trading around $1,580 in a matter of days.
The old resistance is gone.
Now the question is whether ZEC can turn $1,600 into the next support zone and continue pushing toward $2,000.
{future}(ZECUSDT)
#ZECUSDT #zec2000 #ZECAnalysis #BullishMomentum
🚨 $ZEC ISN’T DONE YET — $2,000 IS NEXT?
It has completely flipped the structure.
After breaking above the previous $1,300 resistance zone, ZEC pushed aggressively toward $1,600, printing a fresh local high around $1,587.91.
Now the chart is holding near the highs instead of giving back the entire move. That matters.
On the 1H and 4H charts, price remains above the 7 EMA and 25 EMA, while the 99 EMA is sitting far below. The trend is clearly stretched to the upside, but momentum is still strong.
The immediate level everyone should be watching is $1,600.
A clean move through $1,600 would put ZEC into another major breakout area, with the current structure leaving room for the next expansion toward $2,000.
But don’t confuse strong momentum with a straight-line move. The $1,587 to $1,600 zone is the immediate battle after this massive run.
ZEC went from struggling below $1,100 to trading around $1,580 in a matter of days.
The old resistance is gone.
Now the question is whether ZEC can turn $1,600 into the next support zone and continue pushing toward $2,000.
#ZECUSDT #zec2000 #ZECAnalysis #BullishMomentum
It has completely flipped the structure.
After breaking above the previous $1,300 resistance zone, ZEC pushed aggressively toward $1,600, printing a fresh local high around $1,587.91.
Now the chart is holding near the highs instead of giving back the entire move. That matters.
On the 1H and 4H charts, price remains above the 7 EMA and 25 EMA, while the 99 EMA is sitting far below. The trend is clearly stretched to the upside, but momentum is still strong.
The immediate level everyone should be watching is $1,600.
A clean move through $1,600 would put ZEC into another major breakout area, with the current structure leaving room for the next expansion toward $2,000.
But don’t confuse strong momentum with a straight-line move. The $1,587 to $1,600 zone is the immediate battle after this massive run.
ZEC went from struggling below $1,100 to trading around $1,580 in a matter of days.
The old resistance is gone.
Now the question is whether ZEC can turn $1,600 into the next support zone and continue pushing toward $2,000.
#ZECUSDT #zec2000 #ZECAnalysis #BullishMomentum
4
2
2
1.2k
·
--
Bullish
30D trade $ZEC 24.9 USDT
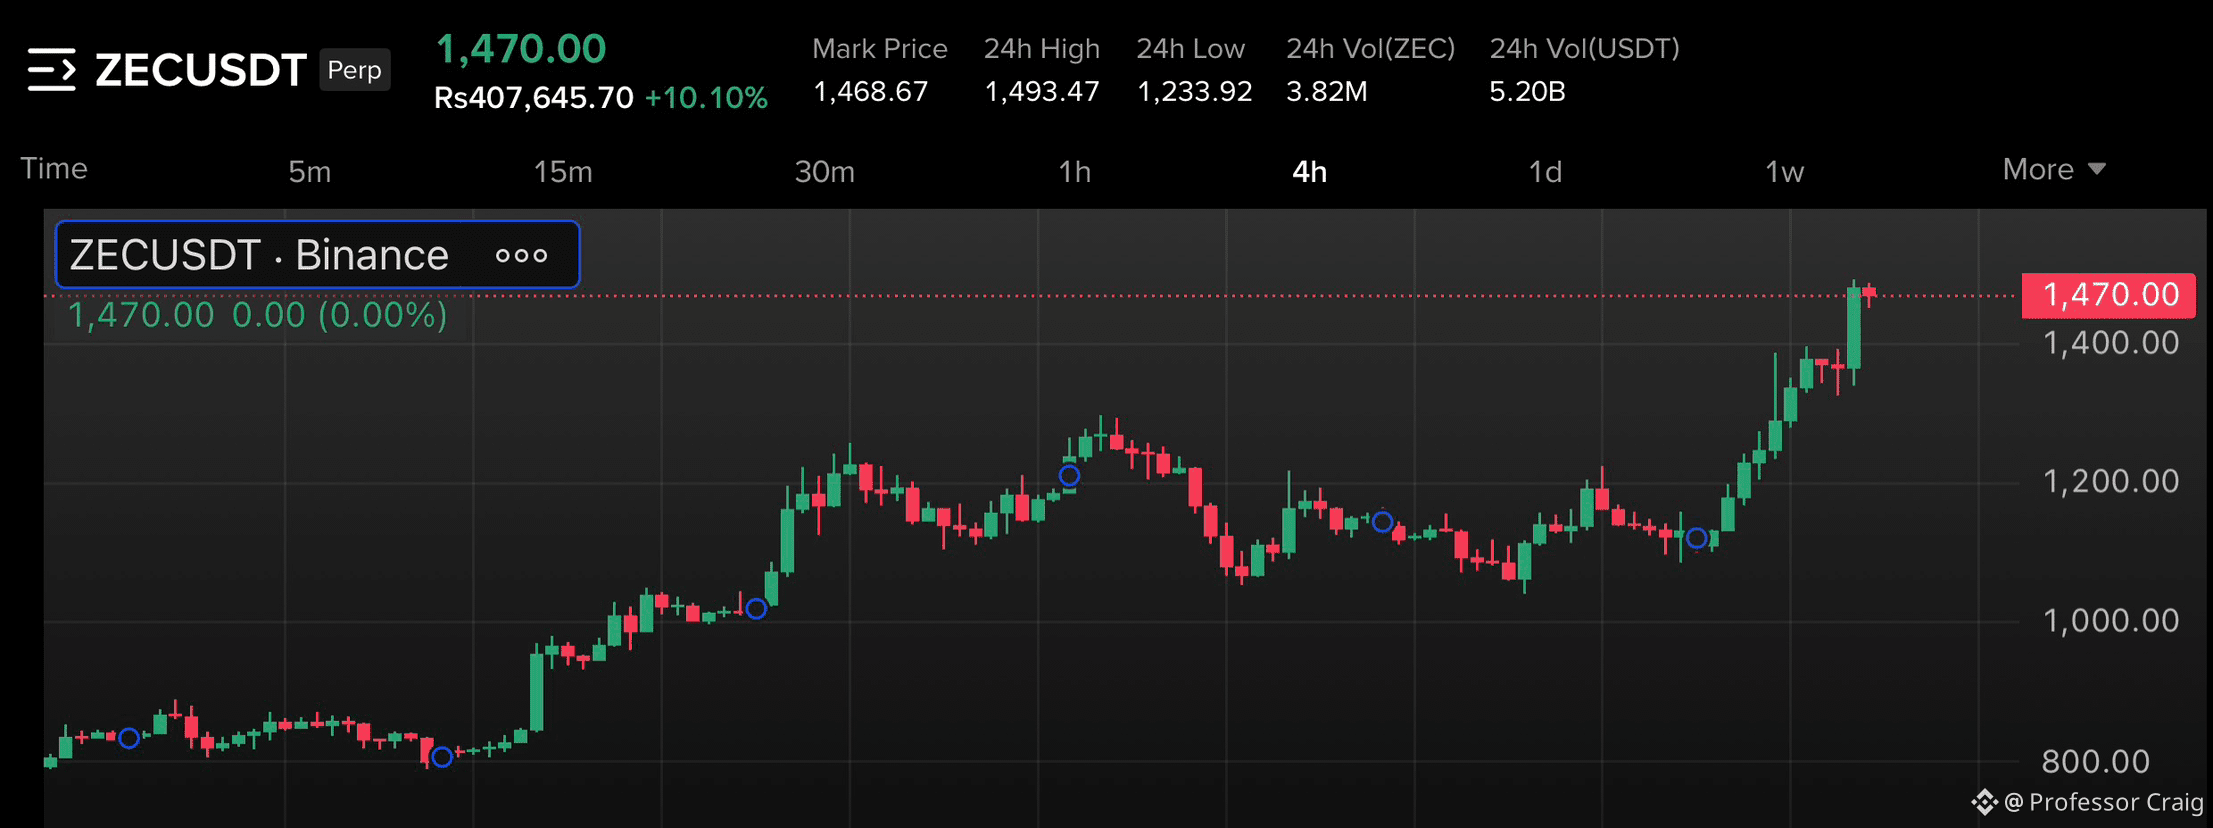
🚨$ZEC is moving towards 2000$ price zone and nothing is going to stop it from here. 🚨
What did i told you guys yesterday about $ZEC and what Acutually happened today, take a look by yourself. 😎
On mt yesterday Post I told you guys about zec about to do breakout above 1300$ price zone and it went perfectly as i told and then i said it will hit 1500$ then 2000$ and price of zec is acutually moving just as i told you
You guys still doubt me on this analysis ? Dear followers, you guys can have a blind trust on me in this Zec analysis beacuse i have done research more then anyone here in binance and i know whats next for Zec very clearly.
My Predicition before: $1300 Breakout ✅
Another Predicition: $1500 zone ✅
Final Target: $2000 price zone ( Verysoon )
📌You guys can doubt me or ignore me but my real followers knows what i am talking about. You guys will see Zec Blasting at $1500 to $1800 zone then only you guys will believe me that my predicition and analysis were true and you guys should have listened to me.
Trust me, now is not late but if you guys wait more then it will surely make you feel regretful.
Choice is yours guys.
{future}(ZECUSDT)
#ZECUSDT #ZECAnalysis #Zec2000 #Zecalltimehigh
🚨$ZEC is moving towards 2000$ price zone and nothing is going to stop it from here. 🚨
What did i told you guys yesterday about $ZEC and what Acutually happened today, take a look by yourself. 😎
On mt yesterday Post I told you guys about zec about to do breakout above 1300$ price zone and it went perfectly as i told and then i said it will hit 1500$ then 2000$ and price of zec is acutually moving just as i told you
You guys still doubt me on this analysis ? Dear followers, you guys can have a blind trust on me in this Zec analysis beacuse i have done research more then anyone here in binance and i know whats next for Zec very clearly.
My Predicition before: $1300 Breakout ✅
Another Predicition: $1500 zone ✅
Final Target: $2000 price zone ( Verysoon )
📌You guys can doubt me or ignore me but my real followers knows what i am talking about. You guys will see Zec Blasting at $1500 to $1800 zone then only you guys will believe me that my predicition and analysis were true and you guys should have listened to me.
Trust me, now is not late but if you guys wait more then it will surely make you feel regretful.
Choice is yours guys.
#ZECUSDT #ZECAnalysis #Zec2000 #Zecalltimehigh
What did i told you guys yesterday about $ZEC and what Acutually happened today, take a look by yourself. 😎
On mt yesterday Post I told you guys about zec about to do breakout above 1300$ price zone and it went perfectly as i told and then i said it will hit 1500$ then 2000$ and price of zec is acutually moving just as i told you
You guys still doubt me on this analysis ? Dear followers, you guys can have a blind trust on me in this Zec analysis beacuse i have done research more then anyone here in binance and i know whats next for Zec very clearly.
My Predicition before: $1300 Breakout ✅
Another Predicition: $1500 zone ✅
Final Target: $2000 price zone ( Verysoon )
📌You guys can doubt me or ignore me but my real followers knows what i am talking about. You guys will see Zec Blasting at $1500 to $1800 zone then only you guys will believe me that my predicition and analysis were true and you guys should have listened to me.
Trust me, now is not late but if you guys wait more then it will surely make you feel regretful.
Choice is yours guys.
#ZECUSDT #ZECAnalysis #Zec2000 #Zecalltimehigh
4
2
137
·
--
Bullish
30D trade $ZEC 24.9 USDT
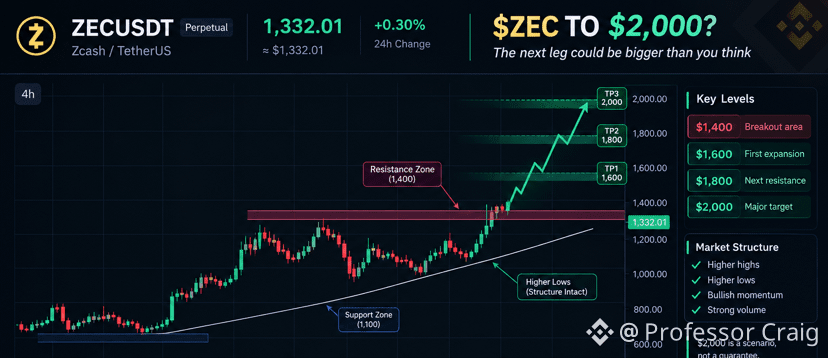
🚨$ZEC TO $2,000? THE CHART IS STARTING TO TELL A VERY INTERESTING STORY
It is currently around the $1,332 area after a powerful move from the $1,100 zone. On the 4H chart, the structure remains strongly bullish, with higher highs and higher lows developing across the recent move.
The key area now is the $1,400 resistance zone. A clean breakout and sustained 4H closes above it could open the door toward $1,600, followed by $1,800 and potentially the psychological $2,000 zone.
But $2,000 should be treated as a scenario, not a guaranteed target. After such a sharp rally, consolidation or a deeper pullback would also be completely normal. The main thing I would watch is whether ZEC continues defending higher support levels while volume remains elevated.
If the structure keeps holding, the $2,000 level becomes an interesting technical area to monitor.
Key levels:
$1,400 → Breakout area
$1,600 → First major expansion zone
$1,800 → Next resistance
$2,000 → Major psychological target
What do you think: can ZEC reach $2,000?
Also keep an eye on $BR & $LSK too.🔙
{future}(LSKUSDT)
{future}(BRUSDT)
{future}(ZECUSDT)
#ZECUSDT #ZECAnalysis #zec #BR
🚨$ZEC TO $2,000? THE CHART IS STARTING TO TELL A VERY INTERESTING STORY
It is currently around the $1,332 area after a powerful move from the $1,100 zone. On the 4H chart, the structure remains strongly bullish, with higher highs and higher lows developing across the recent move.
The key area now is the $1,400 resistance zone. A clean breakout and sustained 4H closes above it could open the door toward $1,600, followed by $1,800 and potentially the psychological $2,000 zone.
But $2,000 should be treated as a scenario, not a guaranteed target. After such a sharp rally, consolidation or a deeper pullback would also be completely normal. The main thing I would watch is whether ZEC continues defending higher support levels while volume remains elevated.
If the structure keeps holding, the $2,000 level becomes an interesting technical area to monitor.
Key levels:
$1,400 → Breakout area
$1,600 → First major expansion zone
$1,800 → Next resistance
$2,000 → Major psychological target
What do you think: can ZEC reach $2,000?
Also keep an eye on $BR & $LSK too.🔙
#ZECUSDT #ZECAnalysis #zec #BR
It is currently around the $1,332 area after a powerful move from the $1,100 zone. On the 4H chart, the structure remains strongly bullish, with higher highs and higher lows developing across the recent move.
The key area now is the $1,400 resistance zone. A clean breakout and sustained 4H closes above it could open the door toward $1,600, followed by $1,800 and potentially the psychological $2,000 zone.
But $2,000 should be treated as a scenario, not a guaranteed target. After such a sharp rally, consolidation or a deeper pullback would also be completely normal. The main thing I would watch is whether ZEC continues defending higher support levels while volume remains elevated.
If the structure keeps holding, the $2,000 level becomes an interesting technical area to monitor.
Key levels:
$1,400 → Breakout area
$1,600 → First major expansion zone
$1,800 → Next resistance
$2,000 → Major psychological target
What do you think: can ZEC reach $2,000?
Also keep an eye on $BR & $LSK too.🔙
#ZECUSDT #ZECAnalysis #zec #BR
4
2
597
·
--
Bullish
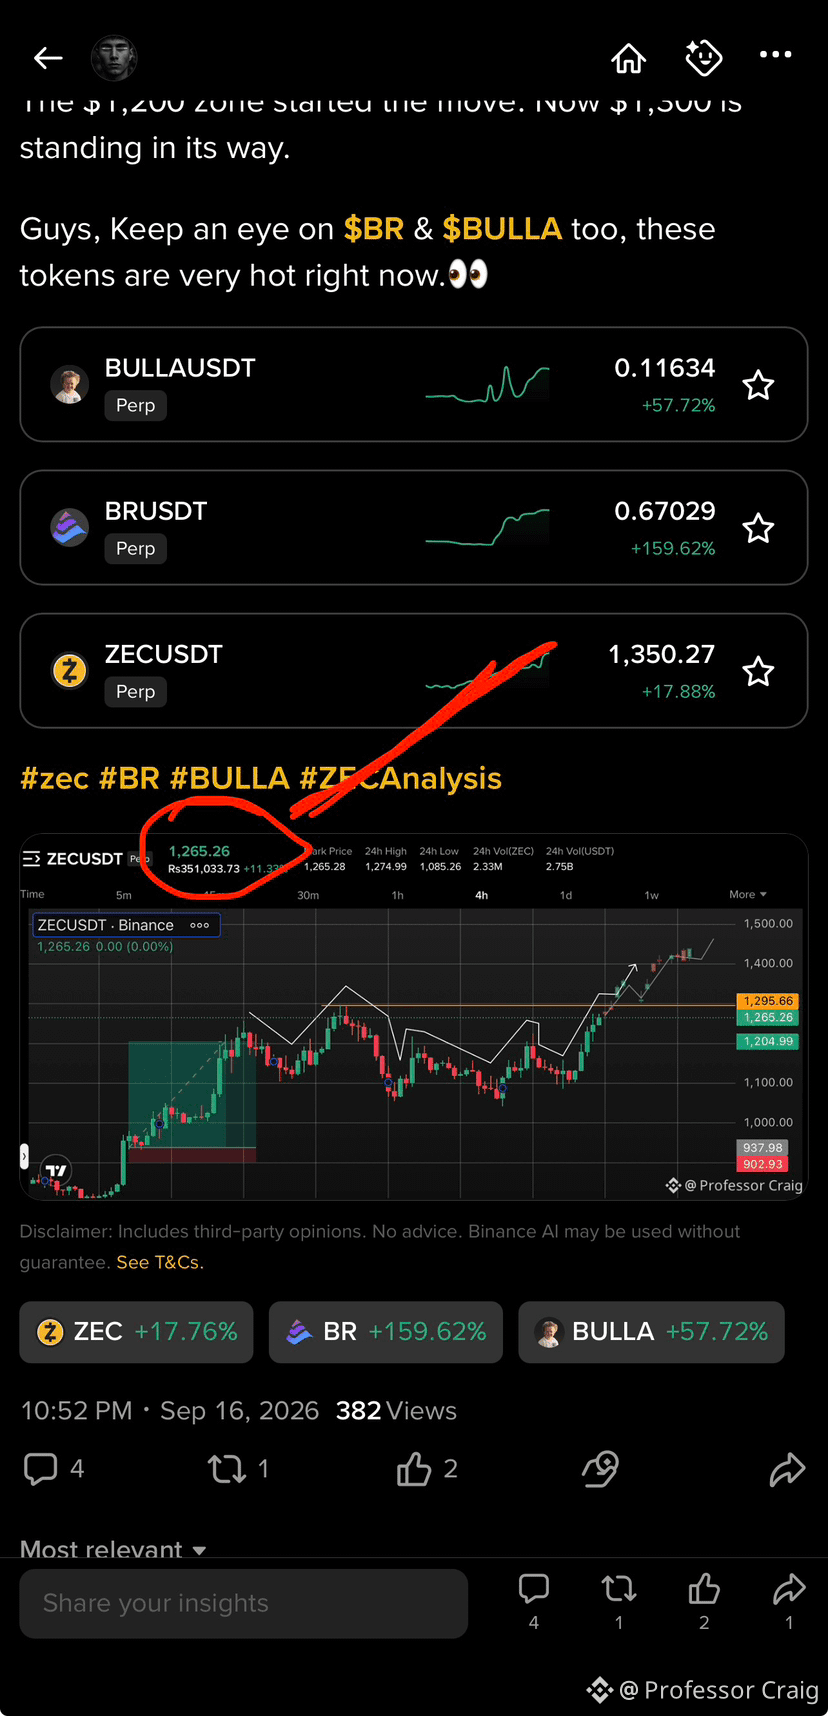
🚨$ZEC HAS FAILED TWICE AT $1,300. THE 3RD ATTEMPT COULD OPEN THE ROAD TO $2,000
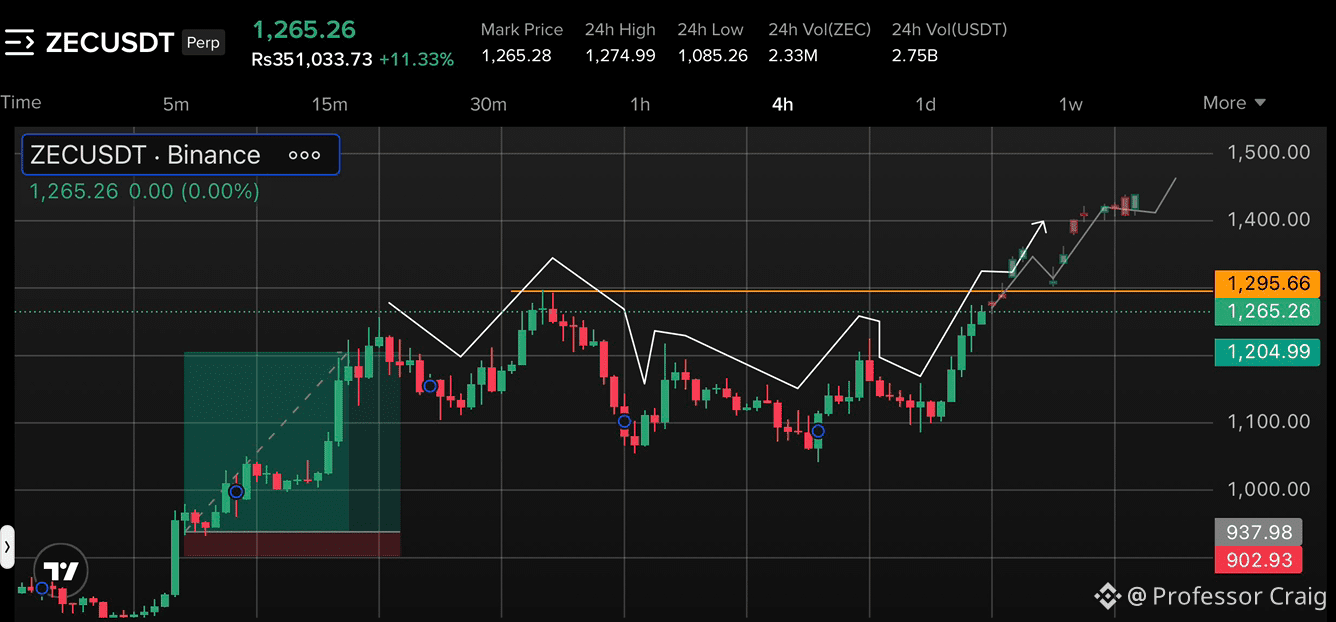
$1,204 WAS THE LINE.
$1,295 IS THE NEXT WALL.
$1,400 IS ALREADY ON THE CHART.
It has completely shifted its structure on the 4H chart.
After spending weeks moving between the $1,100 and $1,200 area, buyers finally stepped in with a strong expansion move. Price reclaimed $1,204.99 and continued pushing higher, taking ZEC toward the $1,270 region.
The important part here is the structure. 📌
Every major dip on the right side of the chart has been followed by another push higher. The market is printing higher highs and higher lows, while the previous resistance around $1,204 has now become the key level underneath the current price.
The next major battle is sitting at $1,295.66.
A clean move through that level puts the chart directly into the $1,300+ zone, with the previous projected move pointing toward $1,400. Above that, the chart has room toward the $1,500 psychological level.
This is no longer the same, structure that was stuck around $1,100.
$1,204 has been reclaimed.
$1,295 is being attacked.
$1,400 is the next major target on the chart.
It is moving back into price territory where momentum can become very aggressive.
The $1,200 zone started the move. Now $1,300 is standing in its way.
Guys, Keep an eye on $BR & $BULLA too, these tokens are very hot right now.👀
{future}(BULLAUSDT)
{future}(BRUSDT)
{future}(ZECUSDT)
#zec #BR #BULLA #ZECAnalysis
🚨$ZEC HAS FAILED TWICE AT $1,300. THE 3RD ATTEMPT COULD OPEN THE ROAD TO $2,000
$1,204 WAS THE LINE.
$1,295 IS THE NEXT WALL.
$1,400 IS ALREADY ON THE CHART.
It has completely shifted its structure on the 4H chart.
After spending weeks moving between the $1,100 and $1,200 area, buyers finally stepped in with a strong expansion move. Price reclaimed $1,204.99 and continued pushing higher, taking ZEC toward the $1,270 region.
The important part here is the structure. 📌
Every major dip on the right side of the chart has been followed by another push higher. The market is printing higher highs and higher lows, while the previous resistance around $1,204 has now become the key level underneath the current price.
The next major battle is sitting at $1,295.66.
A clean move through that level puts the chart directly into the $1,300+ zone, with the previous projected move pointing toward $1,400. Above that, the chart has room toward the $1,500 psychological level.
This is no longer the same, structure that was stuck around $1,100.
$1,204 has been reclaimed.
$1,295 is being attacked.
$1,400 is the next major target on the chart.
It is moving back into price territory where momentum can become very aggressive.
The $1,200 zone started the move. Now $1,300 is standing in its way.
Guys, Keep an eye on $BR & $BULLA too, these tokens are very hot right now.👀
#zec #BR #BULLA #ZECAnalysis
$1,204 WAS THE LINE.
$1,295 IS THE NEXT WALL.
$1,400 IS ALREADY ON THE CHART.
It has completely shifted its structure on the 4H chart.
After spending weeks moving between the $1,100 and $1,200 area, buyers finally stepped in with a strong expansion move. Price reclaimed $1,204.99 and continued pushing higher, taking ZEC toward the $1,270 region.
The important part here is the structure. 📌
Every major dip on the right side of the chart has been followed by another push higher. The market is printing higher highs and higher lows, while the previous resistance around $1,204 has now become the key level underneath the current price.
The next major battle is sitting at $1,295.66.
A clean move through that level puts the chart directly into the $1,300+ zone, with the previous projected move pointing toward $1,400. Above that, the chart has room toward the $1,500 psychological level.
This is no longer the same, structure that was stuck around $1,100.
$1,204 has been reclaimed.
$1,295 is being attacked.
$1,400 is the next major target on the chart.
It is moving back into price territory where momentum can become very aggressive.
The $1,200 zone started the move. Now $1,300 is standing in its way.
Guys, Keep an eye on $BR & $BULLA too, these tokens are very hot right now.👀
#zec #BR #BULLA #ZECAnalysis
4
2
2
385
·
--
Bullish
30D trade $ZEC 24.9 USDT
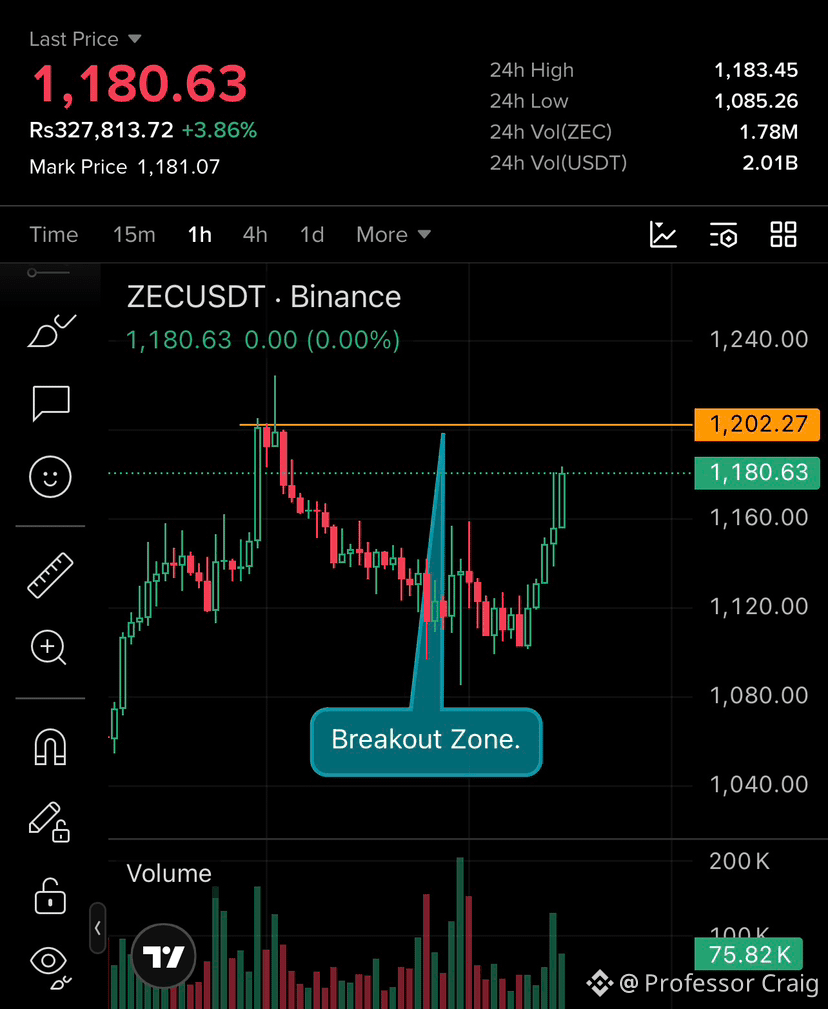
🚨 $ZEC is already in reversal bullish zone and is so close to break the next upper resistance. Keep and strong eye on it for perfect entry.
I’ve already opened the long position but for you guys must wait, wait till it breakes the 1,200$ resistance zone.
The perfect entry will be around 1203$ zone and after that our Target will be at 1255$ to 1278$ zone and more updates will be there soon!
Keep an eye guys, don’t miss this breakout zone.
{future}(ZECUSDT)
#ZECUSDT #zcash #ZECAnalysis
🚨 $ZEC is already in reversal bullish zone and is so close to break the next upper resistance. Keep and strong eye on it for perfect entry.
I’ve already opened the long position but for you guys must wait, wait till it breakes the 1,200$ resistance zone.
The perfect entry will be around 1203$ zone and after that our Target will be at 1255$ to 1278$ zone and more updates will be there soon!
Keep an eye guys, don’t miss this breakout zone.
#ZECUSDT #zcash #ZECAnalysis
I’ve already opened the long position but for you guys must wait, wait till it breakes the 1,200$ resistance zone.
The perfect entry will be around 1203$ zone and after that our Target will be at 1255$ to 1278$ zone and more updates will be there soon!
Keep an eye guys, don’t miss this breakout zone.
#ZECUSDT #zcash #ZECAnalysis
4
2
220
·
--
Bearish
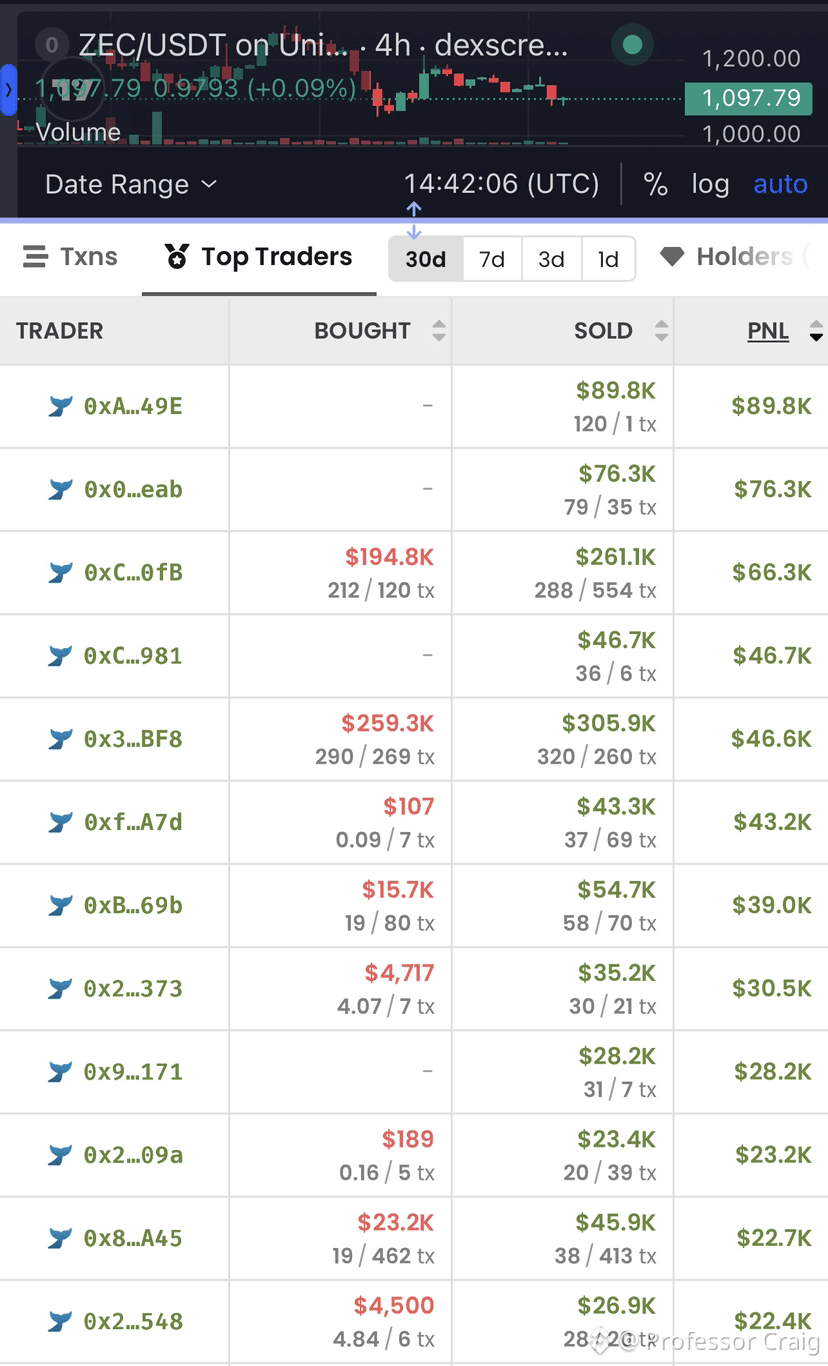
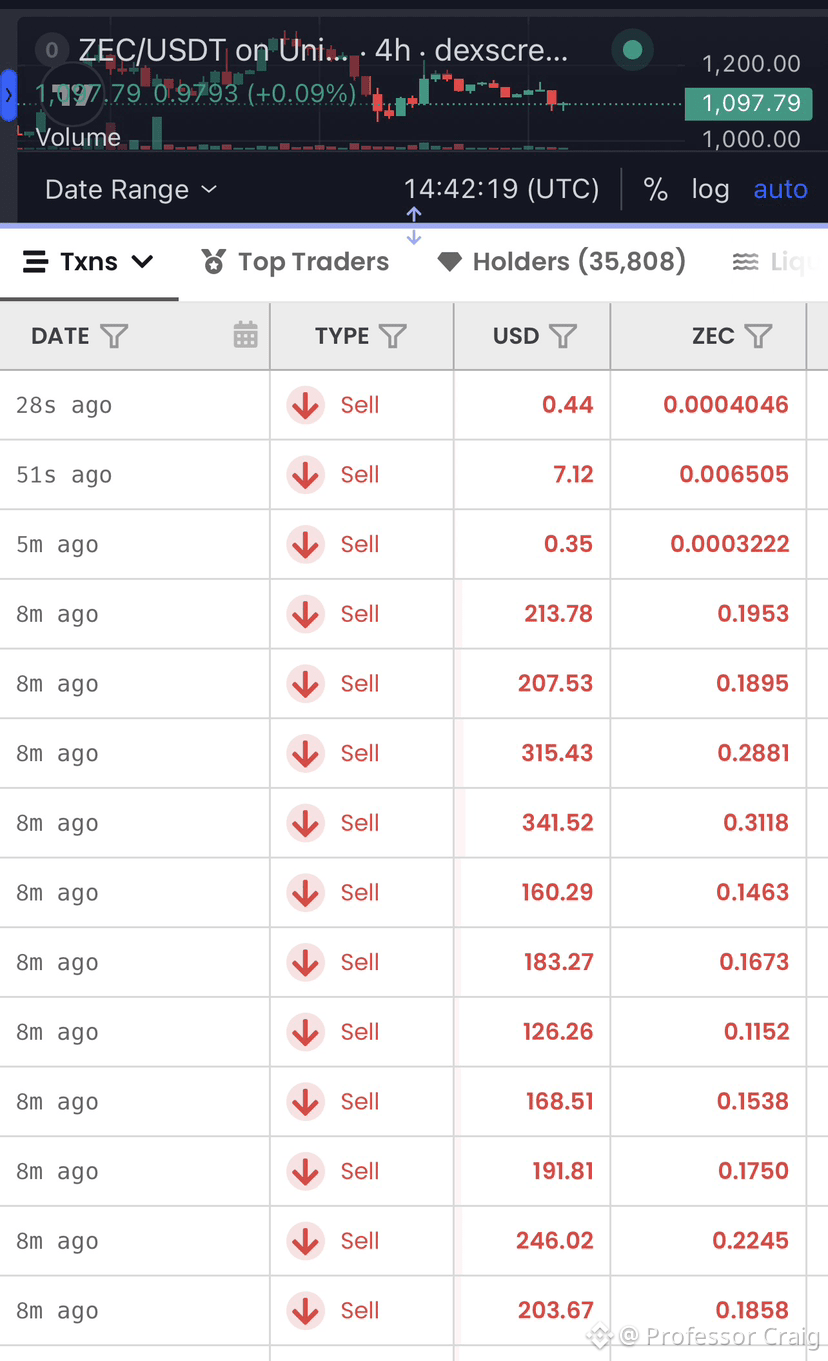
🚨 $ZEC is sitting around $1,098 — but the on-chain data looks different.
The latest transactions show repeated selling, including several larger sells in the $125–$342 range and a notable cluster of transactions within minutes. At the same time, the 30 day Top Traders data shows several wallets realizing significant profits, with some traders showing $40K–$90K+ in realized PNL.
That doesn’t automatically mean ZEC is about to dump. Profit taking after a strong rally is normal, and large traders can sell for many different reasons. But when repeated selling appears while price struggles to reclaim the $1,100–$1,120 area, it deserves attention.
For me, the key question now is simple: can buyers absorb this selling pressure?
If ZEC loses the nearby support zone, another deeper correction could follow. But if buyers step in and reclaim resistance with volume, this distribution could turn into another accumulation phase.
Watch the next few candles closely. 📉
{future}(ZECUSDT)
#zec #ZECAnalysis
🚨 $ZEC is sitting around $1,098 — but the on-chain data looks different.
The latest transactions show repeated selling, including several larger sells in the $125–$342 range and a notable cluster of transactions within minutes. At the same time, the 30 day Top Traders data shows several wallets realizing significant profits, with some traders showing $40K–$90K+ in realized PNL.
That doesn’t automatically mean ZEC is about to dump. Profit taking after a strong rally is normal, and large traders can sell for many different reasons. But when repeated selling appears while price struggles to reclaim the $1,100–$1,120 area, it deserves attention.
For me, the key question now is simple: can buyers absorb this selling pressure?
If ZEC loses the nearby support zone, another deeper correction could follow. But if buyers step in and reclaim resistance with volume, this distribution could turn into another accumulation phase.
Watch the next few candles closely. 📉
#zec #ZECAnalysis
The latest transactions show repeated selling, including several larger sells in the $125–$342 range and a notable cluster of transactions within minutes. At the same time, the 30 day Top Traders data shows several wallets realizing significant profits, with some traders showing $40K–$90K+ in realized PNL.
That doesn’t automatically mean ZEC is about to dump. Profit taking after a strong rally is normal, and large traders can sell for many different reasons. But when repeated selling appears while price struggles to reclaim the $1,100–$1,120 area, it deserves attention.
For me, the key question now is simple: can buyers absorb this selling pressure?
If ZEC loses the nearby support zone, another deeper correction could follow. But if buyers step in and reclaim resistance with volume, this distribution could turn into another accumulation phase.
Watch the next few candles closely. 📉
#zec #ZECAnalysis
2
2
1.2k
·
--
Bullish
Verified
How Did $ZEC Secure This Massive Pump? 🤔👀
Zcash did not simply wake up one morning and pump. This move looks like the result of multiple catalysts stacking on top of each other, while the chart structure created the conditions for an explosive repricing.
The first major factor is the return of the privacy narrative. Zcash has been benefiting from renewed demand for financial privacy, with shielded usage and shielded supply becoming increasingly important parts of the fundamental story.
Then came the institutional catalyst. Grayscale’s Zcash Trust conversion into the first U.S. spot ZEC ETF gave traditional investors a much easier route to gain exposure to ZEC. That transformed Zcash from an older privacy coin into something the market could suddenly treat as an institutional asset.
The technical structure amplified everything.
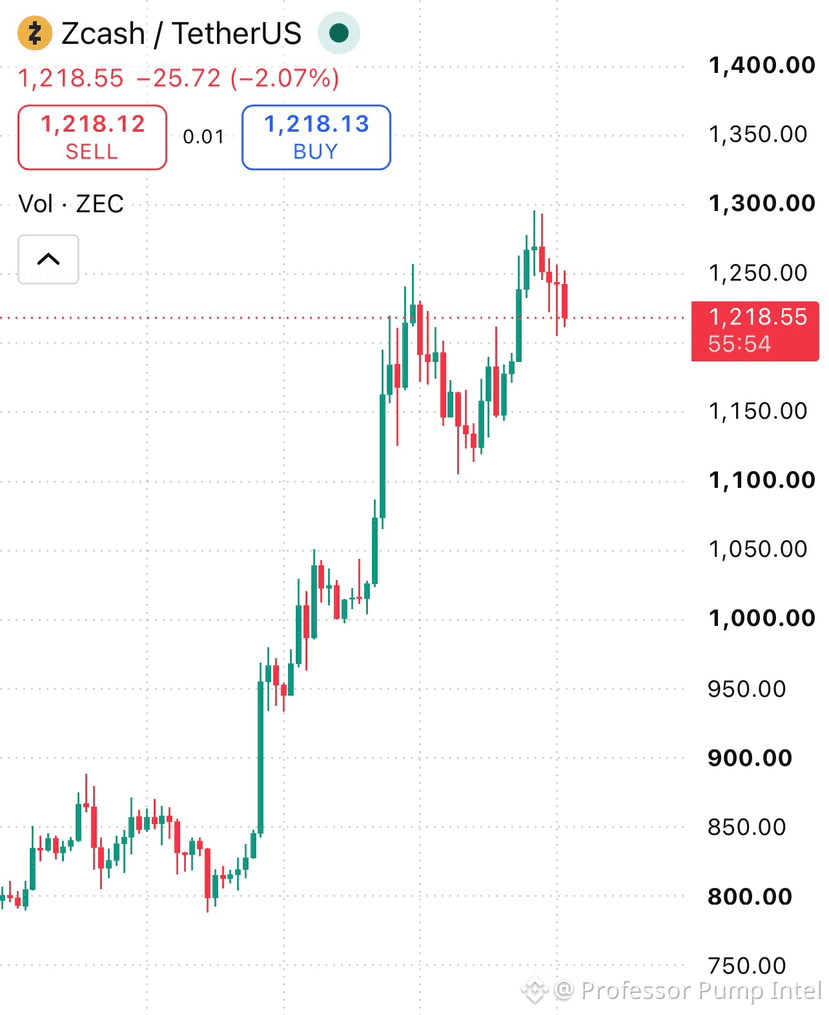
Looking at the chart, ZEC spent significant time building momentum before aggressively breaking through previous resistance zones. Once price cleared the major $800 area and continued toward $1,000, short sellers were forced to cover while momentum traders chased the breakout. Earlier in 2026, ZEC rallies had already produced massive short liquidations, demonstrating how leverage can accelerate an existing trend.
There is also a supply-side argument. ZEC has a fixed 21 million maximum supply, while issuance has been reduced through halvings. At the same time, more ZEC has been moving into shielded pools, potentially reducing immediately available liquid supply.
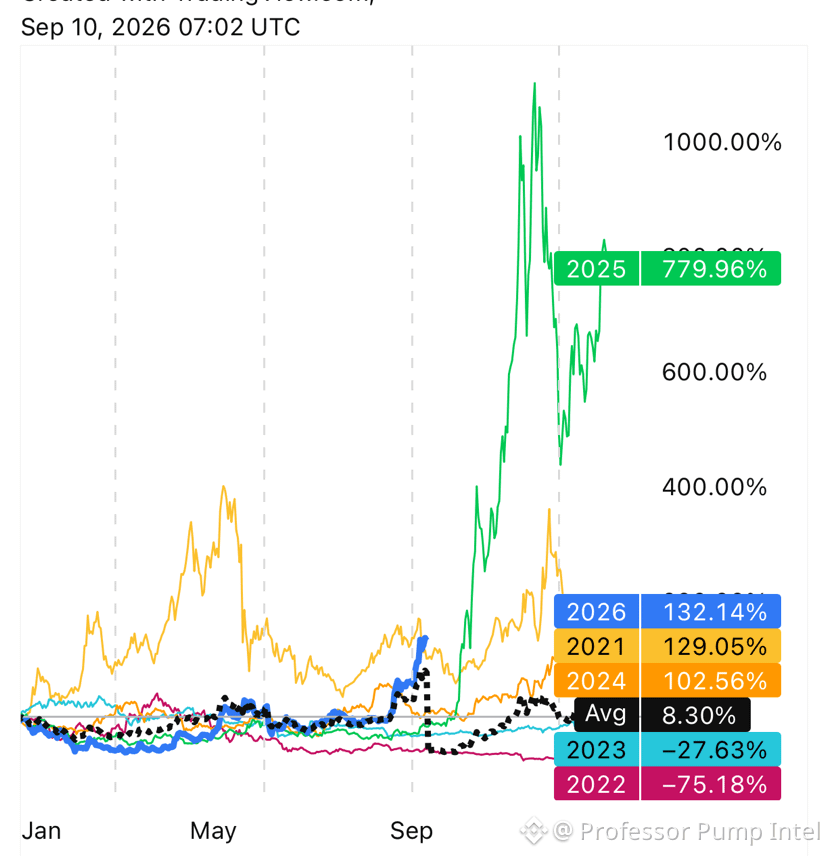
And the second chart tells an even bigger story: 2025 delivered an enormous repricing, while 2026 continued that momentum rather than completely resetting it.
So the pump was not caused by one single headline.
It was the combination of privacy demand + institutional access + reduced issuance + shrinking liquid supply + technical breakout + leverage + short squeezes + an extremely strong market narrative.
That combination is exactly how an old asset can suddenly become the center of the market again.
{future}(ZECUSDT)
#zec #ZECUSDT #zcash #ZECAnalysis
How Did $ZEC Secure This Massive Pump? 🤔👀
Zcash did not simply wake up one morning and pump. This move looks like the result of multiple catalysts stacking on top of each other, while the chart structure created the conditions for an explosive repricing.
The first major factor is the return of the privacy narrative. Zcash has been benefiting from renewed demand for financial privacy, with shielded usage and shielded supply becoming increasingly important parts of the fundamental story.
Then came the institutional catalyst. Grayscale’s Zcash Trust conversion into the first U.S. spot ZEC ETF gave traditional investors a much easier route to gain exposure to ZEC. That transformed Zcash from an older privacy coin into something the market could suddenly treat as an institutional asset.
The technical structure amplified everything.
Looking at the chart, ZEC spent significant time building momentum before aggressively breaking through previous resistance zones. Once price cleared the major $800 area and continued toward $1,000, short sellers were forced to cover while momentum traders chased the breakout. Earlier in 2026, ZEC rallies had already produced massive short liquidations, demonstrating how leverage can accelerate an existing trend.
There is also a supply-side argument. ZEC has a fixed 21 million maximum supply, while issuance has been reduced through halvings. At the same time, more ZEC has been moving into shielded pools, potentially reducing immediately available liquid supply.
And the second chart tells an even bigger story: 2025 delivered an enormous repricing, while 2026 continued that momentum rather than completely resetting it.
So the pump was not caused by one single headline.
It was the combination of privacy demand + institutional access + reduced issuance + shrinking liquid supply + technical breakout + leverage + short squeezes + an extremely strong market narrative.
That combination is exactly how an old asset can suddenly become the center of the market again.
#zec #ZECUSDT #zcash #ZECAnalysis
Zcash did not simply wake up one morning and pump. This move looks like the result of multiple catalysts stacking on top of each other, while the chart structure created the conditions for an explosive repricing.
The first major factor is the return of the privacy narrative. Zcash has been benefiting from renewed demand for financial privacy, with shielded usage and shielded supply becoming increasingly important parts of the fundamental story.
Then came the institutional catalyst. Grayscale’s Zcash Trust conversion into the first U.S. spot ZEC ETF gave traditional investors a much easier route to gain exposure to ZEC. That transformed Zcash from an older privacy coin into something the market could suddenly treat as an institutional asset.
The technical structure amplified everything.
Looking at the chart, ZEC spent significant time building momentum before aggressively breaking through previous resistance zones. Once price cleared the major $800 area and continued toward $1,000, short sellers were forced to cover while momentum traders chased the breakout. Earlier in 2026, ZEC rallies had already produced massive short liquidations, demonstrating how leverage can accelerate an existing trend.
There is also a supply-side argument. ZEC has a fixed 21 million maximum supply, while issuance has been reduced through halvings. At the same time, more ZEC has been moving into shielded pools, potentially reducing immediately available liquid supply.
And the second chart tells an even bigger story: 2025 delivered an enormous repricing, while 2026 continued that momentum rather than completely resetting it.
So the pump was not caused by one single headline.
It was the combination of privacy demand + institutional access + reduced issuance + shrinking liquid supply + technical breakout + leverage + short squeezes + an extremely strong market narrative.
That combination is exactly how an old asset can suddenly become the center of the market again.
#zec #ZECUSDT #zcash #ZECAnalysis

1
1
192

·
--
Bullish
Can $ZEC Cross the $2,000 🔥 Price Zone or Am I Stupid? 👀
Let’s be honest, calling for $ZEC to reach $2,000 sounds crazy when you look at the price today. But crypto has a habit of making “impossible” targets look possible when momentum, liquidity and market attention align.
ZEC has already shown serious strength, and if the bullish momentum continues, the $2,000 zone could eventually become a realistic target rather than just a wild prediction.
The real question is whether ZEC can keep attracting buyers and break through each major resistance level without a deep correction.
$2,000 ZEC: realistic target or pure madness?
What do you think?
{future}(ZECUSDT)
#zec #zcash #ZECUSDT #ZECAnalysis
Can $ZEC Cross the $2,000 🔥 Price Zone or Am I Stupid? 👀
Let’s be honest, calling for $ZEC to reach $2,000 sounds crazy when you look at the price today. But crypto has a habit of making “impossible” targets look possible when momentum, liquidity and market attention align.
ZEC has already shown serious strength, and if the bullish momentum continues, the $2,000 zone could eventually become a realistic target rather than just a wild prediction.
The real question is whether ZEC can keep attracting buyers and break through each major resistance level without a deep correction.
$2,000 ZEC: realistic target or pure madness?
What do you think?
#zec #zcash #ZECUSDT #ZECAnalysis
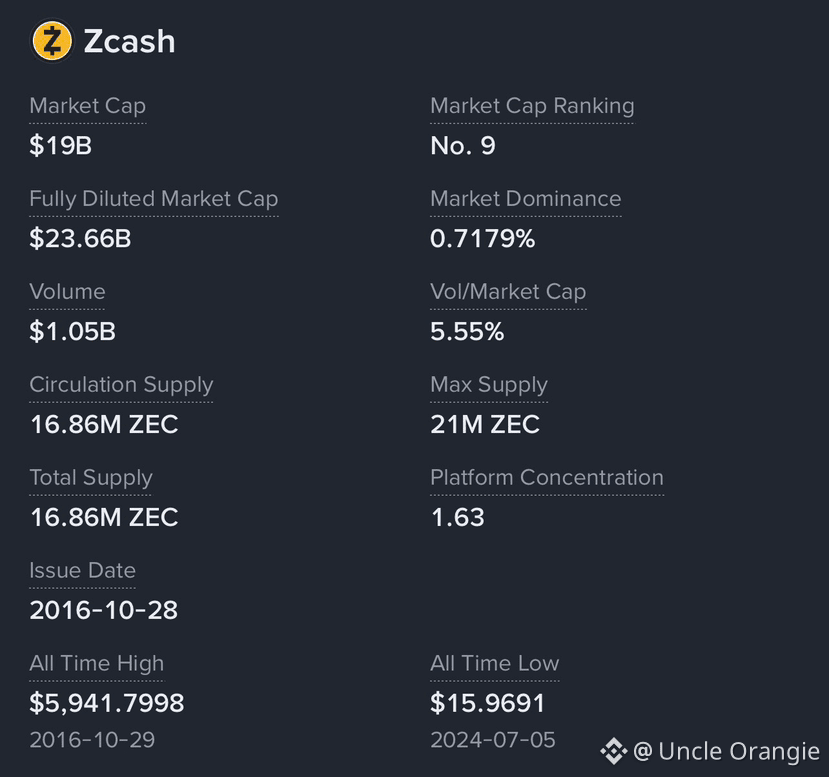
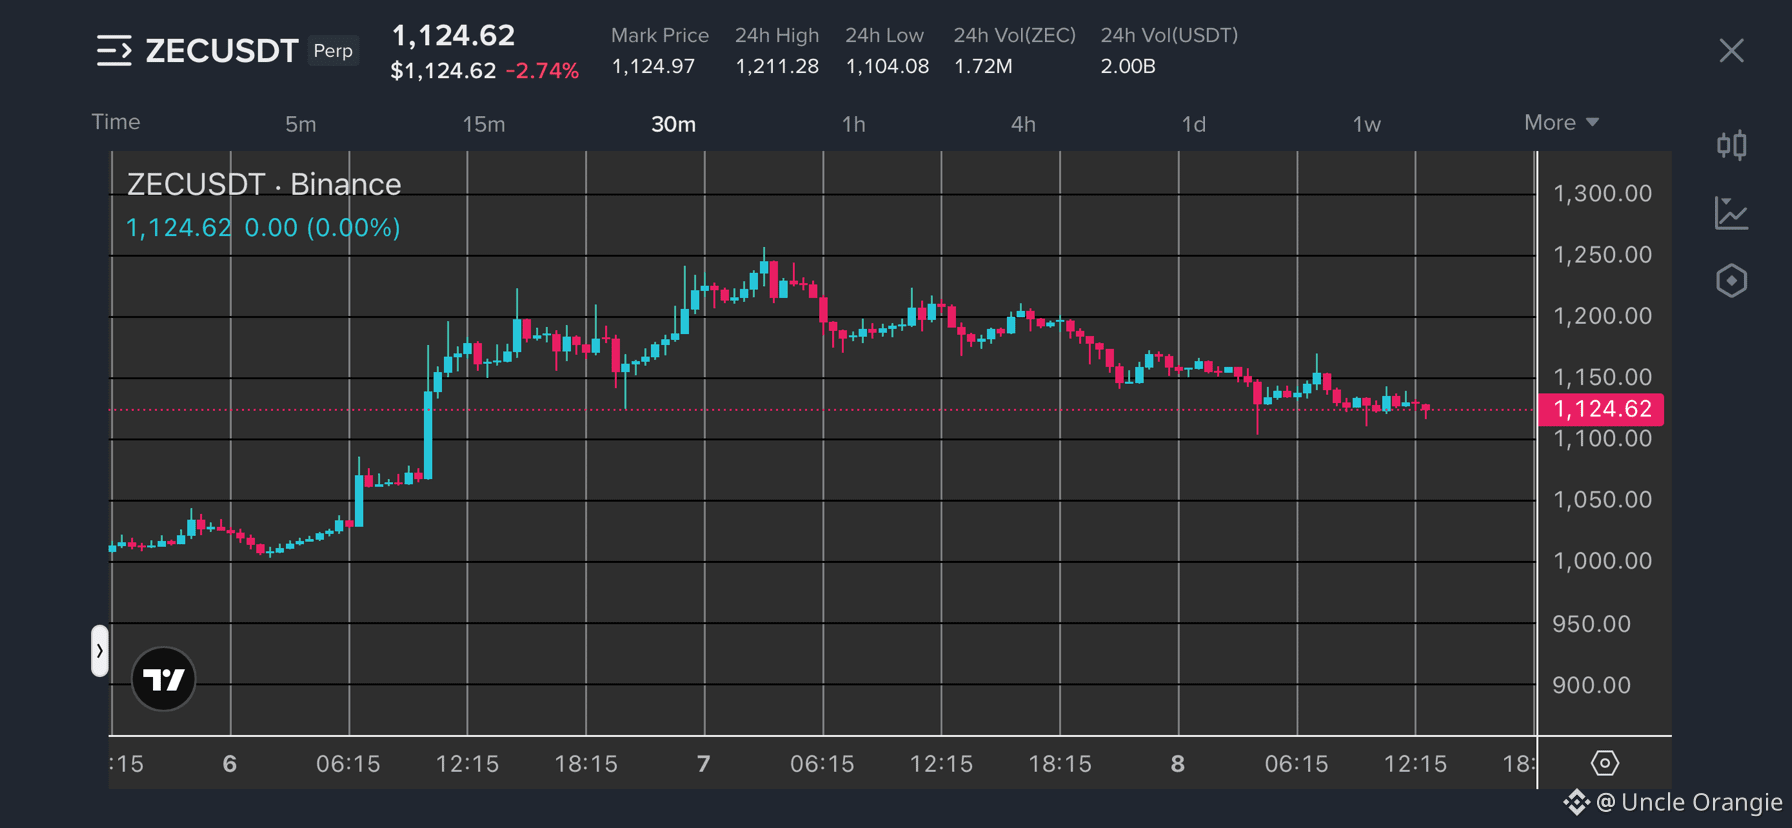
Let’s be honest, calling for $ZEC to reach $2,000 sounds crazy when you look at the price today. But crypto has a habit of making “impossible” targets look possible when momentum, liquidity and market attention align.
ZEC has already shown serious strength, and if the bullish momentum continues, the $2,000 zone could eventually become a realistic target rather than just a wild prediction.
The real question is whether ZEC can keep attracting buyers and break through each major resistance level without a deep correction.
$2,000 ZEC: realistic target or pure madness?
What do you think?
#zec #zcash #ZECUSDT #ZECAnalysis
87

·
--
Bullish
$ZEC Price is now almost half the price of $ETH but still the M. Cap of ETH is still 15x the price of ZEC
$ZEC is about 5x away from its ATH of $5,500
The coin is gradually consolidating
Will it retrace down ward from here or pump more?🤔
Whatever It does ensure you do not miss the move.
Always stay positioned👌
#ZECAnalysis
{future}(ZECUSDT)
{future}(ETHUSDT)
$ZEC Price is now almost half the price of $ETH but still the M. Cap of ETH is still 15x the price of ZEC
$ZEC is about 5x away from its ATH of $5,500
The coin is gradually consolidating
Will it retrace down ward from here or pump more?🤔
Whatever It does ensure you do not miss the move.
Always stay positioned👌
#ZECAnalysis
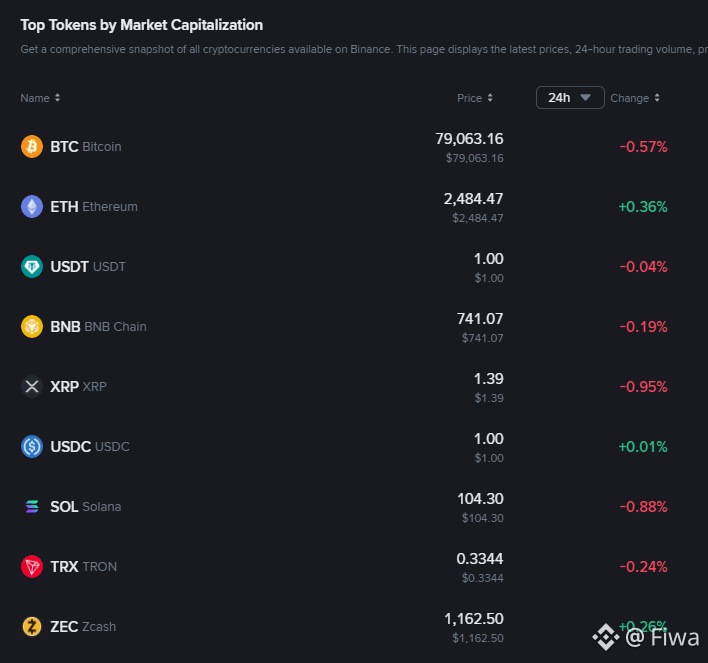
$ZEC is about 5x away from its ATH of $5,500
The coin is gradually consolidating
Will it retrace down ward from here or pump more?🤔
Whatever It does ensure you do not miss the move.
Always stay positioned👌
#ZECAnalysis
Fiwa
·
--
Bullish$MARSCOIN dumped almost 2x from $0.27 in less than 10hrs
There is Uncle $ZEC 😂 making new highs
Even $ARB is on $0.18
MARSCOIN could pick at anytime as the market is currently exploding
What do you think?
#ZECPriceAnalyisis
There is Uncle $ZEC 😂 making new highs
Even $ARB is on $0.18
MARSCOIN could pick at anytime as the market is currently exploding
What do you think?
#ZECPriceAnalyisis
1
1
104

·
--
Bullish
‼️$ZEC /USDT PERP - MOMENTUM WATCH
•24H: ~$1,001 high | ~$296M spot volume
Current structure: Strong upside momentum with ZEC recently ranking among Binance’s most-traded spot assets.
•Bullish continuation: A sustained break above $1,020–$1,050 could put $1,100–$1,200 into focus if volume and open interest continue expanding.
Key level: $1,000 psychological support.
For futures traders, the setup is simple: confirmation above resistance is more important than chasing the initial breakout.
#ZECAnalysis #ZECUSDT #futures #ZEC.每日智能策略
{future}(ZECUSDT)
‼️$ZEC /USDT PERP - MOMENTUM WATCH
•24H: ~$1,001 high | ~$296M spot volume
Current structure: Strong upside momentum with ZEC recently ranking among Binance’s most-traded spot assets.
•Bullish continuation: A sustained break above $1,020–$1,050 could put $1,100–$1,200 into focus if volume and open interest continue expanding.
Key level: $1,000 psychological support.
For futures traders, the setup is simple: confirmation above resistance is more important than chasing the initial breakout.
#ZECAnalysis #ZECUSDT #futures #ZEC.每日智能策略
•24H: ~$1,001 high | ~$296M spot volume
Current structure: Strong upside momentum with ZEC recently ranking among Binance’s most-traded spot assets.
•Bullish continuation: A sustained break above $1,020–$1,050 could put $1,100–$1,200 into focus if volume and open interest continue expanding.
Key level: $1,000 psychological support.
For futures traders, the setup is simple: confirmation above resistance is more important than chasing the initial breakout.
#ZECAnalysis #ZECUSDT #futures #ZEC.每日智能策略
1
130


For $ZEC , the Taker Flow at 0.49x indicates more selling pressure than buying. This makes the buy walls even more significant. I'm watching this battle closely.
🔥 Deep Market Intel
💎 Order Book: Balanced DOM (0.96x)
💎 1H Open Interest: Declining (-)
💎 Whales L/S: 43.8% Long
💎 Taker Flow: 0.79x
💎
🎯 $ZEC MACRO BREAKOUT 📈
💎 Entry Zone: 524.187 - 532.170
💎 🎯 Target 1: 543.517
💎 🎯 Target 2: 554.865
💎 🎯 Target 3: 568.482
💎 🛑 Invalidation (SL): 510.570
🔥 Deep Market Intel
💎 Order Book: Heavy Buy Walls (1.48x)
💎 1H Open Interest: Declining (-)
💎 Whales L/S: 44.3% Long
💎 Taker Flow: 0.49x 📊
#ZECAnalysis #OrderFlow
For $ZEC , the Taker Flow at 0.49x indicates more selling pressure than buying. This makes the buy walls even more significant. I'm watching this battle closely.
🔥 Deep Market Intel
💎 Order Book: Balanced DOM (0.96x)
💎 1H Open Interest: Declining (-)
💎 Whales L/S: 43.8% Long
💎 Taker Flow: 0.79x
💎
🎯 $ZEC MACRO BREAKOUT 📈
💎 Entry Zone: 524.187 - 532.170
💎 🎯 Target 1: 543.517
💎 🎯 Target 2: 554.865
💎 🎯 Target 3: 568.482
💎 🛑 Invalidation (SL): 510.570
🔥 Deep Market Intel
💎 Order Book: Heavy Buy Walls (1.48x)
💎 1H Open Interest: Declining (-)
💎 Whales L/S: 44.3% Long
💎 Taker Flow: 0.49x 📊
#ZECAnalysis #OrderFlow
🔥 Deep Market Intel
💎 Order Book: Balanced DOM (0.96x)
💎 1H Open Interest: Declining (-)
💎 Whales L/S: 43.8% Long
💎 Taker Flow: 0.79x
💎
🎯 $ZEC MACRO BREAKOUT 📈
💎 Entry Zone: 524.187 - 532.170
💎 🎯 Target 1: 543.517
💎 🎯 Target 2: 554.865
💎 🎯 Target 3: 568.482
💎 🛑 Invalidation (SL): 510.570
🔥 Deep Market Intel
💎 Order Book: Heavy Buy Walls (1.48x)
💎 1H Open Interest: Declining (-)
💎 Whales L/S: 44.3% Long
💎 Taker Flow: 0.49x 📊
#ZECAnalysis #OrderFlow
2
413
·
--
#$ZEC
This is an example of patient and precise trading without stoploss✅
#ZECPerp #ShortEntry #SniperMindset #ZECAnalysis #squarecommunity
#$ZEC
This is an example of patient and precise trading without stoploss✅
#ZECPerp #ShortEntry #SniperMindset #ZECAnalysis #squarecommunity
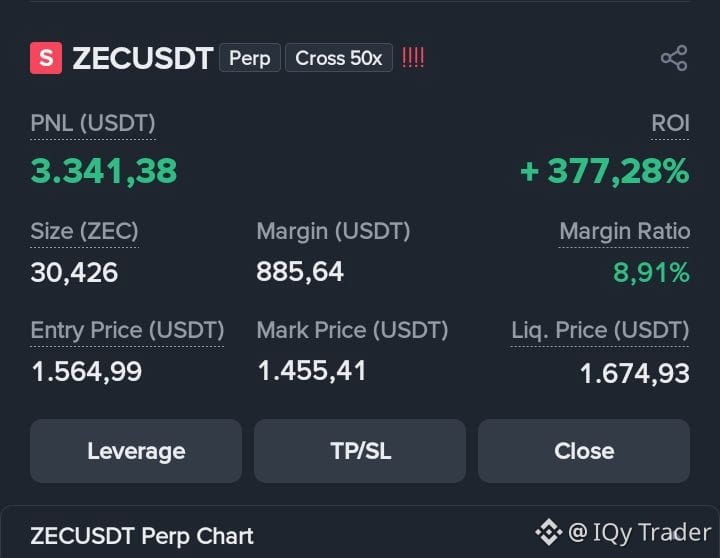
This is an example of patient and precise trading without stoploss✅
#ZECPerp #ShortEntry #SniperMindset #ZECAnalysis #squarecommunity
1
539

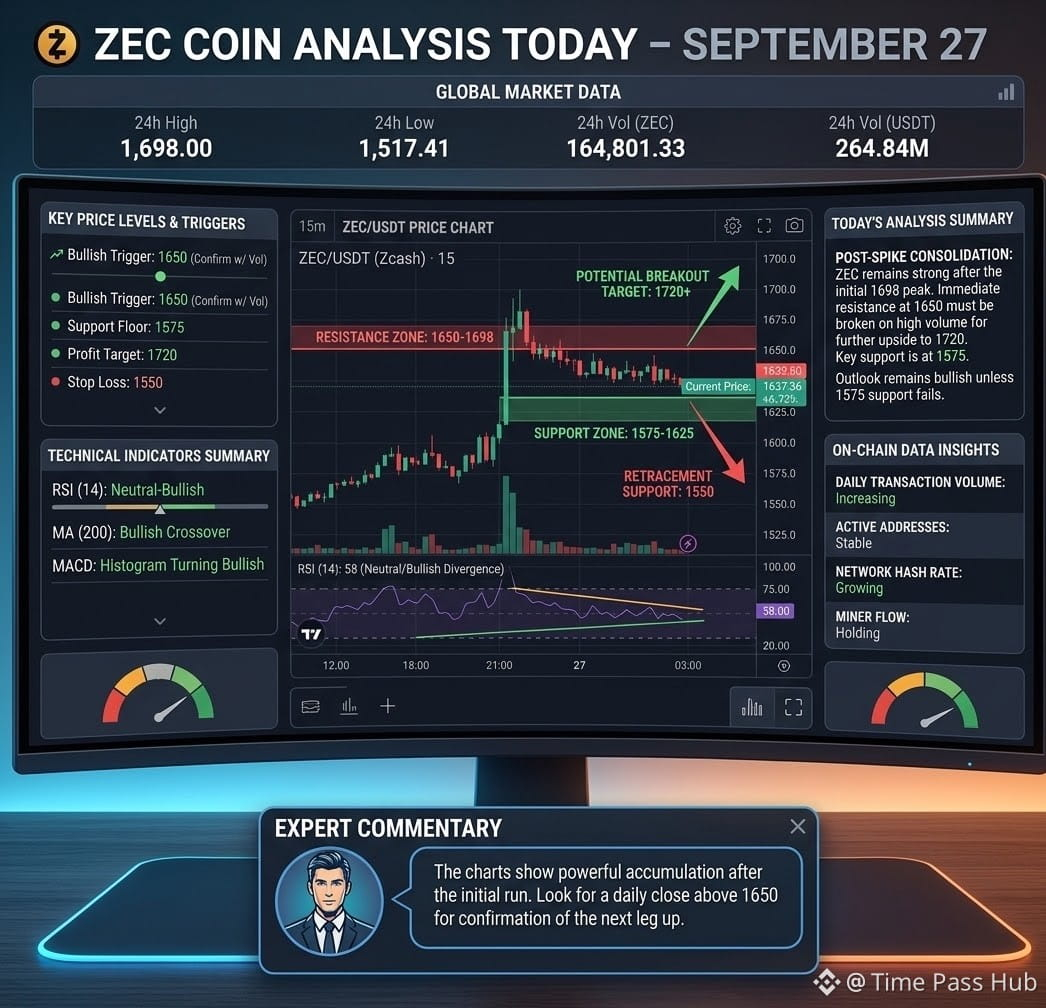
$ZEC /USDT is consolidating around $1,637 after a sharp spike to $1,698 on the 15-minute chart.
Technical Breakdown
* Price Action & Spike: The chart displays a sharp bullish impulse up to $1,698 accompanied by a major volume surge, followed by a pullback and short-term consolidation between $1,635 and $1,650.
* Volume Analysis: The initial volume spike confirms aggressive buying interest, but subsequent volume on the pullbacks has decreased significantly, pointing to low immediate sell pressure.
* Key Levels to Watch:$ZEC
* Immediate Resistance: $1,650 and $1,698 (24h High).
* Immediate Support: $1,625 (local consolidation bottom) and $1,575 (pre-breakout consolidation area).
Outlook & Strategy Scenarios
* Bullish Continuance: A high-volume breakout and hold above $1,650 retests the 24h high at $1,698 with potential targets toward $1,720+.
* Bearish / Pullback: Breaking below $1,625 support signals further retracement back toward the $1,550–$1,575 accumulation zone before finding strong buyers.
(Disclaimer: Technical analysis is for informational purposes only and does not constitute financial advice. Always manage your risk with proper stop-loss orders.)
#zec #ZECAnalysis #MarketAnalysis #analysis #Binance
$ZEC
{spot}(ZECUSDT)
$ZEC /USDT is consolidating around $1,637 after a sharp spike to $1,698 on the 15-minute chart.
Technical Breakdown
* Price Action & Spike: The chart displays a sharp bullish impulse up to $1,698 accompanied by a major volume surge, followed by a pullback and short-term consolidation between $1,635 and $1,650.
* Volume Analysis: The initial volume spike confirms aggressive buying interest, but subsequent volume on the pullbacks has decreased significantly, pointing to low immediate sell pressure.
* Key Levels to Watch:$ZEC
* Immediate Resistance: $1,650 and $1,698 (24h High).
* Immediate Support: $1,625 (local consolidation bottom) and $1,575 (pre-breakout consolidation area).
Outlook & Strategy Scenarios
* Bullish Continuance: A high-volume breakout and hold above $1,650 retests the 24h high at $1,698 with potential targets toward $1,720+.
* Bearish / Pullback: Breaking below $1,625 support signals further retracement back toward the $1,550–$1,575 accumulation zone before finding strong buyers.
(Disclaimer: Technical analysis is for informational purposes only and does not constitute financial advice. Always manage your risk with proper stop-loss orders.)
#zec #ZECAnalysis #MarketAnalysis #analysis #Binance
$ZEC
Technical Breakdown
* Price Action & Spike: The chart displays a sharp bullish impulse up to $1,698 accompanied by a major volume surge, followed by a pullback and short-term consolidation between $1,635 and $1,650.
* Volume Analysis: The initial volume spike confirms aggressive buying interest, but subsequent volume on the pullbacks has decreased significantly, pointing to low immediate sell pressure.
* Key Levels to Watch:$ZEC
* Immediate Resistance: $1,650 and $1,698 (24h High).
* Immediate Support: $1,625 (local consolidation bottom) and $1,575 (pre-breakout consolidation area).
Outlook & Strategy Scenarios
* Bullish Continuance: A high-volume breakout and hold above $1,650 retests the 24h high at $1,698 with potential targets toward $1,720+.
* Bearish / Pullback: Breaking below $1,625 support signals further retracement back toward the $1,550–$1,575 accumulation zone before finding strong buyers.
(Disclaimer: Technical analysis is for informational purposes only and does not constitute financial advice. Always manage your risk with proper stop-loss orders.)
#zec #ZECAnalysis #MarketAnalysis #analysis #Binance
$ZEC
3
202
30D trade $ZEC 24.9 USDT
🚨 $ZEC is sitting at a key decision zone — the next move could get violent.
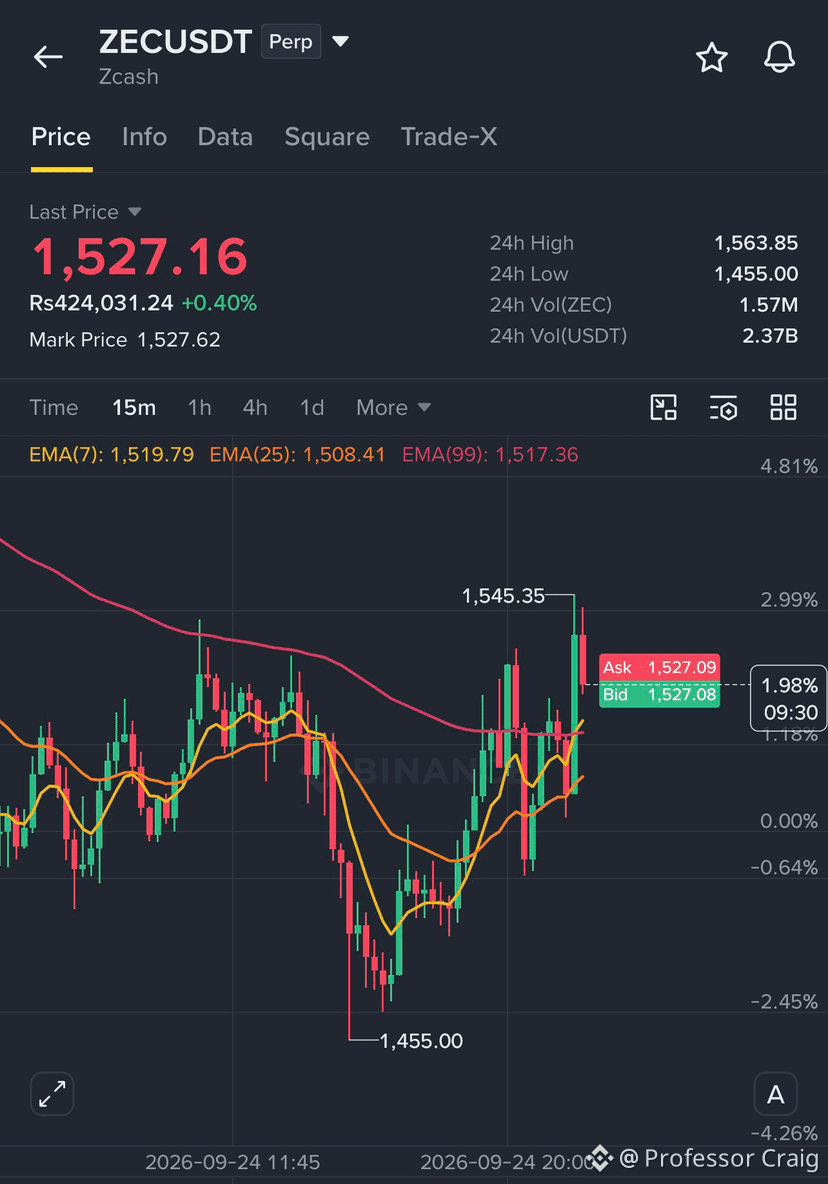
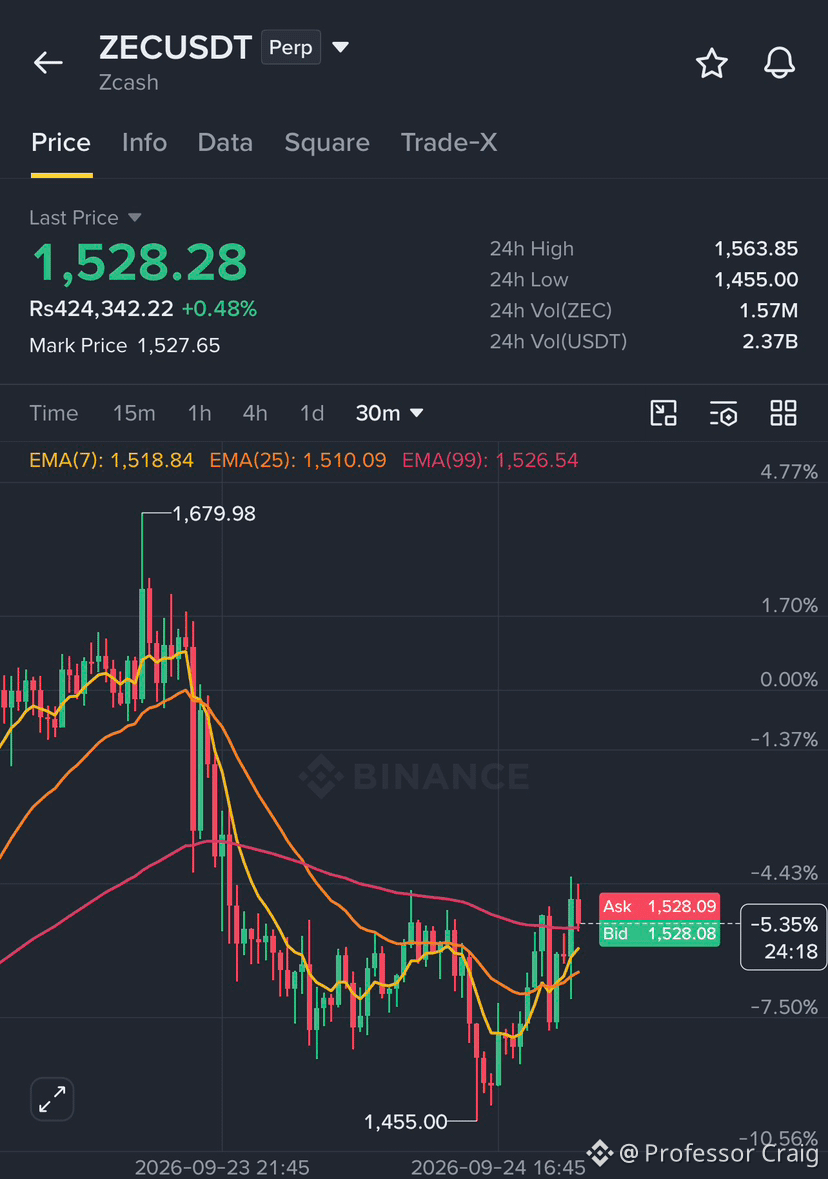
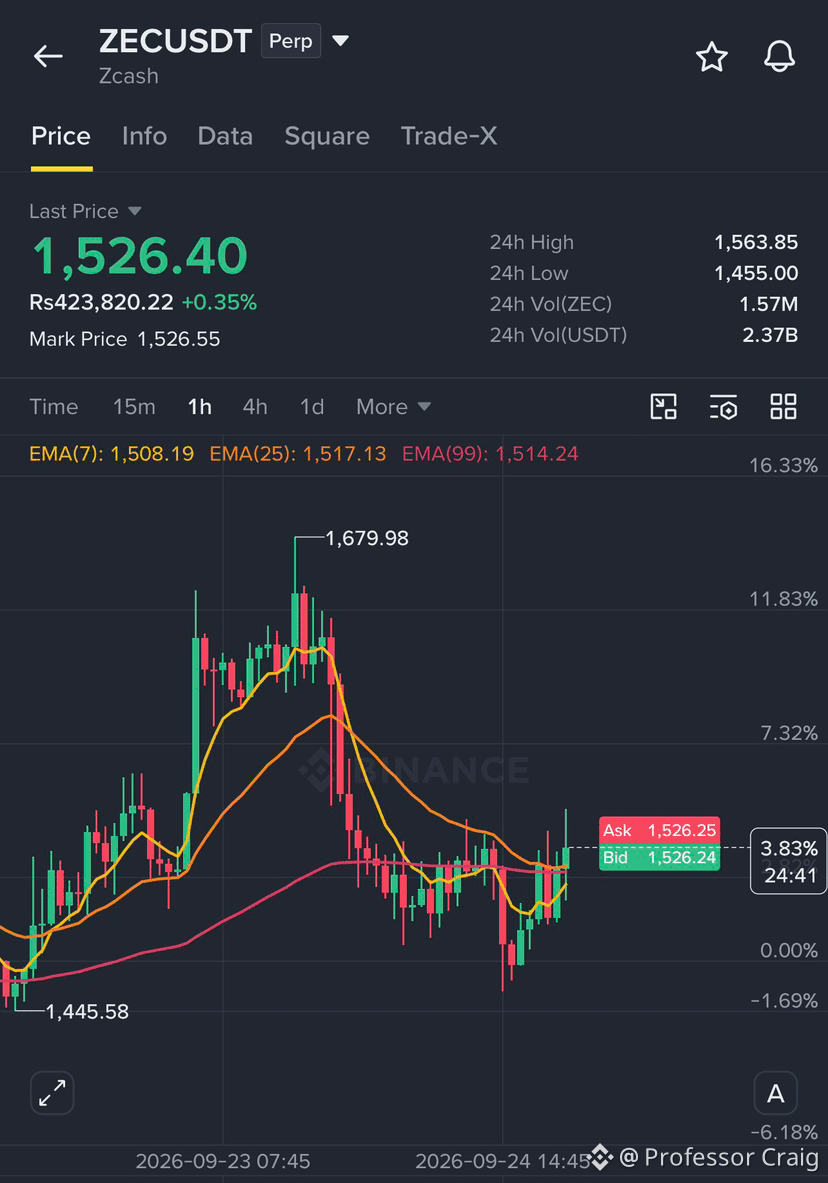
Across the 15M, 30M and 1H charts, ZEC has recovered sharply from the $1,455 area and pushed back above the major EMA cluster. Momentum is improving, but price is now approaching the $1,545–$1,565 resistance region, where sellers have already appeared.
The interesting part is the structure: short-term EMAs are turning upward while the 1H chart is reclaiming its moving-average zone. If buyers can break and hold above $1,545, the previous high around $1,564 becomes the first major level to watch, with the larger $1,680 area sitting above.
But rejection here could send ZEC back toward the EMA support zone before another attempt.
ZECUSDT — Levels I’m watching
Entry zone: $1,520–$1,530
Resistance: $1,545–$1,565
Major upside level: $1,680
Key support: $1,500–$1,515
Invalidation: below the recent structure
Volume and the reaction around $1,545 will matter most. This is where $ZEC needs to prove whether the recovery has enough strength to turn into a bigger continuation.
Watching this one closely. Follow me for more chart breakdowns and trade setups.
{future}(ZECUSDT)
#zecusdt #ZEC.每日智能策略 #ZECAnalysis #zec
🚨 $ZEC is sitting at a key decision zone — the next move could get violent.
Across the 15M, 30M and 1H charts, ZEC has recovered sharply from the $1,455 area and pushed back above the major EMA cluster. Momentum is improving, but price is now approaching the $1,545–$1,565 resistance region, where sellers have already appeared.
The interesting part is the structure: short-term EMAs are turning upward while the 1H chart is reclaiming its moving-average zone. If buyers can break and hold above $1,545, the previous high around $1,564 becomes the first major level to watch, with the larger $1,680 area sitting above.
But rejection here could send ZEC back toward the EMA support zone before another attempt.
ZECUSDT — Levels I’m watching
Entry zone: $1,520–$1,530
Resistance: $1,545–$1,565
Major upside level: $1,680
Key support: $1,500–$1,515
Invalidation: below the recent structure
Volume and the reaction around $1,545 will matter most. This is where $ZEC needs to prove whether the recovery has enough strength to turn into a bigger continuation.
Watching this one closely. Follow me for more chart breakdowns and trade setups.
#zecusdt #ZEC.每日智能策略 #ZECAnalysis #zec
Across the 15M, 30M and 1H charts, ZEC has recovered sharply from the $1,455 area and pushed back above the major EMA cluster. Momentum is improving, but price is now approaching the $1,545–$1,565 resistance region, where sellers have already appeared.
The interesting part is the structure: short-term EMAs are turning upward while the 1H chart is reclaiming its moving-average zone. If buyers can break and hold above $1,545, the previous high around $1,564 becomes the first major level to watch, with the larger $1,680 area sitting above.
But rejection here could send ZEC back toward the EMA support zone before another attempt.
ZECUSDT — Levels I’m watching
Entry zone: $1,520–$1,530
Resistance: $1,545–$1,565
Major upside level: $1,680
Key support: $1,500–$1,515
Invalidation: below the recent structure
Volume and the reaction around $1,545 will matter most. This is where $ZEC needs to prove whether the recovery has enough strength to turn into a bigger continuation.
Watching this one closely. Follow me for more chart breakdowns and trade setups.
#zecusdt #ZEC.每日智能策略 #ZECAnalysis #zec
1
2
124
·
--
Bullish
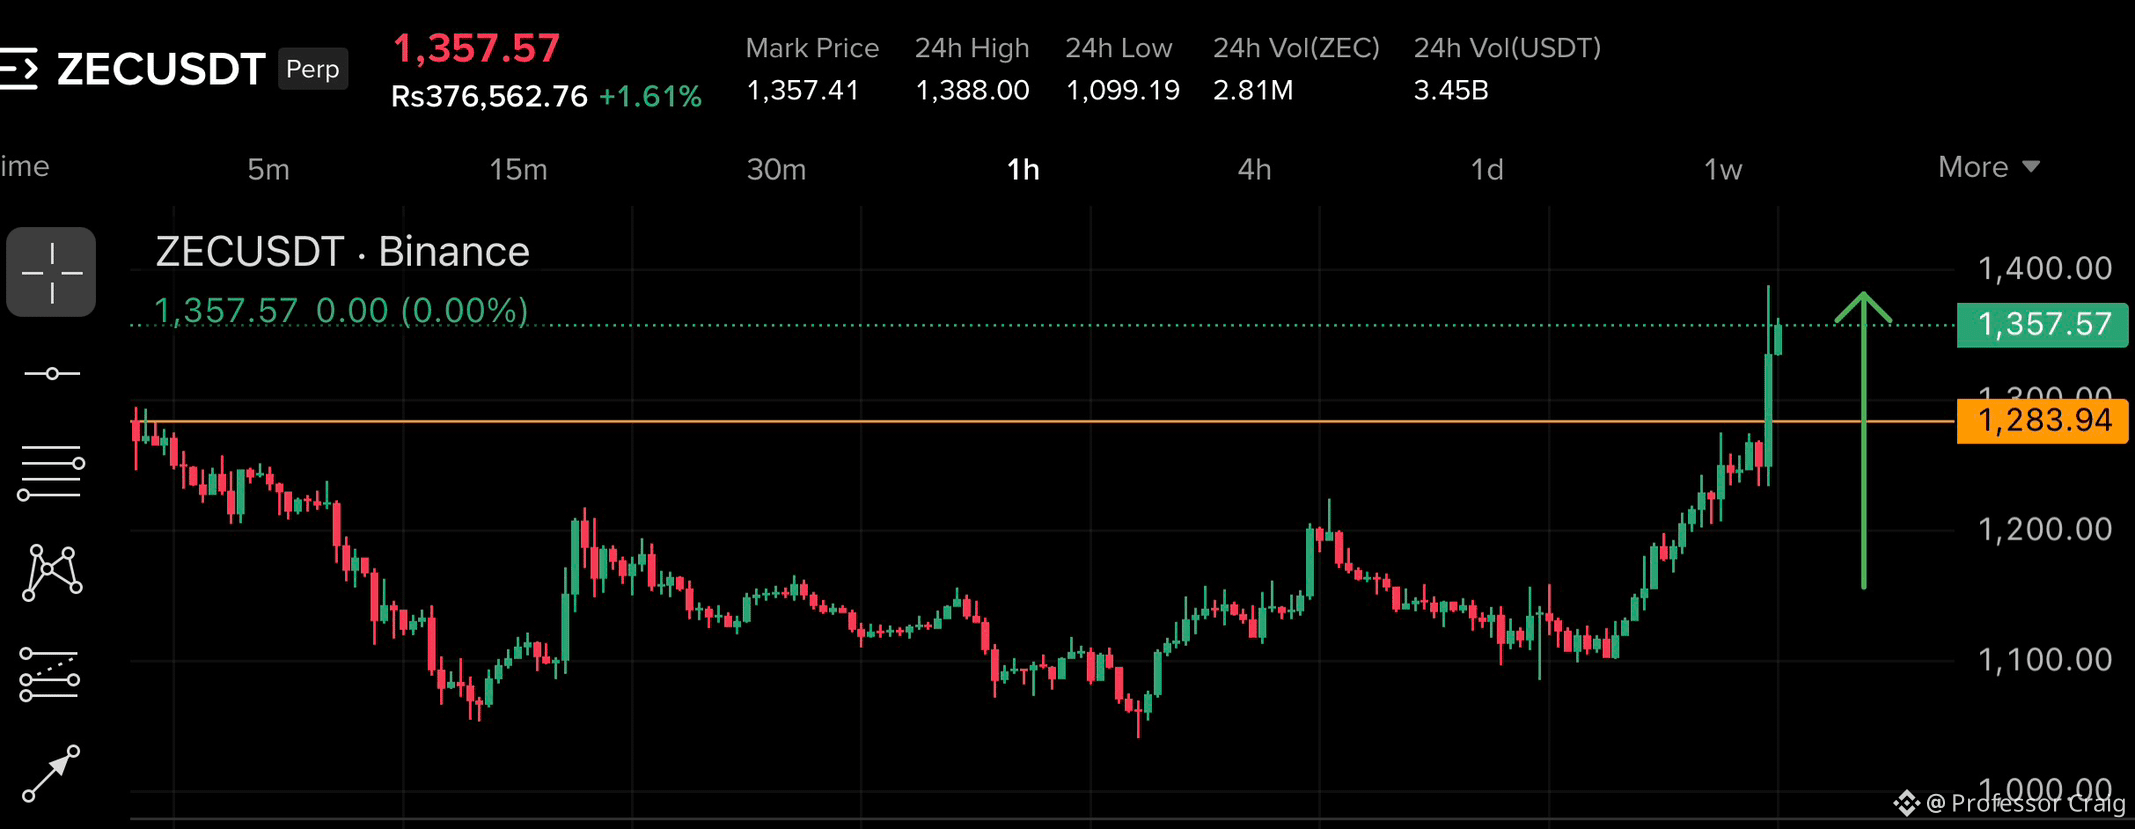
🚨 $ZEC JUST BROKE THE $1,300 WALL 🚨
THE MOVE WE WERE WAITING FOR IS HERE.
NEXT MAJOR ZONE: $2,000
Our previous ZEC post was focused on the third breakout attempt around $1,300, and now the chart has finally pushed through that resistance. ZEC is trading around $1,357, with the latest move reaching $1,388.
The $1,283.94 resistance that was holding price back has now been broken decisively. That level was the key area to watch, and ZEC has now moved well above it.
From around $1,100, ZEC has already built a powerful recovery and the latest breakout adds another major move to the structure. The momentum is clearly visible on the 1H chart, with buyers pushing price through the previous resistance instead of getting rejected again.
Now the attention shifts higher.
$1,400 → $1,500 → $1,700 → $2,000
The previous post was about ZEC preparing for this breakout.
Now we’re watching what happens after the breakout.
$ZEC has officially entered a completely different price zone.
{future}(ZECUSDT)
#zec1300breakout #ZECUSDT #ZECAnalysis #zec #trendinghot
🚨 $ZEC JUST BROKE THE $1,300 WALL 🚨
THE MOVE WE WERE WAITING FOR IS HERE.
NEXT MAJOR ZONE: $2,000
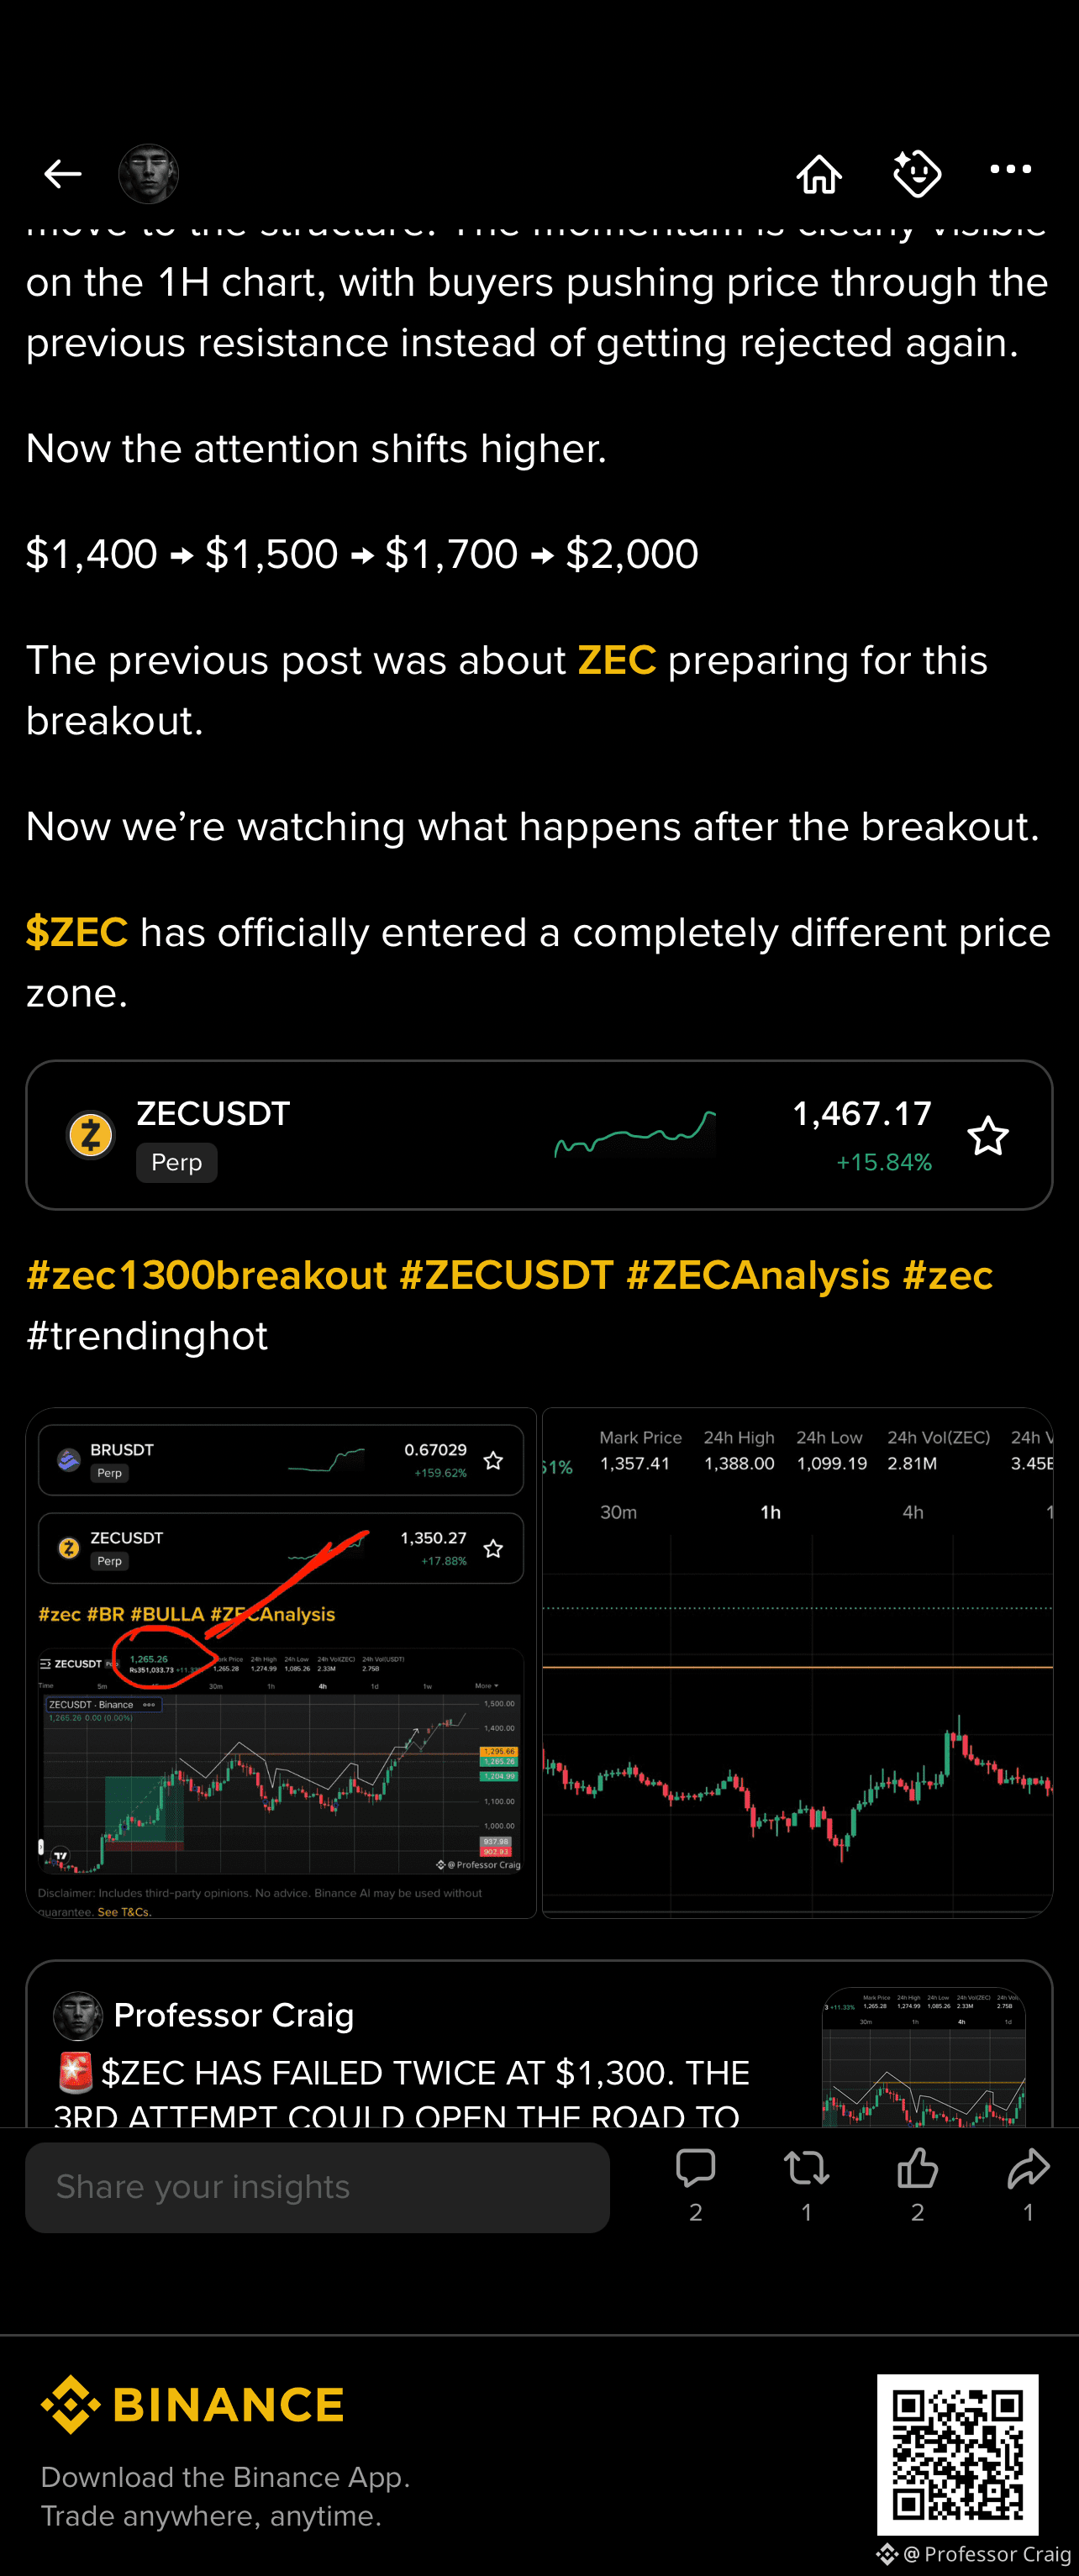
Our previous ZEC post was focused on the third breakout attempt around $1,300, and now the chart has finally pushed through that resistance. ZEC is trading around $1,357, with the latest move reaching $1,388.
The $1,283.94 resistance that was holding price back has now been broken decisively. That level was the key area to watch, and ZEC has now moved well above it.
From around $1,100, ZEC has already built a powerful recovery and the latest breakout adds another major move to the structure. The momentum is clearly visible on the 1H chart, with buyers pushing price through the previous resistance instead of getting rejected again.
Now the attention shifts higher.
$1,400 → $1,500 → $1,700 → $2,000
The previous post was about ZEC preparing for this breakout.
Now we’re watching what happens after the breakout.
$ZEC has officially entered a completely different price zone.
#zec1300breakout #ZECUSDT #ZECAnalysis #zec #trendinghot
THE MOVE WE WERE WAITING FOR IS HERE.
NEXT MAJOR ZONE: $2,000
Our previous ZEC post was focused on the third breakout attempt around $1,300, and now the chart has finally pushed through that resistance. ZEC is trading around $1,357, with the latest move reaching $1,388.
The $1,283.94 resistance that was holding price back has now been broken decisively. That level was the key area to watch, and ZEC has now moved well above it.
From around $1,100, ZEC has already built a powerful recovery and the latest breakout adds another major move to the structure. The momentum is clearly visible on the 1H chart, with buyers pushing price through the previous resistance instead of getting rejected again.
Now the attention shifts higher.
$1,400 → $1,500 → $1,700 → $2,000
The previous post was about ZEC preparing for this breakout.
Now we’re watching what happens after the breakout.
$ZEC has officially entered a completely different price zone.
#zec1300breakout #ZECUSDT #ZECAnalysis #zec #trendinghot
Professor Craig
·
--
Bullish🚨$ZEC HAS FAILED TWICE AT $1,300. THE 3RD ATTEMPT COULD OPEN THE ROAD TO $2,000
$1,204 WAS THE LINE.
$1,295 IS THE NEXT WALL.
$1,400 IS ALREADY ON THE CHART.
It has completely shifted its structure on the 4H chart.
After spending weeks moving between the $1,100 and $1,200 area, buyers finally stepped in with a strong expansion move. Price reclaimed $1,204.99 and continued pushing higher, taking ZEC toward the $1,270 region.
The important part here is the structure. 📌
Every major dip on the right side of the chart has been followed by another push higher. The market is printing higher highs and higher lows, while the previous resistance around $1,204 has now become the key level underneath the current price.
The next major battle is sitting at $1,295.66.
A clean move through that level puts the chart directly into the $1,300+ zone, with the previous projected move pointing toward $1,400. Above that, the chart has room toward the $1,500 psychological level.
This is no longer the same, structure that was stuck around $1,100.
$1,204 has been reclaimed.
$1,295 is being attacked.
$1,400 is the next major target on the chart.
It is moving back into price territory where momentum can become very aggressive.
The $1,200 zone started the move. Now $1,300 is standing in its way.
Guys, Keep an eye on $BR & $BULLA too, these tokens are very hot right now.👀
#zec #BR #BULLA #ZECAnalysis
$1,204 WAS THE LINE.
$1,295 IS THE NEXT WALL.
$1,400 IS ALREADY ON THE CHART.
It has completely shifted its structure on the 4H chart.
After spending weeks moving between the $1,100 and $1,200 area, buyers finally stepped in with a strong expansion move. Price reclaimed $1,204.99 and continued pushing higher, taking ZEC toward the $1,270 region.
The important part here is the structure. 📌
Every major dip on the right side of the chart has been followed by another push higher. The market is printing higher highs and higher lows, while the previous resistance around $1,204 has now become the key level underneath the current price.
The next major battle is sitting at $1,295.66.
A clean move through that level puts the chart directly into the $1,300+ zone, with the previous projected move pointing toward $1,400. Above that, the chart has room toward the $1,500 psychological level.
This is no longer the same, structure that was stuck around $1,100.
$1,204 has been reclaimed.
$1,295 is being attacked.
$1,400 is the next major target on the chart.
It is moving back into price territory where momentum can become very aggressive.
The $1,200 zone started the move. Now $1,300 is standing in its way.
Guys, Keep an eye on $BR & $BULLA too, these tokens are very hot right now.👀
#zec #BR #BULLA #ZECAnalysis
2
1
2
263
Log in to explore more content
Join global crypto users on Binance Square
⚡️ Get latest and useful information about crypto.
💬 Trusted by the world’s largest crypto exchange.
👍 Discover real insights from verified creators.
Email / Phone number
Trending Topics
1
#ADAGains10%Above$0.27
10,426 views
153 Discussing
2
#ETHUp70%InQ3ButLiquidityFalls
117,270 views
930 Discussing
3
#EthStakingExitQueueHits2026High
42,459 views
677 Discussing
4
#FedOctoberHoldOdds82.3%
41,055 views
638 Discussing
5
#Nikkei225Jumps2.5%ToThreeMonthHigh
71,465 views
1,009 Discussing
6
#CircleMints$2.75BUSDCOnSolanaIn7Days
1,438 views
39 Discussing
7
#DriftHackVictimsBeginClaims
161,056 views
1,667 Discussing
8
#SolanaTokenizedStockVolumeTops$4.4BInSeptember
12,556 views
130 Discussing
9
#BitcoinSpotETFsDraw$6.34BInflowsInQ3
51,437 views
261 Discussing
10
#EthereumValidatorExitQueueJumps392%
292,309 views
2,530 Discussing