
#trxanalysis
trxanalysis
33,247 views
97 Discussing
Hot
Latest

Article
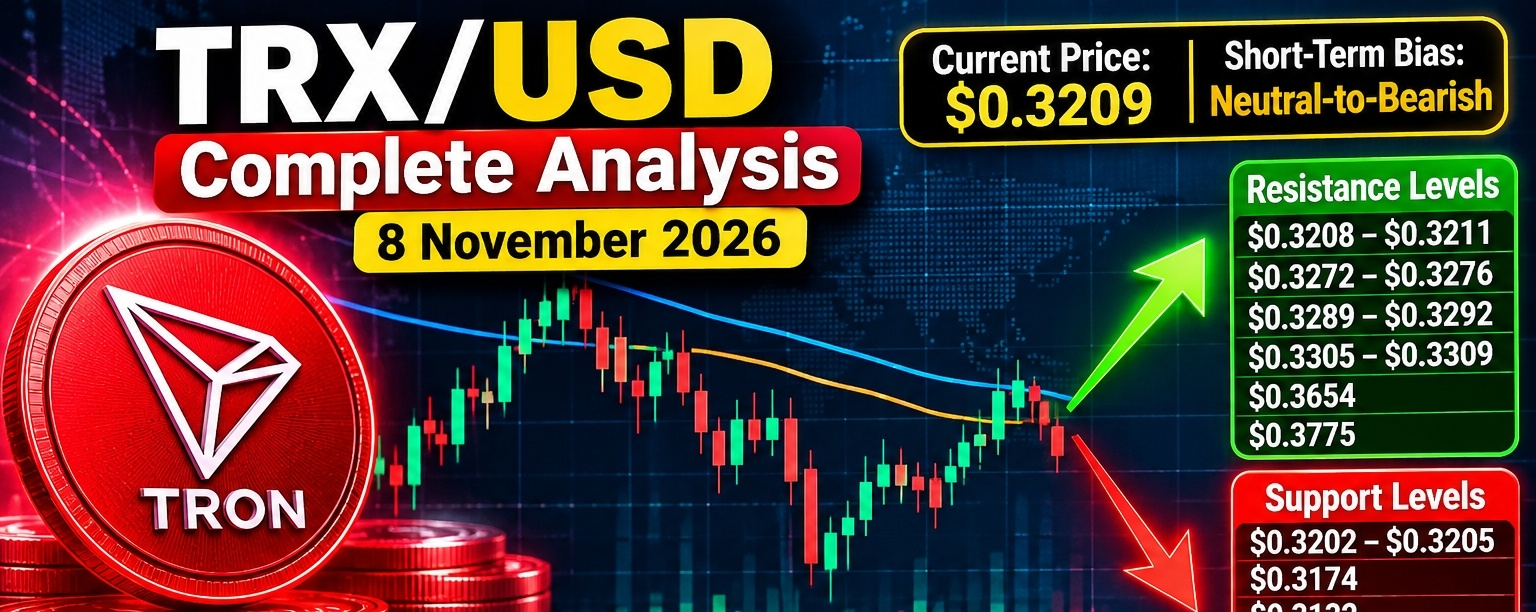
TRX/USD Complete Analysis — 8 November 2026$TRX /USD Complete Analysis — 8 November 2026
Current price: approximately $0.3209.
Short-term bias: 🟠 Neutral-to-bearish
Key point: $TRX is holding just above $0.3202–$0.3205, but the 4H and daily market structures remain bearish.
📊 Technical indicators
{spot}(TRXUSDT)
- RSI (14): ~58–62 → bullish momentum, but not yet overbought.
- MACD: Buy signal.
- ADX: ~34–37 → trend has reasonable strength.
- MA20: around $0.3201–$0.3203
- MA50: around $0.3192–$0.3197
- MA100: around $0.3193–$0.3196
- MA200: around $0.3180, although the 200-EMA is near $0.3207.
The interesting part is the conflict between indicators and structure: short-term indicators are mostly positive, while the 4H/daily structure remains bearish. That means confirmation is important before chasing a breakout.
🟢 Important support levels
Level Importance
$0.3202–$0.3205 Immediate support
$0.3174 Strong daily support
$0.3132 Weekly support
$0.3020 Major downside support
$0.2890 Major lower support
The $0.3202–$0.3205 zone is the immediate battleground. A failure there would make $0.3174 the next important test.
🔴 Resistance levels
Level Importance
$0.3208–$0.3211 Immediate resistance
$0.3272–$0.3276 Major 4H resistance
$0.3289–$0.3292 Strong resistance
$0.3305–$0.3309 Breakout zone
$0.3654 Major higher resistance
$0.3775 Major swing high
The first real bullish test is $0.3272–$0.3276. A clean break above that area would improve the structure considerably.
📈 Bullish scenario
If $TRX continues holding $0.3202–$0.3205 and breaks $0.3276, momentum could extend toward:
$0.3290 → $0.3305 → $0.3350 → $0.3450
A sustained move above $0.3309 would be a stronger confirmation that the bearish 4H structure is reversing.
For a larger trend reversal, $0.3654 is the major level to watch.
📉 Bearish scenario
If TRX loses $0.3202, the next targets become:
$0.3174 → $0.3132 → $0.3020 → $0.2890
A daily close below $0.3132 would substantially strengthen the bearish case.
🏦 Fundamental outlook
TRON's fundamentals remain relatively strong. Q3 2026 data showed approximately $2.21 trillion in stablecoin settlement, around 3.7 million daily active addresses, and more than $92.7 billion of USDT on TRON at its Q3 peak. TRON also gained additional institutional access through the Canary Staked TRX ETF, launched in September.
This gives TRX a stronger utility narrative than price action alone suggests. However, strong network activity does not automatically mean the token must rise, so technical confirmation remains important.
🎯 Trading setup
Aggressive long:
$0.3205–$0.3210 after a confirmed bullish reaction
Targets: $0.3275 → $0.3305 → $0.3350
Safer long:
Wait for a breakout above $0.3276, preferably followed by a successful retest.
Bearish setup:
Confirmed break below $0.3202
Targets: $0.3174 → $0.3132 → $0.3020
Bullish invalidation: sustained weakness below $0.3174.
Bearish invalidation: strong breakout and acceptance above $0.3309.
🔥 Overall view
Short term: 🟠 Neutral/Bearish
Medium term: 🟠 Neutral-to-bullish if $0.3174 holds
Long term: 🟢 Fundamentally constructive
Most important levels:
➡️ Above $0.3276 = bullish momentum
➡️ Above $0.3309 = stronger breakout confirmation
➡️ Below $0.3202 = downside risk increases
➡️ Below $0.3132 = bearish structure becomes much stronger
This is technical market analysis, not financial advice. Crypto prices can move rapidly, so use appropriate risk management.
#TRX #TRX/USDT❤️ #TrendingPredictions #trxanalysis
TRX/USD Complete Analysis — 8 November 2026
$TRX /USD Complete Analysis — 8 November 2026
Current price: approximately $0.3209.
Short-term bias: 🟠 Neutral-to-bearish
Key point: $TRX is holding just above $0.3202–$0.3205, but the 4H and daily market structures remain bearish.
📊 Technical indicators
- RSI (14): ~58–62 → bullish momentum, but not yet overbought.
- MACD: Buy signal.
- ADX: ~34–37 → trend has reasonable strength.
- MA20: around $0.3201–$0.3203
- MA50: around $0.3192–$0.3197
- MA100: around $0.3193–$0.3196
- MA200: around $0.3180, although the 200-EMA is near $0.3207.
The interesting part is the conflict between indicators and structure: short-term indicators are mostly positive, while the 4H/daily structure remains bearish. That means confirmation is important before chasing a breakout.
🟢 Important support levels
Level Importance
$0.3202–$0.3205 Immediate support
$0.3174 Strong daily support
$0.3132 Weekly support
$0.3020 Major downside support
$0.2890 Major lower support
The $0.3202–$0.3205 zone is the immediate battleground. A failure there would make $0.3174 the next important test.
🔴 Resistance levels
Level Importance
$0.3208–$0.3211 Immediate resistance
$0.3272–$0.3276 Major 4H resistance
$0.3289–$0.3292 Strong resistance
$0.3305–$0.3309 Breakout zone
$0.3654 Major higher resistance
$0.3775 Major swing high
The first real bullish test is $0.3272–$0.3276. A clean break above that area would improve the structure considerably.
📈 Bullish scenario
If $TRX continues holding $0.3202–$0.3205 and breaks $0.3276, momentum could extend toward:
$0.3290 → $0.3305 → $0.3350 → $0.3450
A sustained move above $0.3309 would be a stronger confirmation that the bearish 4H structure is reversing.
For a larger trend reversal, $0.3654 is the major level to watch.
📉 Bearish scenario
If TRX loses $0.3202, the next targets become:
$0.3174 → $0.3132 → $0.3020 → $0.2890
A daily close below $0.3132 would substantially strengthen the bearish case.
🏦 Fundamental outlook
TRON's fundamentals remain relatively strong. Q3 2026 data showed approximately $2.21 trillion in stablecoin settlement, around 3.7 million daily active addresses, and more than $92.7 billion of USDT on TRON at its Q3 peak. TRON also gained additional institutional access through the Canary Staked TRX ETF, launched in September.
This gives TRX a stronger utility narrative than price action alone suggests. However, strong network activity does not automatically mean the token must rise, so technical confirmation remains important.
🎯 Trading setup
Aggressive long:
$0.3205–$0.3210 after a confirmed bullish reaction
Targets: $0.3275 → $0.3305 → $0.3350
Safer long:
Wait for a breakout above $0.3276, preferably followed by a successful retest.
Bearish setup:
Confirmed break below $0.3202
Targets: $0.3174 → $0.3132 → $0.3020
Bullish invalidation: sustained weakness below $0.3174.
Bearish invalidation: strong breakout and acceptance above $0.3309.
🔥 Overall view
Short term: 🟠 Neutral/Bearish
Medium term: 🟠 Neutral-to-bullish if $0.3174 holds
Long term: 🟢 Fundamentally constructive
Most important levels:
➡️ Above $0.3276 = bullish momentum
➡️ Above $0.3309 = stronger breakout confirmation
➡️ Below $0.3202 = downside risk increases
➡️ Below $0.3132 = bearish structure becomes much stronger
This is technical market analysis, not financial advice. Crypto prices can move rapidly, so use appropriate risk management.
#TRX #TRX/USDT❤️ #TrendingPredictions #trxanalysis
Current price: approximately $0.3209.
Short-term bias: 🟠 Neutral-to-bearish
Key point: $TRX is holding just above $0.3202–$0.3205, but the 4H and daily market structures remain bearish.
📊 Technical indicators
- RSI (14): ~58–62 → bullish momentum, but not yet overbought.
- MACD: Buy signal.
- ADX: ~34–37 → trend has reasonable strength.
- MA20: around $0.3201–$0.3203
- MA50: around $0.3192–$0.3197
- MA100: around $0.3193–$0.3196
- MA200: around $0.3180, although the 200-EMA is near $0.3207.
The interesting part is the conflict between indicators and structure: short-term indicators are mostly positive, while the 4H/daily structure remains bearish. That means confirmation is important before chasing a breakout.
🟢 Important support levels
Level Importance
$0.3202–$0.3205 Immediate support
$0.3174 Strong daily support
$0.3132 Weekly support
$0.3020 Major downside support
$0.2890 Major lower support
The $0.3202–$0.3205 zone is the immediate battleground. A failure there would make $0.3174 the next important test.
🔴 Resistance levels
Level Importance
$0.3208–$0.3211 Immediate resistance
$0.3272–$0.3276 Major 4H resistance
$0.3289–$0.3292 Strong resistance
$0.3305–$0.3309 Breakout zone
$0.3654 Major higher resistance
$0.3775 Major swing high
The first real bullish test is $0.3272–$0.3276. A clean break above that area would improve the structure considerably.
📈 Bullish scenario
If $TRX continues holding $0.3202–$0.3205 and breaks $0.3276, momentum could extend toward:
$0.3290 → $0.3305 → $0.3350 → $0.3450
A sustained move above $0.3309 would be a stronger confirmation that the bearish 4H structure is reversing.
For a larger trend reversal, $0.3654 is the major level to watch.
📉 Bearish scenario
If TRX loses $0.3202, the next targets become:
$0.3174 → $0.3132 → $0.3020 → $0.2890
A daily close below $0.3132 would substantially strengthen the bearish case.
🏦 Fundamental outlook
TRON's fundamentals remain relatively strong. Q3 2026 data showed approximately $2.21 trillion in stablecoin settlement, around 3.7 million daily active addresses, and more than $92.7 billion of USDT on TRON at its Q3 peak. TRON also gained additional institutional access through the Canary Staked TRX ETF, launched in September.
This gives TRX a stronger utility narrative than price action alone suggests. However, strong network activity does not automatically mean the token must rise, so technical confirmation remains important.
🎯 Trading setup
Aggressive long:
$0.3205–$0.3210 after a confirmed bullish reaction
Targets: $0.3275 → $0.3305 → $0.3350
Safer long:
Wait for a breakout above $0.3276, preferably followed by a successful retest.
Bearish setup:
Confirmed break below $0.3202
Targets: $0.3174 → $0.3132 → $0.3020
Bullish invalidation: sustained weakness below $0.3174.
Bearish invalidation: strong breakout and acceptance above $0.3309.
🔥 Overall view
Short term: 🟠 Neutral/Bearish
Medium term: 🟠 Neutral-to-bullish if $0.3174 holds
Long term: 🟢 Fundamentally constructive
Most important levels:
➡️ Above $0.3276 = bullish momentum
➡️ Above $0.3309 = stronger breakout confirmation
➡️ Below $0.3202 = downside risk increases
➡️ Below $0.3132 = bearish structure becomes much stronger
This is technical market analysis, not financial advice. Crypto prices can move rapidly, so use appropriate risk management.
#TRX #TRX/USDT❤️ #TrendingPredictions #trxanalysis
9


·
--
The $TRX setup has me cautious with those heavy sell walls, but I'm also monitoring $SPCXB for any correlated movements.
🔥 Deep Market Intel
💎 Order Book: Heavy Sell Walls (0.65x)
💎 1H Open Interest: Declining (-)
💎 Whales L/S: 40.8% Long
💎 Taker Flow: 0.42x
💎
🎯 $TRX MACRO BREAKOUT 📈
💎 Entry Zone: 0.31057 - 0.31530
💎 🎯 Target 1: 0.31845
💎 🎯 Target 2: 0.32161
💎 🎯 Target 3: 0.32539
💎 🛑 Invalidation (SL): 0.30679
🔥 Deep Market Intel
💎 Order Book: Heavy Sell Walls (0.30x)
💎 1H Open Interest: Declining (-)
💎 Whales L/S: 61.9% Long
💎 Taker Flow: 1.03x 📊
#TRXAnalysis #SPCXB
The $TRX setup has me cautious with those heavy sell walls, but I'm also monitoring $SPCXB for any correlated movements.
🔥 Deep Market Intel
💎 Order Book: Heavy Sell Walls (0.65x)
💎 1H Open Interest: Declining (-)
💎 Whales L/S: 40.8% Long
💎 Taker Flow: 0.42x
💎
🎯 $TRX MACRO BREAKOUT 📈
💎 Entry Zone: 0.31057 - 0.31530
💎 🎯 Target 1: 0.31845
💎 🎯 Target 2: 0.32161
💎 🎯 Target 3: 0.32539
💎 🛑 Invalidation (SL): 0.30679
🔥 Deep Market Intel
💎 Order Book: Heavy Sell Walls (0.30x)
💎 1H Open Interest: Declining (-)
💎 Whales L/S: 61.9% Long
💎 Taker Flow: 1.03x 📊
#TRXAnalysis #SPCXB
🔥 Deep Market Intel
💎 Order Book: Heavy Sell Walls (0.65x)
💎 1H Open Interest: Declining (-)
💎 Whales L/S: 40.8% Long
💎 Taker Flow: 0.42x
💎
🎯 $TRX MACRO BREAKOUT 📈
💎 Entry Zone: 0.31057 - 0.31530
💎 🎯 Target 1: 0.31845
💎 🎯 Target 2: 0.32161
💎 🎯 Target 3: 0.32539
💎 🛑 Invalidation (SL): 0.30679
🔥 Deep Market Intel
💎 Order Book: Heavy Sell Walls (0.30x)
💎 1H Open Interest: Declining (-)
💎 Whales L/S: 61.9% Long
💎 Taker Flow: 1.03x 📊
#TRXAnalysis #SPCXB
2
600

🔥 $TRX - Where Are We Now?
TRON is currently sitting at $0.3692 zone.
TRX keeps delivering! TRON processes millions of transactions daily with ultra-low fees. One of the most used blockchains in the world! 💪
📌 Key Levels to Watch:
Support: $0.34 - $0.36 zone 👀
Resistance: $0.40 - $0.42 zone
Do you think $TRX will hit $0.50 soon?
Drop your thoughts in the comments! 👇🚀
$TRX $BTC $ETH
#TRON #TRX #Crypto #BinanceSquare #trxanalysis
🔥 $TRX - Where Are We Now?
TRON is currently sitting at $0.3692 zone.
TRX keeps delivering! TRON processes millions of transactions daily with ultra-low fees. One of the most used blockchains in the world! 💪
📌 Key Levels to Watch:
Support: $0.34 - $0.36 zone 👀
Resistance: $0.40 - $0.42 zone
Do you think $TRX will hit $0.50 soon?
Drop your thoughts in the comments! 👇🚀
$TRX $BTC $ETH
#TRON #TRX #Crypto #BinanceSquare #trxanalysis
TRON is currently sitting at $0.3692 zone.
TRX keeps delivering! TRON processes millions of transactions daily with ultra-low fees. One of the most used blockchains in the world! 💪
📌 Key Levels to Watch:
Support: $0.34 - $0.36 zone 👀
Resistance: $0.40 - $0.42 zone
Do you think $TRX will hit $0.50 soon?
Drop your thoughts in the comments! 👇🚀
$TRX $BTC $ETH
#TRON #TRX #Crypto #BinanceSquare #trxanalysis
34

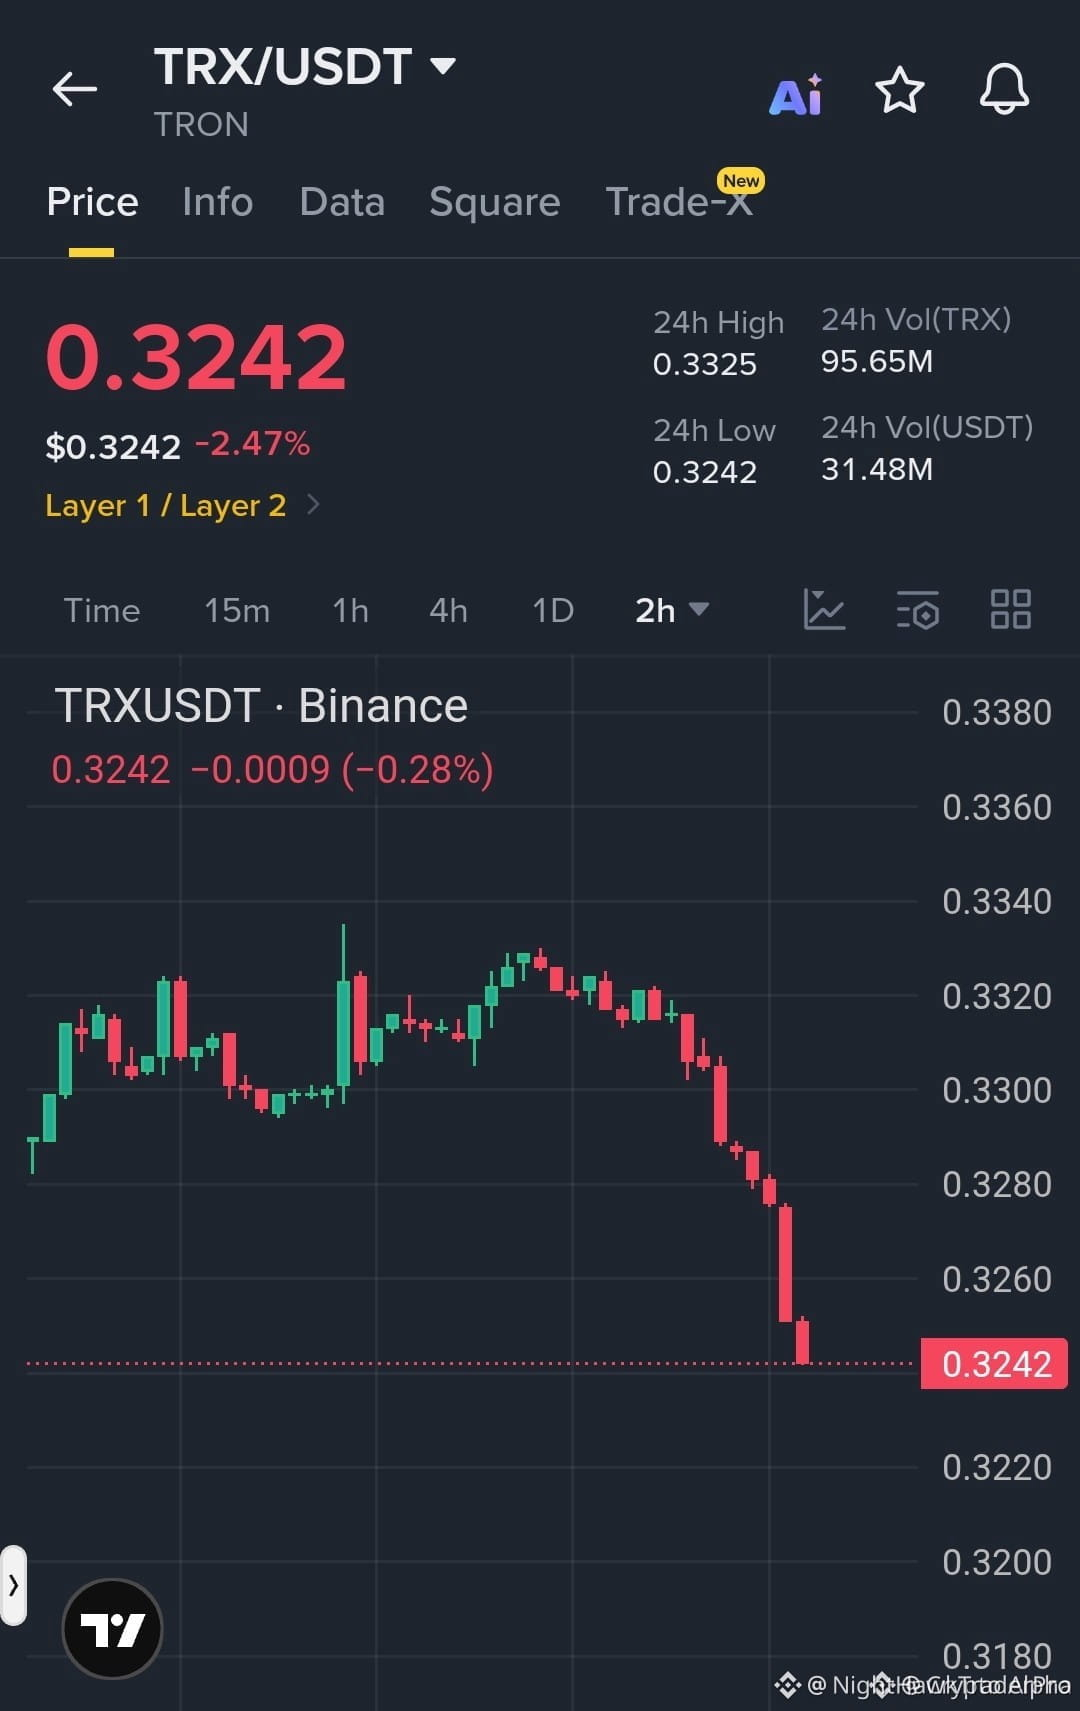
$TRX BREAKING DOWN — SELLERS ARE DROPPING THE HAMMER 💥🔴
Entry: $0.3240 – $0.3250 ⚡
Target 1: $0.3200 🎯
Target 2: $0.3175 💥
Stop Loss: $0.3275 ⚠️
📉 The structure is crumbling in real time. Each rejection at $0.3275 has been sharper, with volume surging on every red candle. 🐻 Sellers are stacking bids below—this isn't a dip, it’s a liquidity grab into the void. 🔴 Daily momentum flipped negative, and lower highs are stacking like dominos.
💡 The risk-to-reward on this breakdown is tight if you time the entry near resistance. Bears are treating every bounce as a gift. 💬 Are you shorting the retest or waiting for a full breakdown confirmation below $0.3200? 👇
⚠️ Not financial advice. Always manage your risk. 🛡️
🏷️ #TRX #ShortSetup #Breakdown #Crypto #TRXAnalysis
🎯 🐻
$TRX BREAKING DOWN — SELLERS ARE DROPPING THE HAMMER 💥🔴
Entry: $0.3240 – $0.3250 ⚡
Target 1: $0.3200 🎯
Target 2: $0.3175 💥
Stop Loss: $0.3275 ⚠️
📉 The structure is crumbling in real time. Each rejection at $0.3275 has been sharper, with volume surging on every red candle. 🐻 Sellers are stacking bids below—this isn't a dip, it’s a liquidity grab into the void. 🔴 Daily momentum flipped negative, and lower highs are stacking like dominos.
💡 The risk-to-reward on this breakdown is tight if you time the entry near resistance. Bears are treating every bounce as a gift. 💬 Are you shorting the retest or waiting for a full breakdown confirmation below $0.3200? 👇
⚠️ Not financial advice. Always manage your risk. 🛡️
🏷️ #TRX #ShortSetup #Breakdown #Crypto #TRXAnalysis
🎯 🐻
Entry: $0.3240 – $0.3250 ⚡
Target 1: $0.3200 🎯
Target 2: $0.3175 💥
Stop Loss: $0.3275 ⚠️
📉 The structure is crumbling in real time. Each rejection at $0.3275 has been sharper, with volume surging on every red candle. 🐻 Sellers are stacking bids below—this isn't a dip, it’s a liquidity grab into the void. 🔴 Daily momentum flipped negative, and lower highs are stacking like dominos.
💡 The risk-to-reward on this breakdown is tight if you time the entry near resistance. Bears are treating every bounce as a gift. 💬 Are you shorting the retest or waiting for a full breakdown confirmation below $0.3200? 👇
⚠️ Not financial advice. Always manage your risk. 🛡️
🏷️ #TRX #ShortSetup #Breakdown #Crypto #TRXAnalysis
🎯 🐻
40

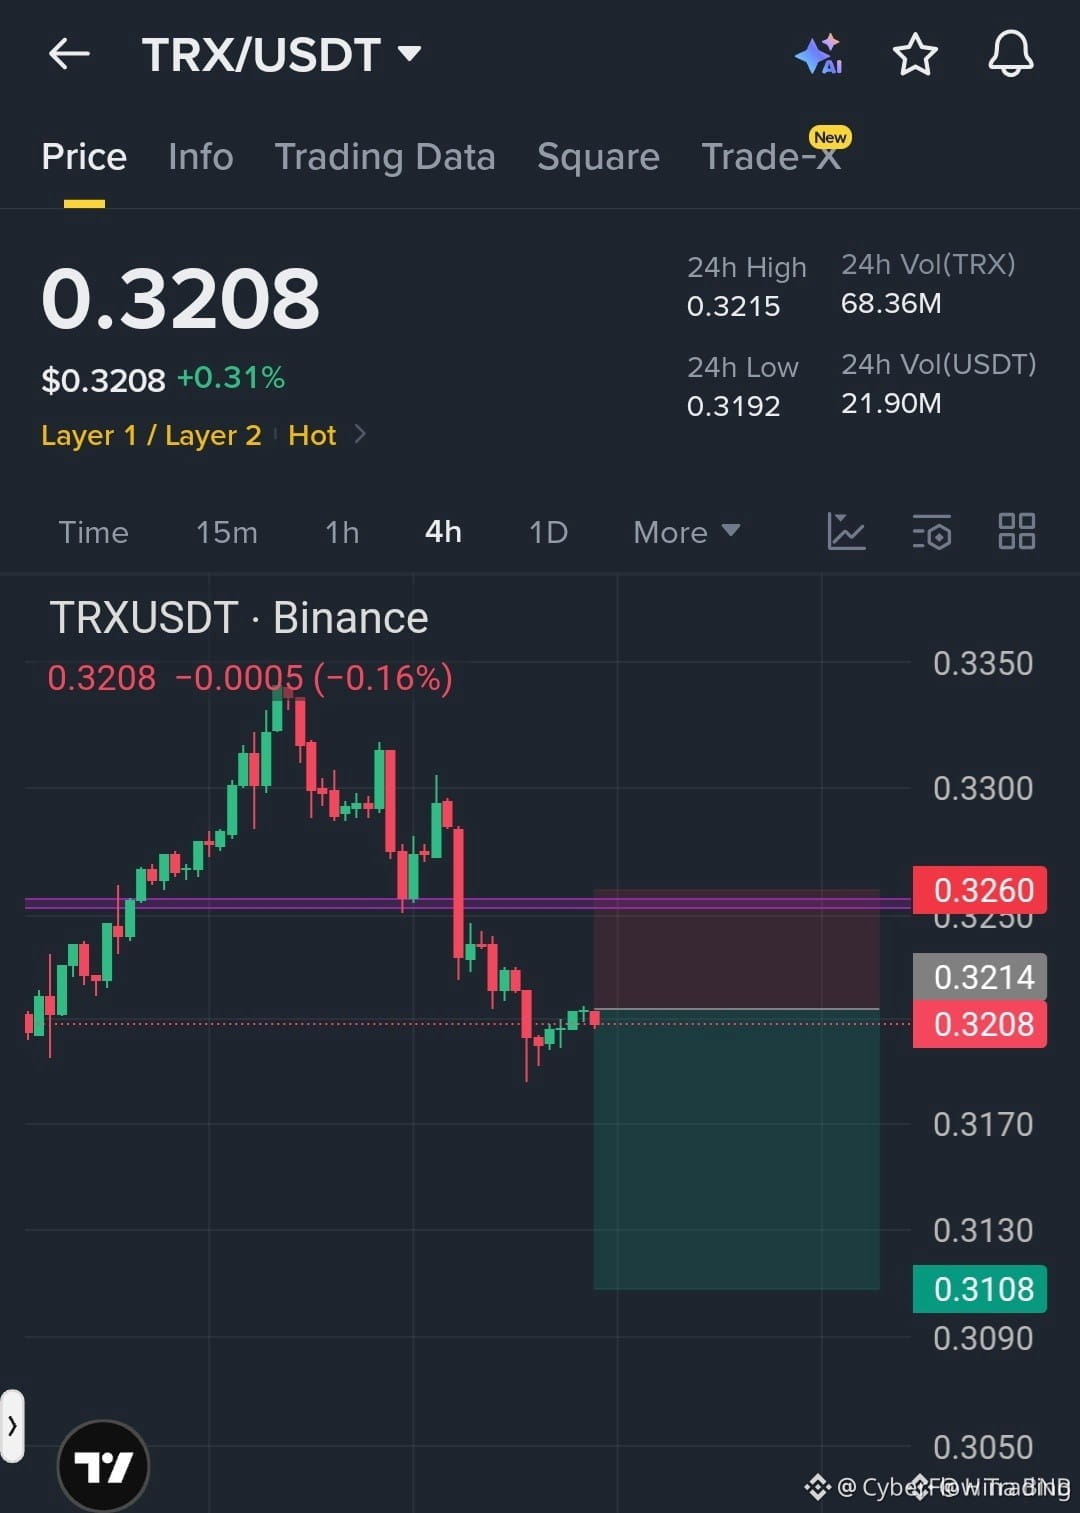
$TRX JUST LOST KEY SUPPORT – SHORT PRESSURE BUILDING 🚨
Entry: 0.3205 🔥
Target: 0.3170 🚀
Stop Loss: 0.3260 ⚠️
TRX broke down hard from resistance and is now trading below a major zone I’ve been watching all week. The structure flipped bearish and sellers are holding the bid firmly. Volume is picking up on the 1H, and as long as price stays under the stop-loss level, the path of least resistance is lower.
The risk-to-reward on the first target alone is solid, and with multiple profit zones stacked below, this setup has room to run. Are you shorting this or waiting for a retest of the breakdown level?
Not financial advice. Always manage your risk.
#TRX #ShortSetup #Bearish #Crypto #TRXAnalysis
🚨
$TRX JUST LOST KEY SUPPORT – SHORT PRESSURE BUILDING 🚨
Entry: 0.3205 🔥
Target: 0.3170 🚀
Stop Loss: 0.3260 ⚠️
TRX broke down hard from resistance and is now trading below a major zone I’ve been watching all week. The structure flipped bearish and sellers are holding the bid firmly. Volume is picking up on the 1H, and as long as price stays under the stop-loss level, the path of least resistance is lower.
The risk-to-reward on the first target alone is solid, and with multiple profit zones stacked below, this setup has room to run. Are you shorting this or waiting for a retest of the breakdown level?
Not financial advice. Always manage your risk.
#TRX #ShortSetup #Bearish #Crypto #TRXAnalysis
🚨
Entry: 0.3205 🔥
Target: 0.3170 🚀
Stop Loss: 0.3260 ⚠️
TRX broke down hard from resistance and is now trading below a major zone I’ve been watching all week. The structure flipped bearish and sellers are holding the bid firmly. Volume is picking up on the 1H, and as long as price stays under the stop-loss level, the path of least resistance is lower.
The risk-to-reward on the first target alone is solid, and with multiple profit zones stacked below, this setup has room to run. Are you shorting this or waiting for a retest of the breakdown level?
Not financial advice. Always manage your risk.
#TRX #ShortSetup #Bearish #Crypto #TRXAnalysis
🚨
31

·
--
Bearish
$TRX SHORT TRADE SETUP
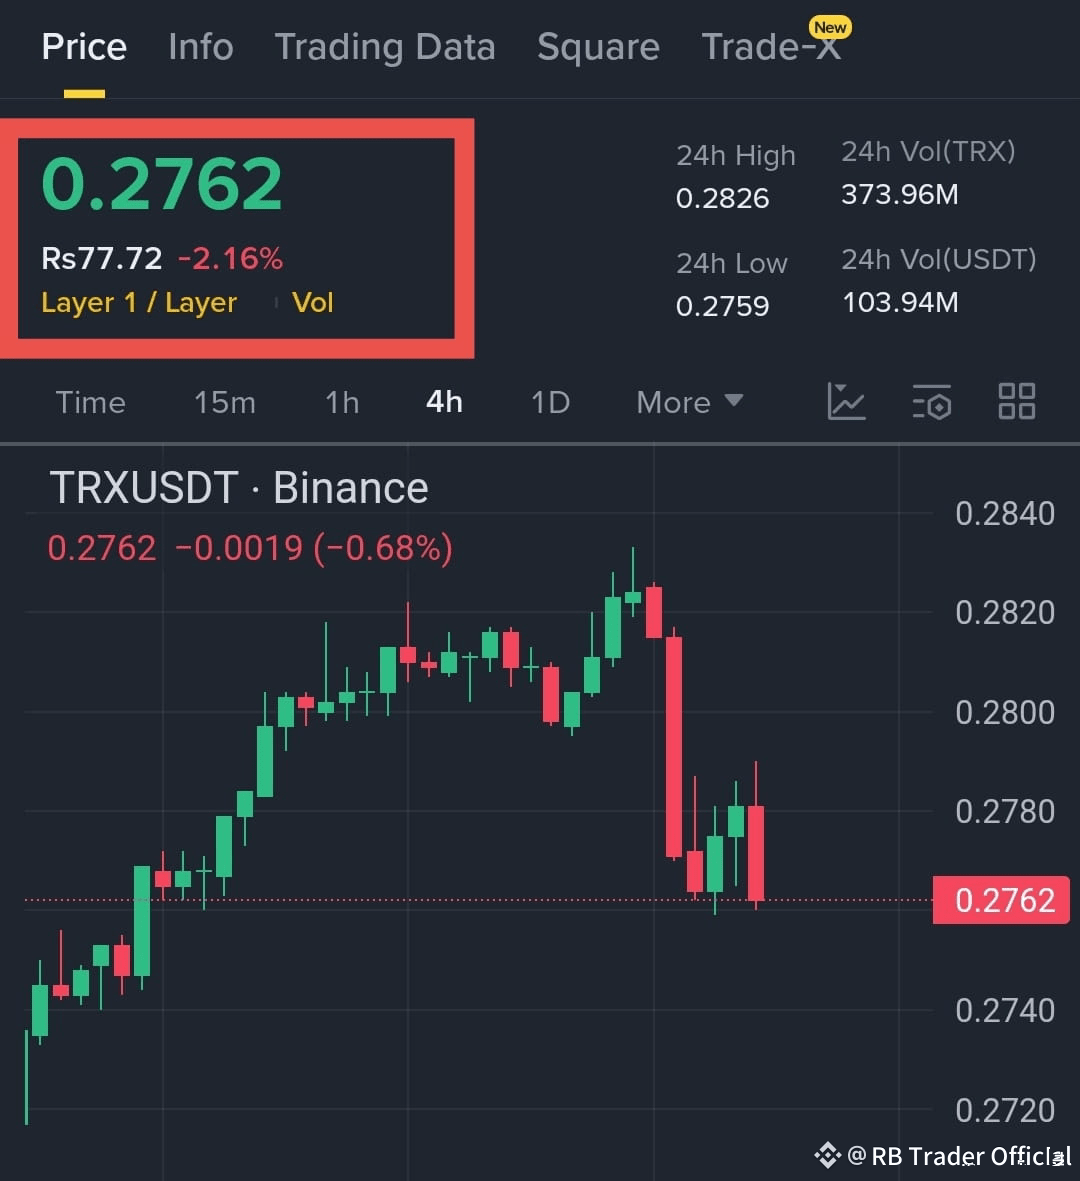
$TRX is showing clear rejection from the recent push toward 0.2820, and the last few 4H candles confirm selling pressure taking control again. Price failed to hold above support and slipped back into the lower zone, indicating bears are tightening momentum.
Market structure is turning weaker with every lower high, and the current pullback looks like a typical bearish continuation. If TRX stays below the rejection zone, further downside movement is highly likely.
Entry Zone
0.2760 – 0.2775
Targets
TP1: 0.2725
TP2: 0.2690
Stop Loss
0.2810
#TRXAnalysis #CryptoTrades
$TRX SHORT TRADE SETUP
$TRX is showing clear rejection from the recent push toward 0.2820, and the last few 4H candles confirm selling pressure taking control again. Price failed to hold above support and slipped back into the lower zone, indicating bears are tightening momentum.
Market structure is turning weaker with every lower high, and the current pullback looks like a typical bearish continuation. If TRX stays below the rejection zone, further downside movement is highly likely.
Entry Zone
0.2760 – 0.2775
Targets
TP1: 0.2725
TP2: 0.2690
Stop Loss
0.2810
#TRXAnalysis #CryptoTrades
$TRX is showing clear rejection from the recent push toward 0.2820, and the last few 4H candles confirm selling pressure taking control again. Price failed to hold above support and slipped back into the lower zone, indicating bears are tightening momentum.
Market structure is turning weaker with every lower high, and the current pullback looks like a typical bearish continuation. If TRX stays below the rejection zone, further downside movement is highly likely.
Entry Zone
0.2760 – 0.2775
Targets
TP1: 0.2725
TP2: 0.2690
Stop Loss
0.2810
#TRXAnalysis #CryptoTrades
1
122
Log in to explore more content
Join global crypto users on Binance Square
⚡️ Get latest and useful information about crypto.
💬 Trusted by the world’s largest crypto exchange.
👍 Discover real insights from verified creators.
Email / Phone number
Trending Topics
1
#HuangRisksOusterOverReportedAffairWithSubordinate
1,766 views
32 Discussing
2
#AnthropicRejectsIPODelayValuationinQuestion
420,221 views
3,581 Discussing
3
#CoreWeaveJumps10%On168%RevenueGrowth
42,824 views
657 Discussing
4
#ZcashFallsBelow$1000ForFirstTimeSinceSeptember
21,227 views
130 Discussing
5
#CanNvidiaEarningsEaseMarketConcerns?
142,365 views
1,592 Discussing
6
#StrategyMetaplanetLoseMSCIIndexMembership
161 views
11 Discussing
7
#tZEROWinsCFTCApprovalForRegulatedDerivativesExchange
59 views
5 Discussing
8
#HotCPIDecemberHikePriced
442,634 views
3,619 Discussing
9
#StablecoinSupplyDrops$14.2BIn30Days
283 views
7 Discussing
10
#TradFiForBeginners
476,311 views
3,184 Discussing