
#liquidationmap
liquidationmap
397,277 views
813 Discussing
Hot
Latest

·
--
Bullish
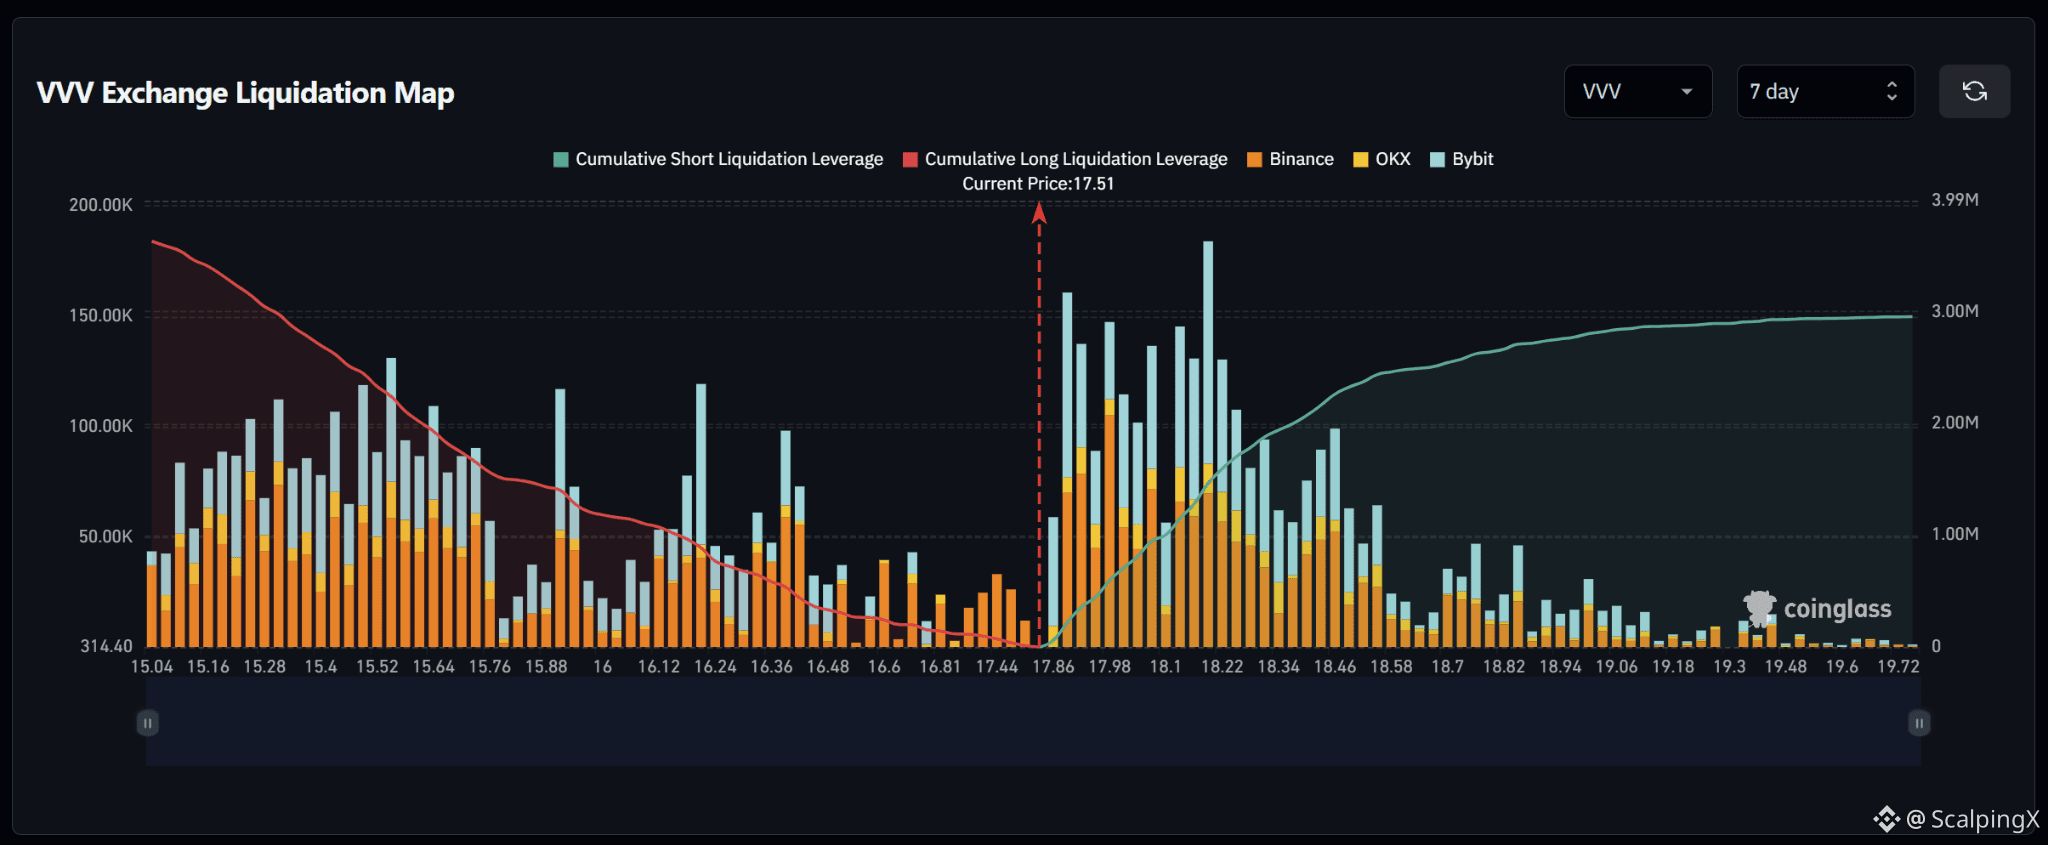
$VVV – Liquidation Map (7 Days) – Current Price 17.51
🔎 The 7-day liquidation map shows roughly $3.6 million in long liquidations below the current price, exceeding approximately $3.0 million in short liquidations above. The liquidity structure is therefore fairly balanced but modestly tilted to the downside, with around 1.2 times more cumulative liquidity below the market.
📉 Below the market, nearby long-liquidation liquidity remains relatively thin around 17.44–16.81 before increasing across 16.60–16.24. Notable clusters appear around 16.36 and 16.24, while liquidity becomes much denser further down across 15.88–15.28. Losing 17.44 would shift attention toward 16.81–16.60.
📈 Above the market, short-liquidation liquidity begins rising sharply from 17.86 and becomes dense across 17.98–18.34. The strongest cluster sits around 18.18–18.22, where the liquidation bar approaches $185,000, while 17.86–18.10 and 18.34–18.46 also contain notable liquidity.
🧭 The broader setup modestly favors the downside because long-liquidation exposure below is larger. Losing 17.44 would increase the probability of a sweep toward 16.81–16.60, while breaking above 17.86 would shift attention toward 17.98–18.22.
#LiquidationMap
$VVV – Liquidation Map (7 Days) – Current Price 17.51
🔎 The 7-day liquidation map shows roughly $3.6 million in long liquidations below the current price, exceeding approximately $3.0 million in short liquidations above. The liquidity structure is therefore fairly balanced but modestly tilted to the downside, with around 1.2 times more cumulative liquidity below the market.
📉 Below the market, nearby long-liquidation liquidity remains relatively thin around 17.44–16.81 before increasing across 16.60–16.24. Notable clusters appear around 16.36 and 16.24, while liquidity becomes much denser further down across 15.88–15.28. Losing 17.44 would shift attention toward 16.81–16.60.
📈 Above the market, short-liquidation liquidity begins rising sharply from 17.86 and becomes dense across 17.98–18.34. The strongest cluster sits around 18.18–18.22, where the liquidation bar approaches $185,000, while 17.86–18.10 and 18.34–18.46 also contain notable liquidity.
🧭 The broader setup modestly favors the downside because long-liquidation exposure below is larger. Losing 17.44 would increase the probability of a sweep toward 16.81–16.60, while breaking above 17.86 would shift attention toward 17.98–18.22.
#LiquidationMap
🔎 The 7-day liquidation map shows roughly $3.6 million in long liquidations below the current price, exceeding approximately $3.0 million in short liquidations above. The liquidity structure is therefore fairly balanced but modestly tilted to the downside, with around 1.2 times more cumulative liquidity below the market.
📉 Below the market, nearby long-liquidation liquidity remains relatively thin around 17.44–16.81 before increasing across 16.60–16.24. Notable clusters appear around 16.36 and 16.24, while liquidity becomes much denser further down across 15.88–15.28. Losing 17.44 would shift attention toward 16.81–16.60.
📈 Above the market, short-liquidation liquidity begins rising sharply from 17.86 and becomes dense across 17.98–18.34. The strongest cluster sits around 18.18–18.22, where the liquidation bar approaches $185,000, while 17.86–18.10 and 18.34–18.46 also contain notable liquidity.
🧭 The broader setup modestly favors the downside because long-liquidation exposure below is larger. Losing 17.44 would increase the probability of a sweep toward 16.81–16.60, while breaking above 17.86 would shift attention toward 17.98–18.22.
#LiquidationMap
84
·
--
Bullish
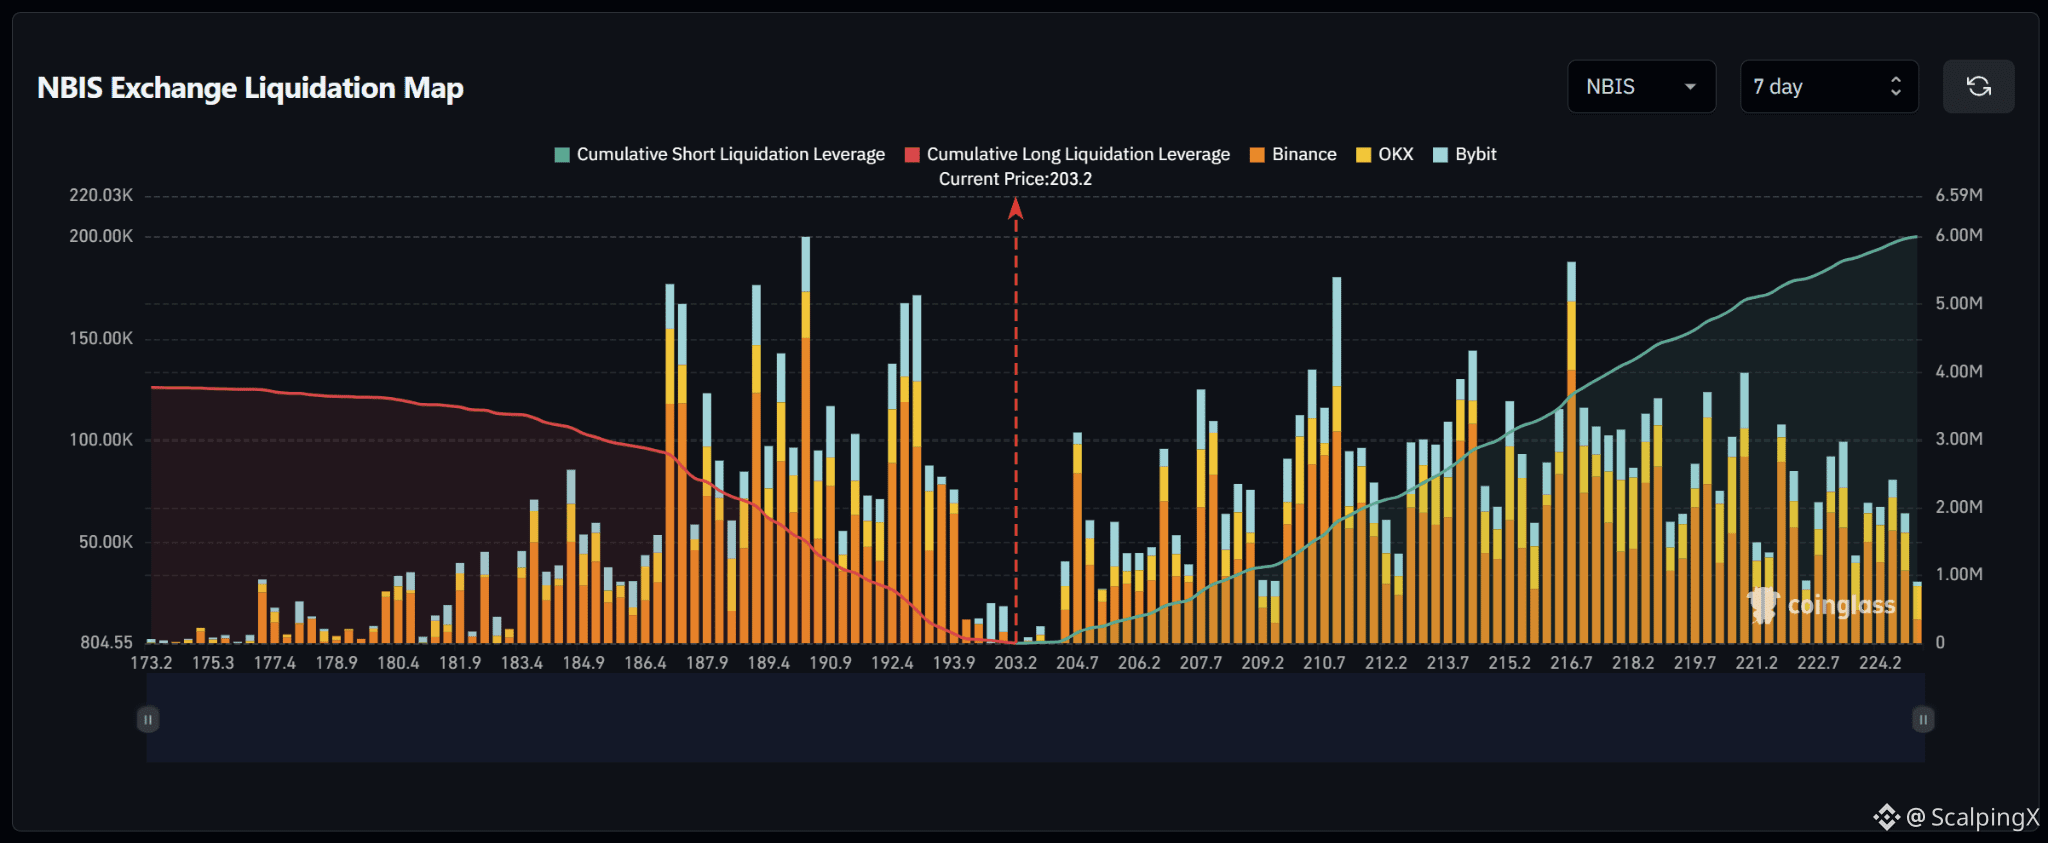
$NBIS – Liquidation Map (7 Days) – Current Price 203.2
🔎 The 7-day liquidation map shows roughly $6 million in short liquidations above the current price, exceeding approximately 4 million in long liquidations below. The liquidity structure therefore favors the upside, with roughly 1.5 times more cumulative liquidity above the market.
📉 Below the market, nearby long-liquidation liquidity remains relatively thin around 193.9–192.4 before increasing sharply across 190.9–186.4. The strongest clusters sit around 190 and 187, with several bars reaching roughly $150,000–200,000. Losing 193.9 would shift attention toward 192.4–190.9.
📈 Above the market, short-liquidation liquidity begins building from 204.7 and increases across 207.7–212.2. A notable cluster near 210.7 reaches almost $180,000. Further out, liquidity remains dense across 213.7–218.2, with the 216.7 area standing out near $190,000.
🧭 The broader setup favors the upside because short-liquidation exposure above is roughly 1.5 times larger. Breaking 204.7 would increase the probability of a sweep toward 207.7–212.2, while losing 193.9 would shift attention toward 192.4–190.9.
#LiquidationMap
$NBIS – Liquidation Map (7 Days) – Current Price 203.2
🔎 The 7-day liquidation map shows roughly $6 million in short liquidations above the current price, exceeding approximately 4 million in long liquidations below. The liquidity structure therefore favors the upside, with roughly 1.5 times more cumulative liquidity above the market.
📉 Below the market, nearby long-liquidation liquidity remains relatively thin around 193.9–192.4 before increasing sharply across 190.9–186.4. The strongest clusters sit around 190 and 187, with several bars reaching roughly $150,000–200,000. Losing 193.9 would shift attention toward 192.4–190.9.
📈 Above the market, short-liquidation liquidity begins building from 204.7 and increases across 207.7–212.2. A notable cluster near 210.7 reaches almost $180,000. Further out, liquidity remains dense across 213.7–218.2, with the 216.7 area standing out near $190,000.
🧭 The broader setup favors the upside because short-liquidation exposure above is roughly 1.5 times larger. Breaking 204.7 would increase the probability of a sweep toward 207.7–212.2, while losing 193.9 would shift attention toward 192.4–190.9.
#LiquidationMap
🔎 The 7-day liquidation map shows roughly $6 million in short liquidations above the current price, exceeding approximately 4 million in long liquidations below. The liquidity structure therefore favors the upside, with roughly 1.5 times more cumulative liquidity above the market.
📉 Below the market, nearby long-liquidation liquidity remains relatively thin around 193.9–192.4 before increasing sharply across 190.9–186.4. The strongest clusters sit around 190 and 187, with several bars reaching roughly $150,000–200,000. Losing 193.9 would shift attention toward 192.4–190.9.
📈 Above the market, short-liquidation liquidity begins building from 204.7 and increases across 207.7–212.2. A notable cluster near 210.7 reaches almost $180,000. Further out, liquidity remains dense across 213.7–218.2, with the 216.7 area standing out near $190,000.
🧭 The broader setup favors the upside because short-liquidation exposure above is roughly 1.5 times larger. Breaking 204.7 would increase the probability of a sweep toward 207.7–212.2, while losing 193.9 would shift attention toward 192.4–190.9.
#LiquidationMap
17
·
--
Bullish
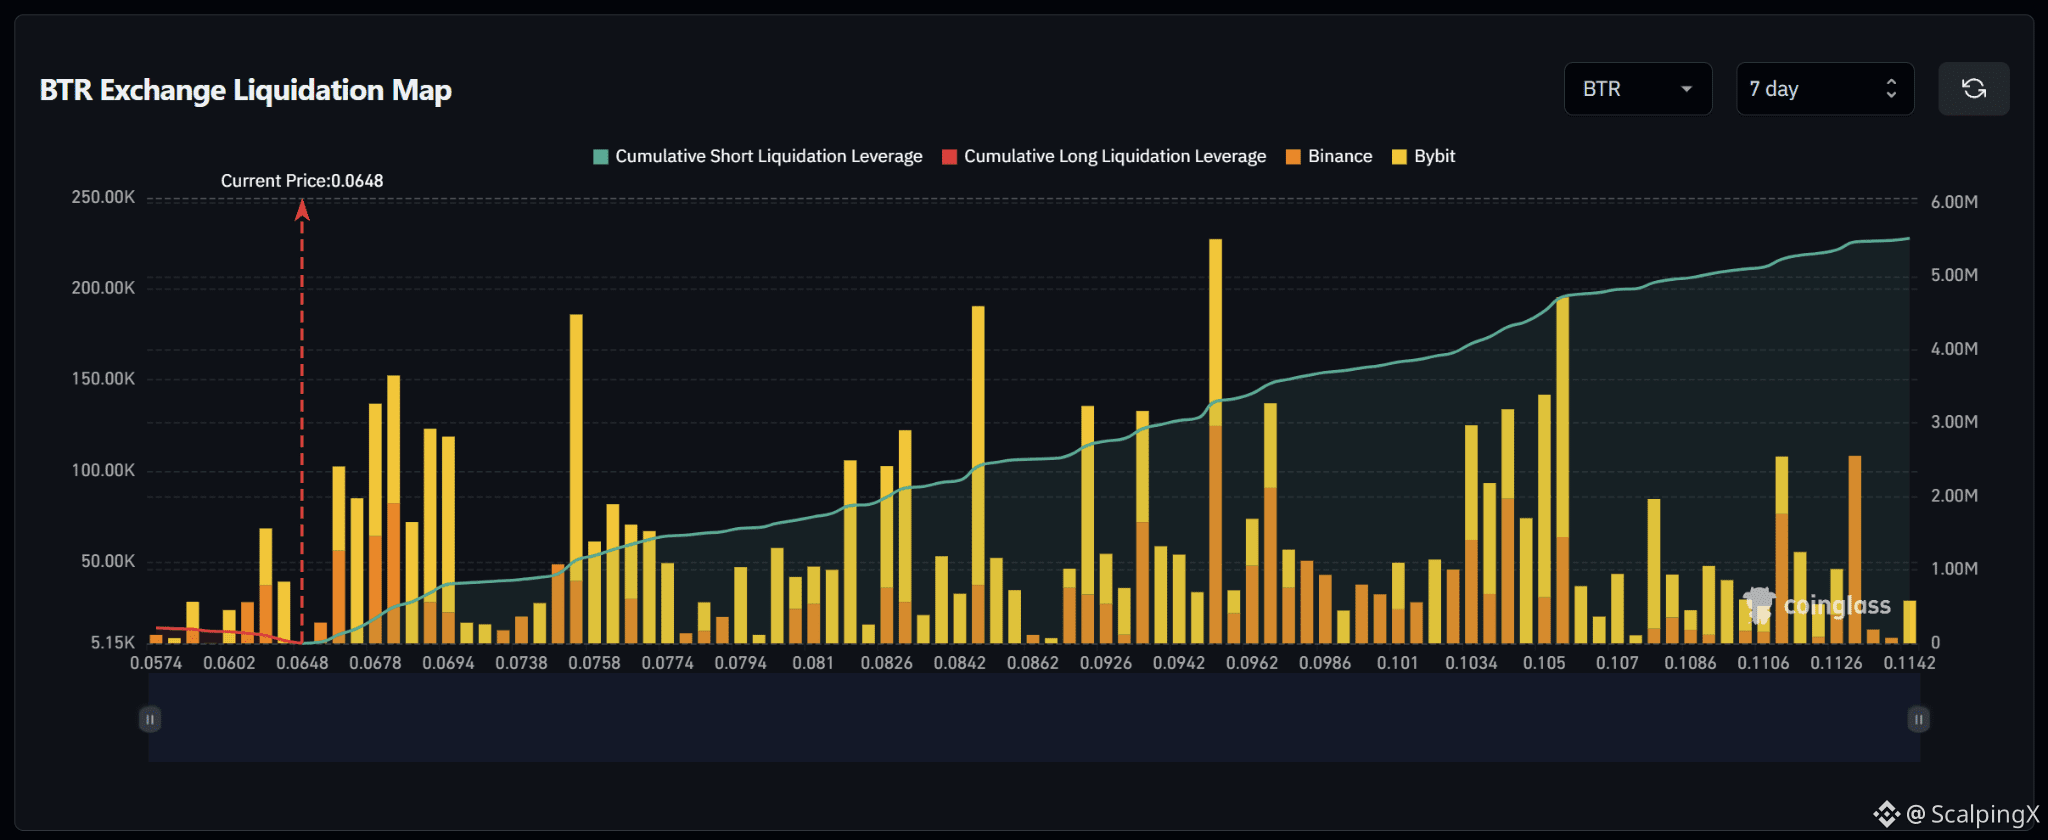
$BTR – Liquidation Map (7 Days) – Current Price 0.0648
🔎 The 7-day liquidation map shows roughly $5.4–5.5 million in short liquidations above the current price, while long-liquidation exposure below is almost negligible as price sits near the lower edge of the displayed range. The liquidity structure therefore strongly favors the upside.
📉 Below the market, remaining long-liquidation liquidity is relatively thin, mainly around 0.0602–0.0574. There are no major liquidation clusters immediately below the current price, suggesting limited downside liquidity attraction within the displayed range.
📈 Above the market, short-liquidation liquidity begins building immediately around 0.0678–0.0694, followed by several large clusters near 0.0758, 0.0842 and especially 0.094–0.096. Further out, 0.1034–0.105 stands out with bars around $140,000–195,000, while 0.1126 also contains a notable cluster.
🧭 The broader setup strongly favors the upside because nearly all significant liquidation liquidity is positioned above the market. Breaking 0.0678 would increase the probability of a sweep toward 0.0694–0.0758; if momentum continues, 0.0842 and 0.094–0.096 would become the next notable liquidity zones.
#LiquidationMap
$BTR – Liquidation Map (7 Days) – Current Price 0.0648
🔎 The 7-day liquidation map shows roughly $5.4–5.5 million in short liquidations above the current price, while long-liquidation exposure below is almost negligible as price sits near the lower edge of the displayed range. The liquidity structure therefore strongly favors the upside.
📉 Below the market, remaining long-liquidation liquidity is relatively thin, mainly around 0.0602–0.0574. There are no major liquidation clusters immediately below the current price, suggesting limited downside liquidity attraction within the displayed range.
📈 Above the market, short-liquidation liquidity begins building immediately around 0.0678–0.0694, followed by several large clusters near 0.0758, 0.0842 and especially 0.094–0.096. Further out, 0.1034–0.105 stands out with bars around $140,000–195,000, while 0.1126 also contains a notable cluster.
🧭 The broader setup strongly favors the upside because nearly all significant liquidation liquidity is positioned above the market. Breaking 0.0678 would increase the probability of a sweep toward 0.0694–0.0758; if momentum continues, 0.0842 and 0.094–0.096 would become the next notable liquidity zones.
#LiquidationMap
🔎 The 7-day liquidation map shows roughly $5.4–5.5 million in short liquidations above the current price, while long-liquidation exposure below is almost negligible as price sits near the lower edge of the displayed range. The liquidity structure therefore strongly favors the upside.
📉 Below the market, remaining long-liquidation liquidity is relatively thin, mainly around 0.0602–0.0574. There are no major liquidation clusters immediately below the current price, suggesting limited downside liquidity attraction within the displayed range.
📈 Above the market, short-liquidation liquidity begins building immediately around 0.0678–0.0694, followed by several large clusters near 0.0758, 0.0842 and especially 0.094–0.096. Further out, 0.1034–0.105 stands out with bars around $140,000–195,000, while 0.1126 also contains a notable cluster.
🧭 The broader setup strongly favors the upside because nearly all significant liquidation liquidity is positioned above the market. Breaking 0.0678 would increase the probability of a sweep toward 0.0694–0.0758; if momentum continues, 0.0842 and 0.094–0.096 would become the next notable liquidity zones.
#LiquidationMap
40
·
--
Bullish
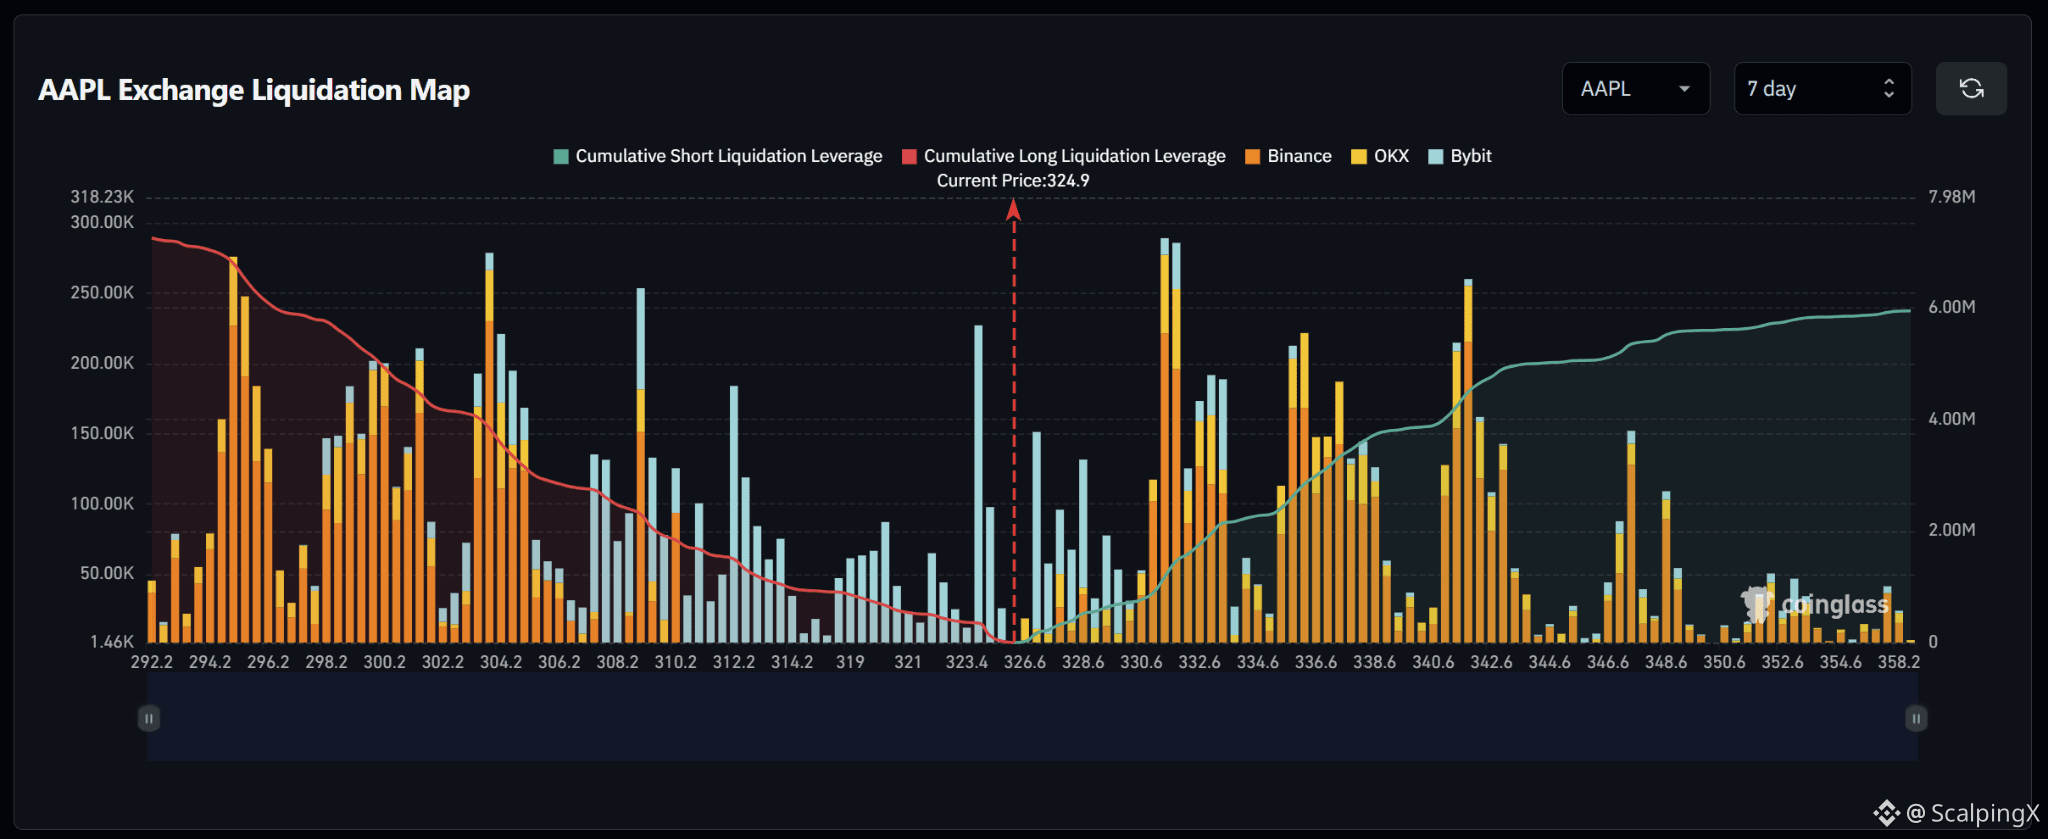
$AAPL – Liquidation Map (7 Days) – Current Price 324.9
🔎 The 7-day liquidation map shows roughly $7 million in long liquidations below the current price, exceeding approximately $6 million in short liquidations above. The overall structure is therefore fairly balanced but modestly tilted to the downside.
📉 Below the market, nearby long-liquidation liquidity is concentrated around 323.4–321.0, with a notable bar near 323.4 exceeding $200,000. Further down, larger clusters appear around 308.2–304.2 and 296.2–294.2, where several bars reach roughly $200,000–280,000. Losing 323.4 would shift attention toward 321.0–319.0.
📈 Above the market, short-liquidation liquidity begins building from around 326.6 and becomes much denser across 330.6–332.6. The strongest cluster near 331–332 approaches $290,000. Further out, 336.6 and 340.6–342.6 also contain notable liquidity.
🧭 The broader setup modestly favors the downside because long-liquidation exposure below is larger. Losing 323.4 would increase the probability of a sweep toward 321.0–319.0, while breaking above 326.6 would shift attention toward 330.6–332.6.
#LiquidationMap
$AAPL – Liquidation Map (7 Days) – Current Price 324.9
🔎 The 7-day liquidation map shows roughly $7 million in long liquidations below the current price, exceeding approximately $6 million in short liquidations above. The overall structure is therefore fairly balanced but modestly tilted to the downside.
📉 Below the market, nearby long-liquidation liquidity is concentrated around 323.4–321.0, with a notable bar near 323.4 exceeding $200,000. Further down, larger clusters appear around 308.2–304.2 and 296.2–294.2, where several bars reach roughly $200,000–280,000. Losing 323.4 would shift attention toward 321.0–319.0.
📈 Above the market, short-liquidation liquidity begins building from around 326.6 and becomes much denser across 330.6–332.6. The strongest cluster near 331–332 approaches $290,000. Further out, 336.6 and 340.6–342.6 also contain notable liquidity.
🧭 The broader setup modestly favors the downside because long-liquidation exposure below is larger. Losing 323.4 would increase the probability of a sweep toward 321.0–319.0, while breaking above 326.6 would shift attention toward 330.6–332.6.
#LiquidationMap
🔎 The 7-day liquidation map shows roughly $7 million in long liquidations below the current price, exceeding approximately $6 million in short liquidations above. The overall structure is therefore fairly balanced but modestly tilted to the downside.
📉 Below the market, nearby long-liquidation liquidity is concentrated around 323.4–321.0, with a notable bar near 323.4 exceeding $200,000. Further down, larger clusters appear around 308.2–304.2 and 296.2–294.2, where several bars reach roughly $200,000–280,000. Losing 323.4 would shift attention toward 321.0–319.0.
📈 Above the market, short-liquidation liquidity begins building from around 326.6 and becomes much denser across 330.6–332.6. The strongest cluster near 331–332 approaches $290,000. Further out, 336.6 and 340.6–342.6 also contain notable liquidity.
🧭 The broader setup modestly favors the downside because long-liquidation exposure below is larger. Losing 323.4 would increase the probability of a sweep toward 321.0–319.0, while breaking above 326.6 would shift attention toward 330.6–332.6.
#LiquidationMap
1
16
·
--
Bullish
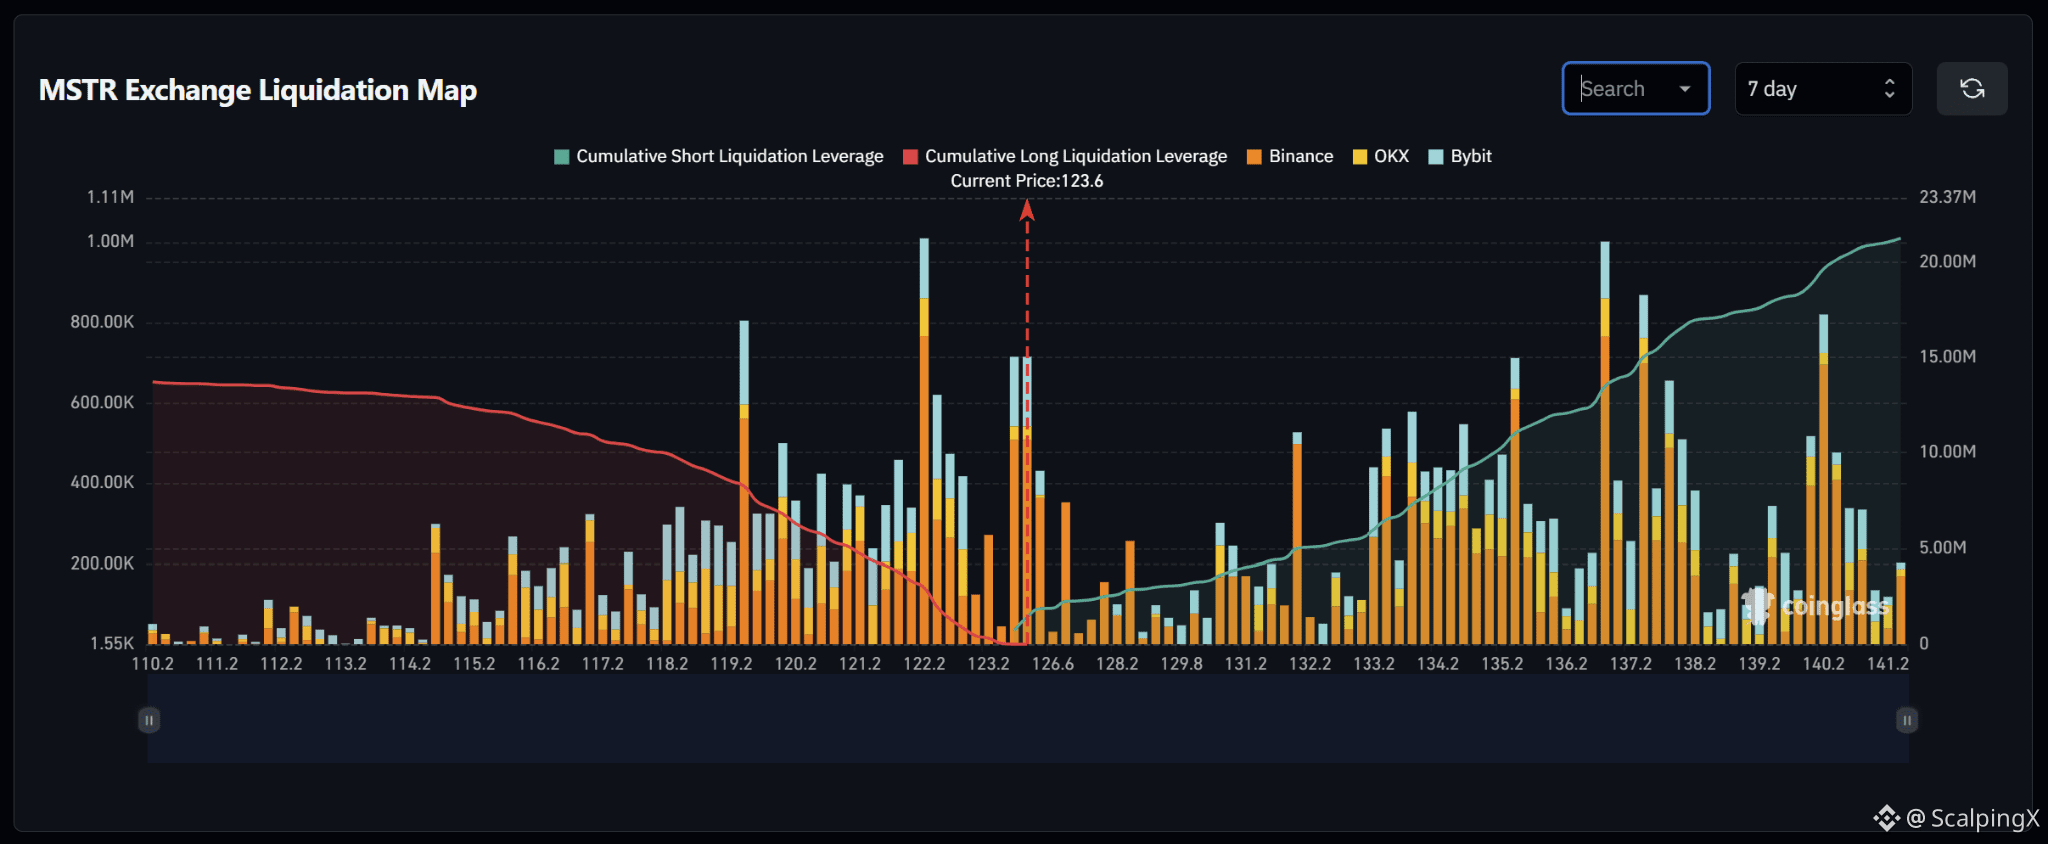
$MSTR – Liquidation Map (7 Days) – Current Price 123.6
🔎 The 7-day liquidation map shows roughly $20–21 million in short liquidations above the current price, exceeding approximately 13–14 million in long liquidations below. The liquidity structure therefore favors the upside, with roughly 1.5 times more cumulative liquidity above the market.
📉 Below the market, nearby long-liquidation liquidity is concentrated around 123.2–122.2. The strongest cluster sits near 122.2, where the liquidation bar reaches roughly 1 million, while 119.2 also contains a large cluster near $800,000. Losing 123.2 would increase the probability of a sweep toward 122.2.
📈 Above the market, short-liquidation liquidity begins building around 124–126.6 before increasing sharply across 133.2–137.2. The 136.2–137.2 area stands out with liquidation bars around $850,000–1 million. Further out, the 140.2 area also contains a large cluster above $800,000.
🧭 The broader setup favors the upside because short-liquidation exposure above is roughly 1.5 times larger. Breaking through 124–126.6 would increase the probability of a move toward 133.2–137.2, while losing 123.2 would shift attention toward 122.2.
#LiquidationMap
$MSTR – Liquidation Map (7 Days) – Current Price 123.6
🔎 The 7-day liquidation map shows roughly $20–21 million in short liquidations above the current price, exceeding approximately 13–14 million in long liquidations below. The liquidity structure therefore favors the upside, with roughly 1.5 times more cumulative liquidity above the market.
📉 Below the market, nearby long-liquidation liquidity is concentrated around 123.2–122.2. The strongest cluster sits near 122.2, where the liquidation bar reaches roughly 1 million, while 119.2 also contains a large cluster near $800,000. Losing 123.2 would increase the probability of a sweep toward 122.2.
📈 Above the market, short-liquidation liquidity begins building around 124–126.6 before increasing sharply across 133.2–137.2. The 136.2–137.2 area stands out with liquidation bars around $850,000–1 million. Further out, the 140.2 area also contains a large cluster above $800,000.
🧭 The broader setup favors the upside because short-liquidation exposure above is roughly 1.5 times larger. Breaking through 124–126.6 would increase the probability of a move toward 133.2–137.2, while losing 123.2 would shift attention toward 122.2.
#LiquidationMap
🔎 The 7-day liquidation map shows roughly $20–21 million in short liquidations above the current price, exceeding approximately 13–14 million in long liquidations below. The liquidity structure therefore favors the upside, with roughly 1.5 times more cumulative liquidity above the market.
📉 Below the market, nearby long-liquidation liquidity is concentrated around 123.2–122.2. The strongest cluster sits near 122.2, where the liquidation bar reaches roughly 1 million, while 119.2 also contains a large cluster near $800,000. Losing 123.2 would increase the probability of a sweep toward 122.2.
📈 Above the market, short-liquidation liquidity begins building around 124–126.6 before increasing sharply across 133.2–137.2. The 136.2–137.2 area stands out with liquidation bars around $850,000–1 million. Further out, the 140.2 area also contains a large cluster above $800,000.
🧭 The broader setup favors the upside because short-liquidation exposure above is roughly 1.5 times larger. Breaking through 124–126.6 would increase the probability of a move toward 133.2–137.2, while losing 123.2 would shift attention toward 122.2.
#LiquidationMap
9
·
--
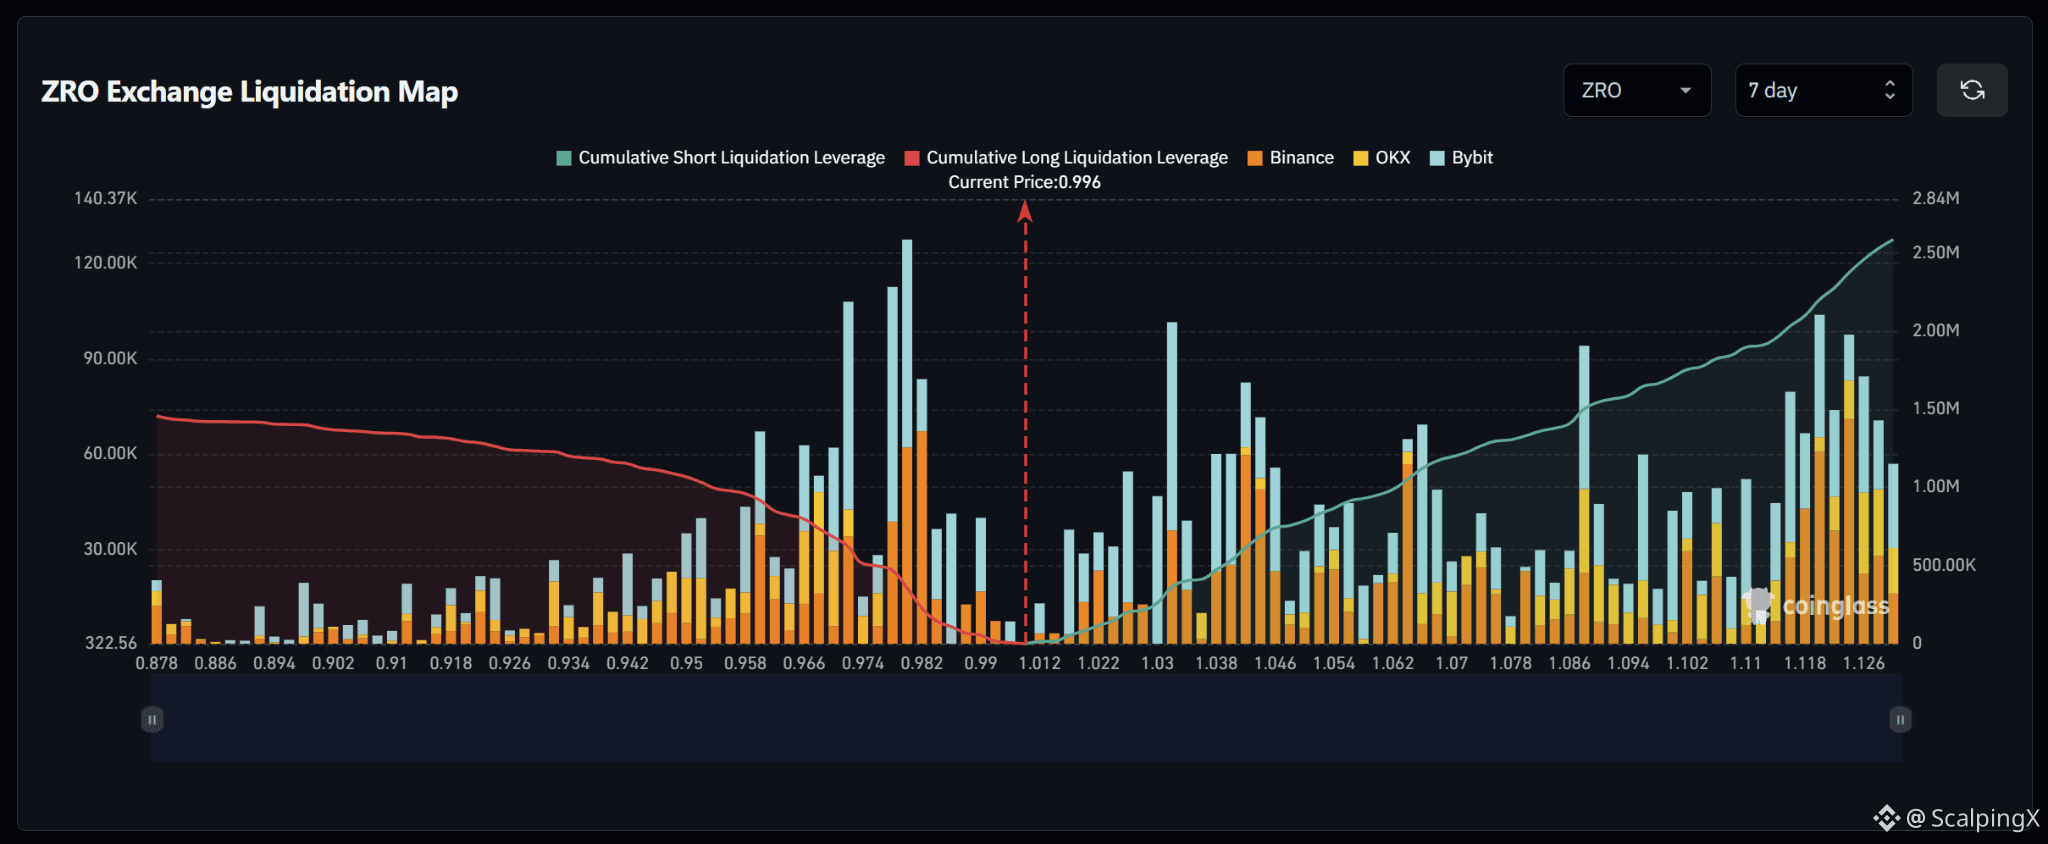
$ZRO – Liquidation Map (7 Days) – Current Price 0.996
🔎 The 7-day liquidation map shows roughly $2.5 million in short liquidations above the current price, exceeding approximately $1.5 million in long liquidations below. The liquidity structure therefore favors the upside, with roughly 1.6–1.7 times more cumulative liquidity above the market.
📉 Below the market, nearby long-liquidation liquidity is concentrated around 0.982–0.966. The strongest cluster sits near 0.978–0.982, where liquidation bars reach roughly $110,000–130,000, while 0.966–0.974 also contains notable liquidity. Losing 0.982 would shift attention toward 0.974–0.966.
📈 Above the market, short-liquidation liquidity begins building from around 1.012 and increases across 1.030–1.046. Further out, the 1.086 and especially 1.118–1.126 areas stand out, with several bars around $90,000–105,000. These form some of the more notable upside liquidity zones.
🧭 The broader setup favors the upside because short-liquidation exposure above is roughly 1.6–1.7 times larger. Breaking 1.012 would increase the probability of a sweep toward 1.030–1.046, while losing 0.982 would shift attention toward 0.974–0.966.
#LiquidationMap
$ZRO – Liquidation Map (7 Days) – Current Price 0.996
🔎 The 7-day liquidation map shows roughly $2.5 million in short liquidations above the current price, exceeding approximately $1.5 million in long liquidations below. The liquidity structure therefore favors the upside, with roughly 1.6–1.7 times more cumulative liquidity above the market.
📉 Below the market, nearby long-liquidation liquidity is concentrated around 0.982–0.966. The strongest cluster sits near 0.978–0.982, where liquidation bars reach roughly $110,000–130,000, while 0.966–0.974 also contains notable liquidity. Losing 0.982 would shift attention toward 0.974–0.966.
📈 Above the market, short-liquidation liquidity begins building from around 1.012 and increases across 1.030–1.046. Further out, the 1.086 and especially 1.118–1.126 areas stand out, with several bars around $90,000–105,000. These form some of the more notable upside liquidity zones.
🧭 The broader setup favors the upside because short-liquidation exposure above is roughly 1.6–1.7 times larger. Breaking 1.012 would increase the probability of a sweep toward 1.030–1.046, while losing 0.982 would shift attention toward 0.974–0.966.
#LiquidationMap
🔎 The 7-day liquidation map shows roughly $2.5 million in short liquidations above the current price, exceeding approximately $1.5 million in long liquidations below. The liquidity structure therefore favors the upside, with roughly 1.6–1.7 times more cumulative liquidity above the market.
📉 Below the market, nearby long-liquidation liquidity is concentrated around 0.982–0.966. The strongest cluster sits near 0.978–0.982, where liquidation bars reach roughly $110,000–130,000, while 0.966–0.974 also contains notable liquidity. Losing 0.982 would shift attention toward 0.974–0.966.
📈 Above the market, short-liquidation liquidity begins building from around 1.012 and increases across 1.030–1.046. Further out, the 1.086 and especially 1.118–1.126 areas stand out, with several bars around $90,000–105,000. These form some of the more notable upside liquidity zones.
🧭 The broader setup favors the upside because short-liquidation exposure above is roughly 1.6–1.7 times larger. Breaking 1.012 would increase the probability of a sweep toward 1.030–1.046, while losing 0.982 would shift attention toward 0.974–0.966.
#LiquidationMap
73
·
--
Bullish
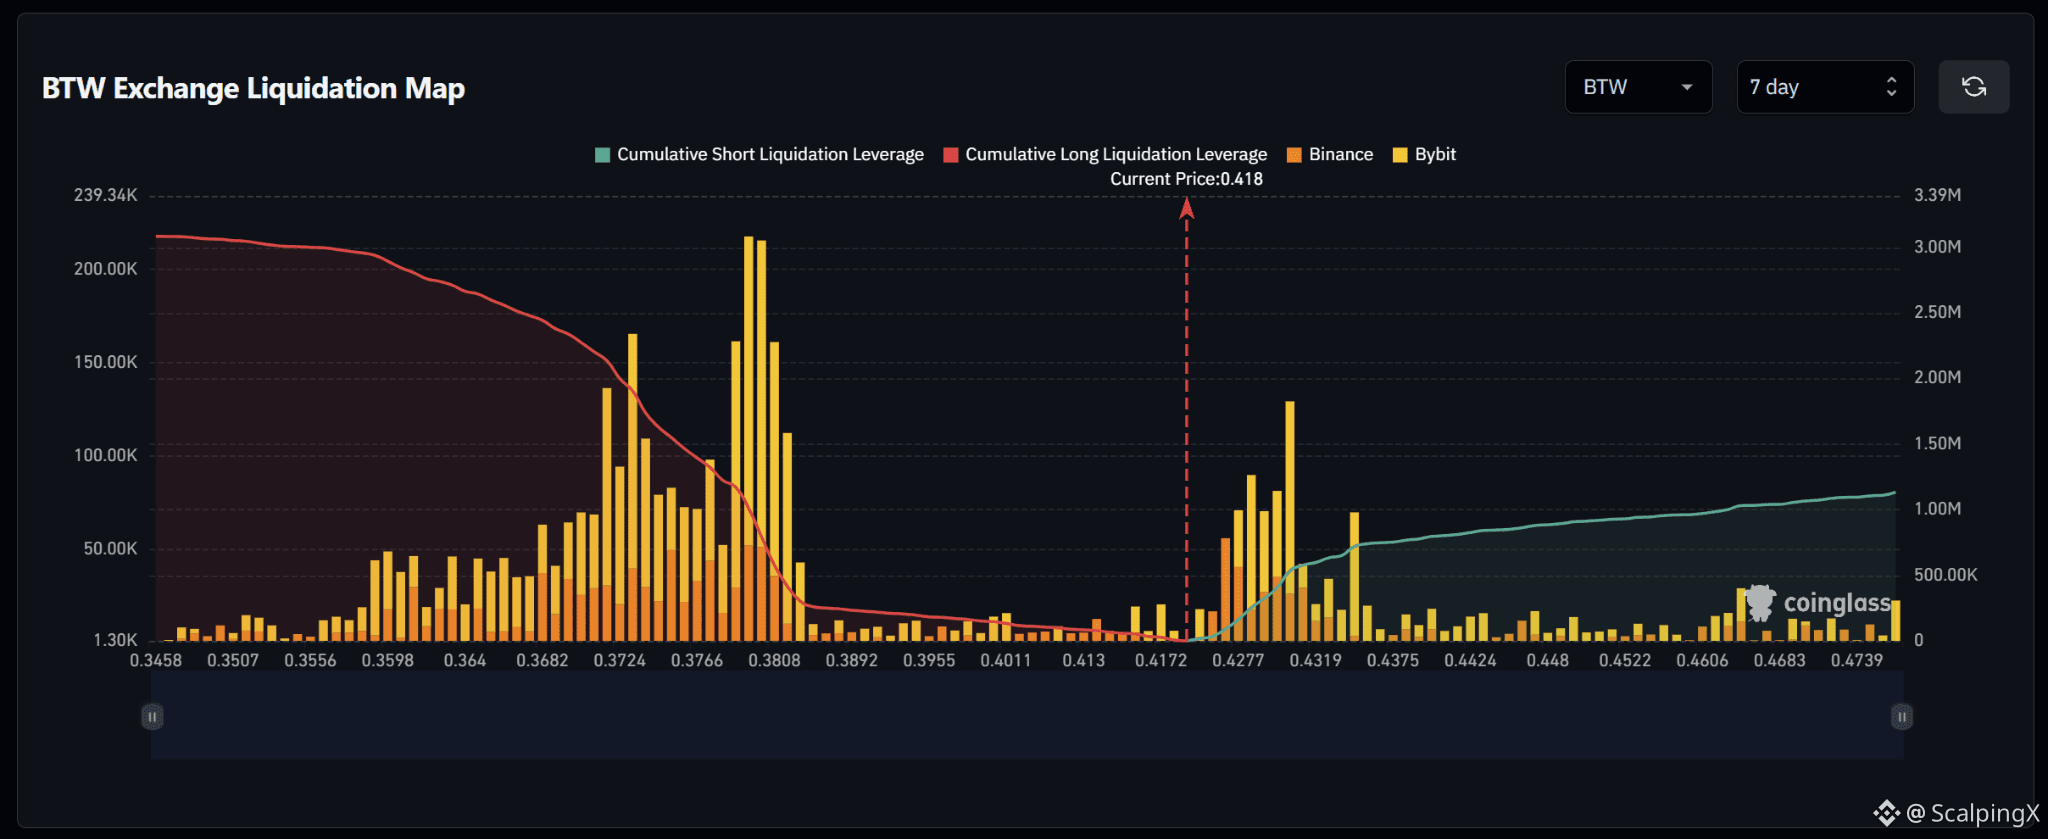
$BTW – Liquidation Map (7 Days) – Current Price 0.418
🔎 The 7-day liquidation map shows roughly $3.1 million in long liquidations below the current price, nearly three times the approximately $1.1 million in short liquidations above. The liquidity structure therefore clearly favors the downside.
📉 Below the market, nearby long-liquidation liquidity remains relatively thin around 0.413–0.401 before increasing sharply across 0.389–0.372. The strongest cluster sits around 0.378–0.381, where liquidation bars exceed $200,000, while 0.372–0.377 also contains substantial liquidity. Losing 0.413 would gradually shift attention toward 0.401–0.389.
📈 Above the market, short-liquidation liquidity begins building clearly from 0.4277 and increases across 0.4319–0.4375. The strongest cluster sits near 0.4319, where the liquidation bar reaches roughly $130,000, while 0.4277–0.4319 forms the nearest notable upside liquidity zone.
🧭 The broader setup favors the downside because long-liquidation exposure below is nearly three times larger. Losing 0.413 would increase the probability of a sweep toward 0.401–0.389, while breaking above 0.4277 would shift attention toward 0.4319–0.4375.
#LiquidationMap
$BTW – Liquidation Map (7 Days) – Current Price 0.418
🔎 The 7-day liquidation map shows roughly $3.1 million in long liquidations below the current price, nearly three times the approximately $1.1 million in short liquidations above. The liquidity structure therefore clearly favors the downside.
📉 Below the market, nearby long-liquidation liquidity remains relatively thin around 0.413–0.401 before increasing sharply across 0.389–0.372. The strongest cluster sits around 0.378–0.381, where liquidation bars exceed $200,000, while 0.372–0.377 also contains substantial liquidity. Losing 0.413 would gradually shift attention toward 0.401–0.389.
📈 Above the market, short-liquidation liquidity begins building clearly from 0.4277 and increases across 0.4319–0.4375. The strongest cluster sits near 0.4319, where the liquidation bar reaches roughly $130,000, while 0.4277–0.4319 forms the nearest notable upside liquidity zone.
🧭 The broader setup favors the downside because long-liquidation exposure below is nearly three times larger. Losing 0.413 would increase the probability of a sweep toward 0.401–0.389, while breaking above 0.4277 would shift attention toward 0.4319–0.4375.
#LiquidationMap
🔎 The 7-day liquidation map shows roughly $3.1 million in long liquidations below the current price, nearly three times the approximately $1.1 million in short liquidations above. The liquidity structure therefore clearly favors the downside.
📉 Below the market, nearby long-liquidation liquidity remains relatively thin around 0.413–0.401 before increasing sharply across 0.389–0.372. The strongest cluster sits around 0.378–0.381, where liquidation bars exceed $200,000, while 0.372–0.377 also contains substantial liquidity. Losing 0.413 would gradually shift attention toward 0.401–0.389.
📈 Above the market, short-liquidation liquidity begins building clearly from 0.4277 and increases across 0.4319–0.4375. The strongest cluster sits near 0.4319, where the liquidation bar reaches roughly $130,000, while 0.4277–0.4319 forms the nearest notable upside liquidity zone.
🧭 The broader setup favors the downside because long-liquidation exposure below is nearly three times larger. Losing 0.413 would increase the probability of a sweep toward 0.401–0.389, while breaking above 0.4277 would shift attention toward 0.4319–0.4375.
#LiquidationMap
6
·
--
Bullish
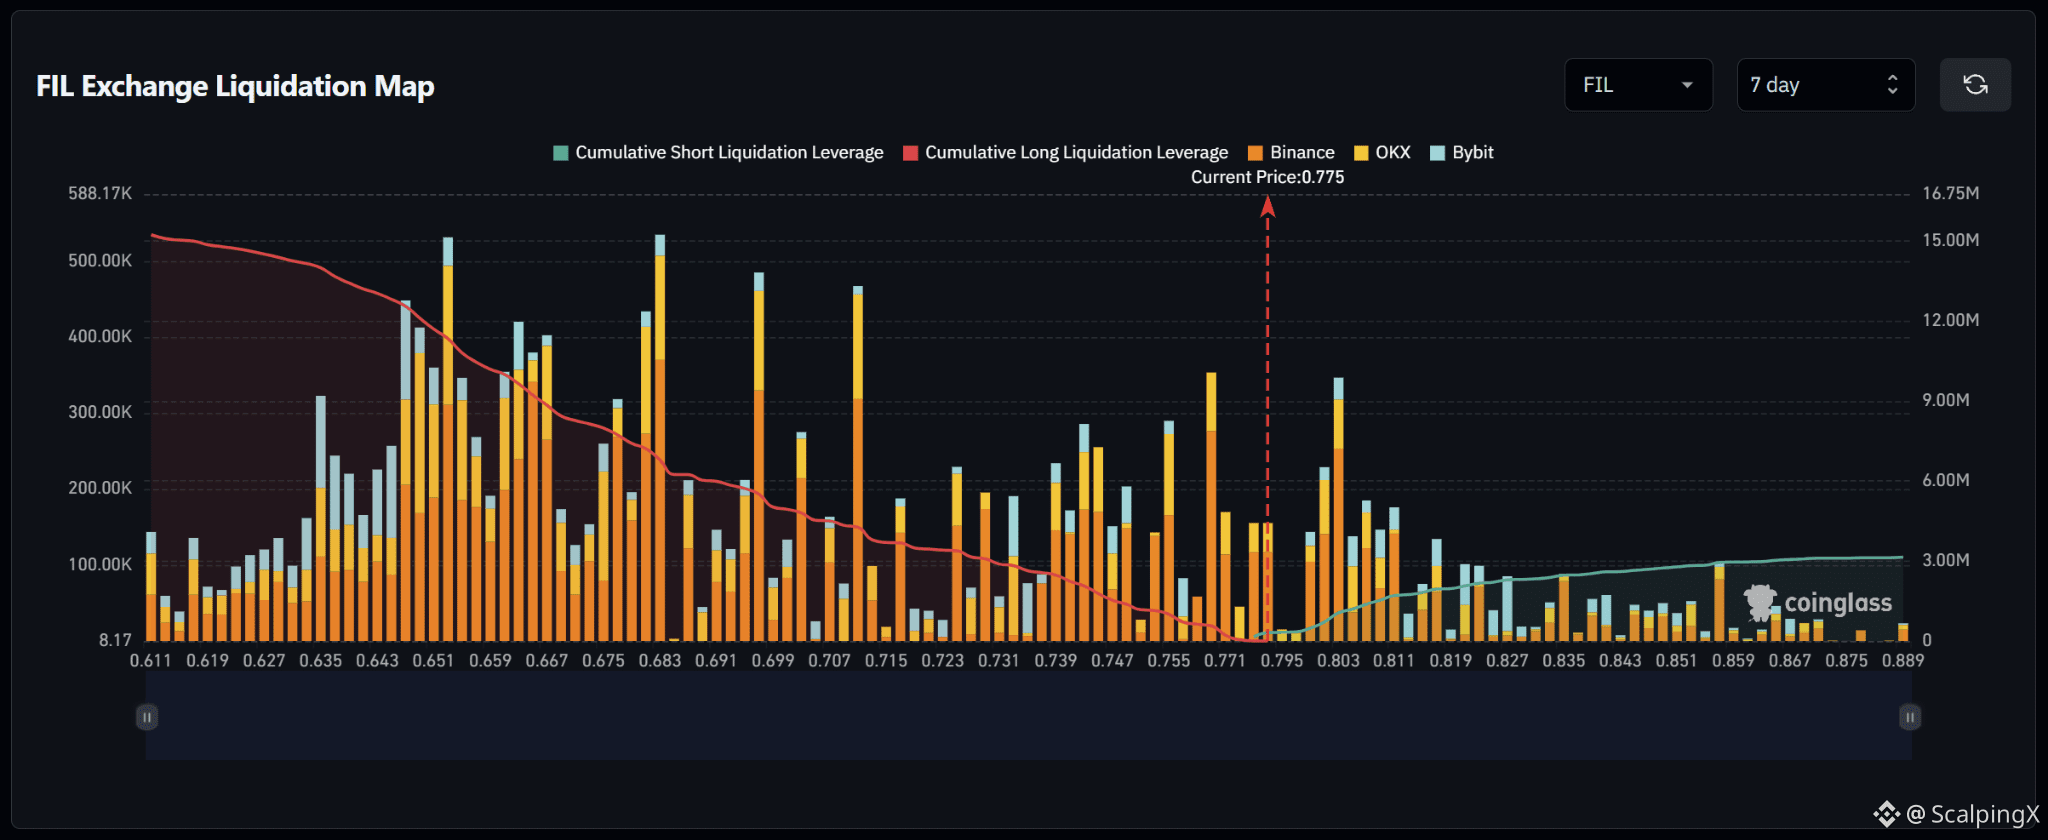
$FIL – Liquidation Map (7 Days) – Current Price 0.775
🔎 The 7-day liquidation map shows roughly $15 million in long liquidations below the current price, around five times the approximately $3 million in short liquidations above. The liquidity structure therefore strongly favors the downside.
📉 Below the market, nearby long-liquidation liquidity is concentrated around 0.771–0.747, with notable clusters near 0.755 and 0.747. Further down, liquidity increases sharply across 0.707–0.683, while 0.667–0.643 contains several large bars around $300,000–530,000. Losing 0.771 would increase the probability of a sweep toward 0.755–0.747.
📈 Above the market, short-liquidation liquidity remains relatively sparse near the current price and becomes more visible from around 0.795. The strongest nearby cluster sits near 0.803, where the liquidation bar reaches roughly $340,000, followed by 0.811–0.819. Further out, upside liquidity becomes significantly lighter.
🧭 The broader setup strongly favors the downside because long-liquidation exposure below is roughly five times larger. Losing 0.771 would increase the probability of a sweep toward 0.755–0.747, while breaking above 0.795 would shift attention toward 0.803–0.811.
#LiquidationMap
$FIL – Liquidation Map (7 Days) – Current Price 0.775
🔎 The 7-day liquidation map shows roughly $15 million in long liquidations below the current price, around five times the approximately $3 million in short liquidations above. The liquidity structure therefore strongly favors the downside.
📉 Below the market, nearby long-liquidation liquidity is concentrated around 0.771–0.747, with notable clusters near 0.755 and 0.747. Further down, liquidity increases sharply across 0.707–0.683, while 0.667–0.643 contains several large bars around $300,000–530,000. Losing 0.771 would increase the probability of a sweep toward 0.755–0.747.
📈 Above the market, short-liquidation liquidity remains relatively sparse near the current price and becomes more visible from around 0.795. The strongest nearby cluster sits near 0.803, where the liquidation bar reaches roughly $340,000, followed by 0.811–0.819. Further out, upside liquidity becomes significantly lighter.
🧭 The broader setup strongly favors the downside because long-liquidation exposure below is roughly five times larger. Losing 0.771 would increase the probability of a sweep toward 0.755–0.747, while breaking above 0.795 would shift attention toward 0.803–0.811.
#LiquidationMap
🔎 The 7-day liquidation map shows roughly $15 million in long liquidations below the current price, around five times the approximately $3 million in short liquidations above. The liquidity structure therefore strongly favors the downside.
📉 Below the market, nearby long-liquidation liquidity is concentrated around 0.771–0.747, with notable clusters near 0.755 and 0.747. Further down, liquidity increases sharply across 0.707–0.683, while 0.667–0.643 contains several large bars around $300,000–530,000. Losing 0.771 would increase the probability of a sweep toward 0.755–0.747.
📈 Above the market, short-liquidation liquidity remains relatively sparse near the current price and becomes more visible from around 0.795. The strongest nearby cluster sits near 0.803, where the liquidation bar reaches roughly $340,000, followed by 0.811–0.819. Further out, upside liquidity becomes significantly lighter.
🧭 The broader setup strongly favors the downside because long-liquidation exposure below is roughly five times larger. Losing 0.771 would increase the probability of a sweep toward 0.755–0.747, while breaking above 0.795 would shift attention toward 0.803–0.811.
#LiquidationMap
25
·
--
Bullish
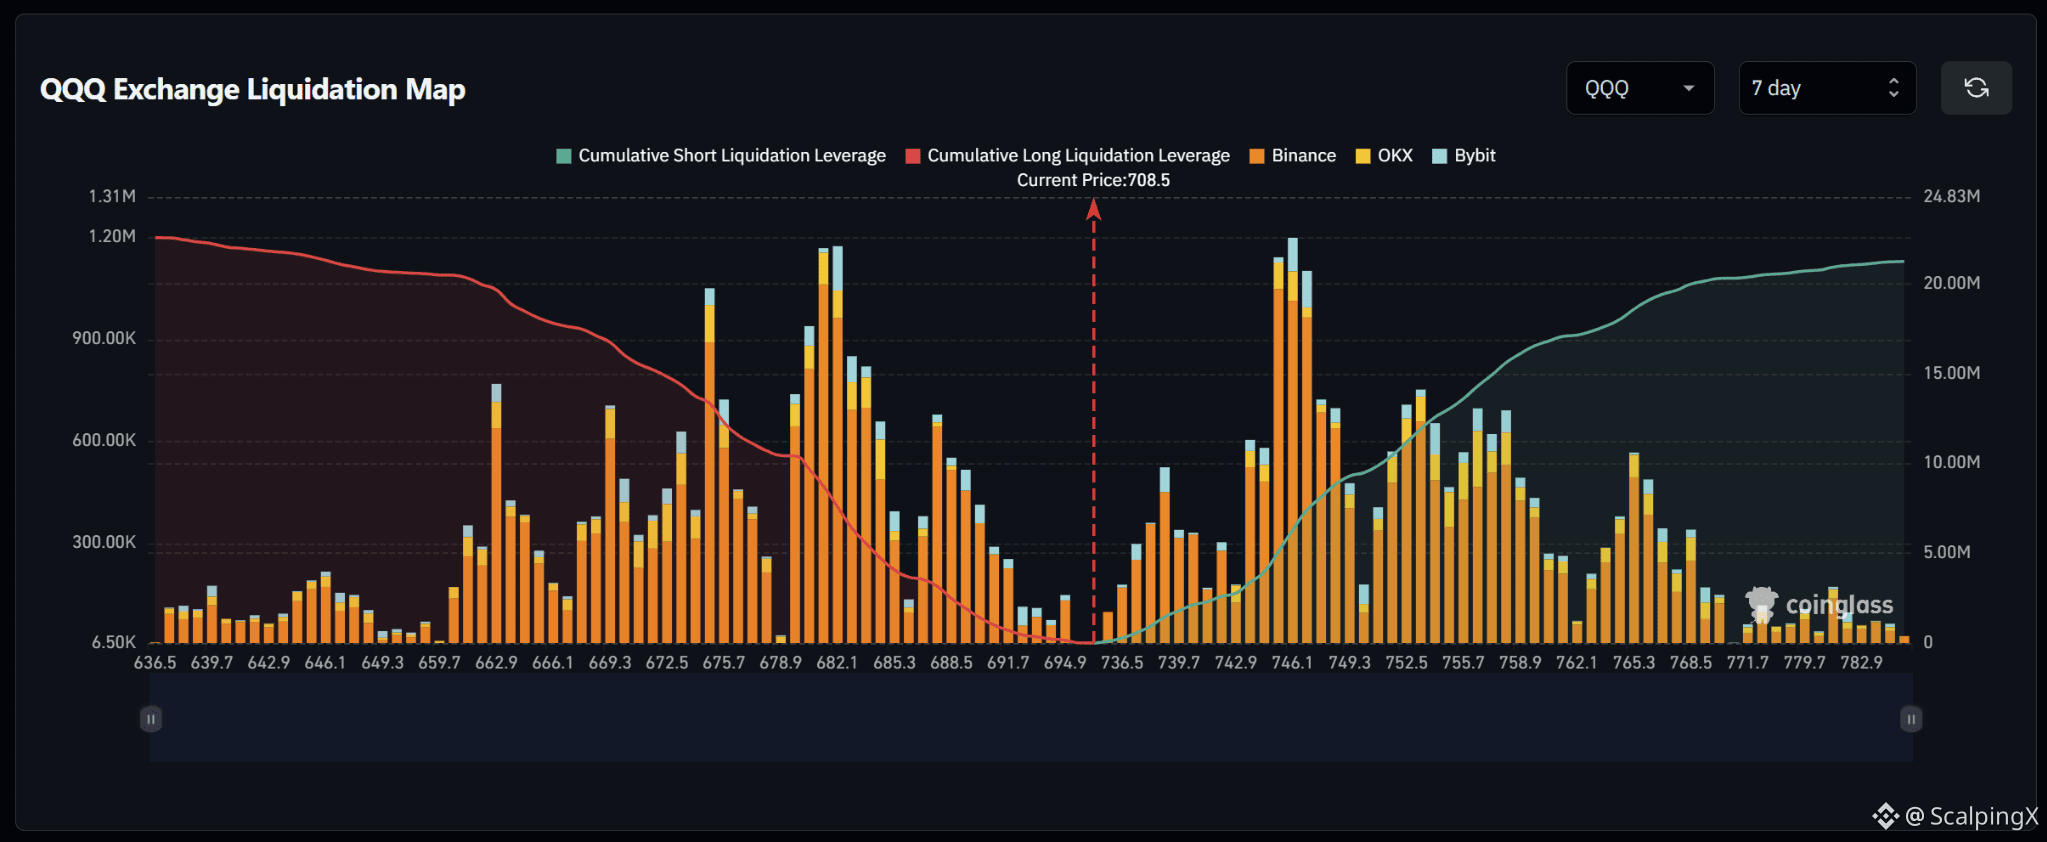
$QQQ – Liquidation Map (7 Days) – Current Price 708.5
🔎 The 7-day liquidation map shows roughly $22 million in long liquidations below the current price, slightly exceeding approximately $21 million in short liquidations above. The overall structure is therefore fairly balanced but modestly tilted to the downside.
📉 Below the market, long-liquidation liquidity is concentrated heavily around 688.5–675.7. The strongest cluster sits near 682.1, where the liquidation bar approaches $1.2 million, while 675.7 and 662.9 also contain large clusters around $700,000–1 million. Losing 694.9 would shift attention toward 688.5–682.1.
📈 Above the market, meaningful short-liquidation liquidity becomes more visible from around 736.5 and increases sharply across 742.9–749.3. The strongest cluster sits near 746.1, where the liquidation bar approaches $1.2 million. Further out, 752.5–758.9 also contains several $500,000–750,000 clusters.
🧭 The broader setup remains relatively balanced but modestly favors the downside. Losing 694.9 would increase the probability of a sweep toward 688.5–682.1, while a move above 736.5 would shift attention toward 742.9–749.3.
#LiquidationMap
$QQQ – Liquidation Map (7 Days) – Current Price 708.5
🔎 The 7-day liquidation map shows roughly $22 million in long liquidations below the current price, slightly exceeding approximately $21 million in short liquidations above. The overall structure is therefore fairly balanced but modestly tilted to the downside.
📉 Below the market, long-liquidation liquidity is concentrated heavily around 688.5–675.7. The strongest cluster sits near 682.1, where the liquidation bar approaches $1.2 million, while 675.7 and 662.9 also contain large clusters around $700,000–1 million. Losing 694.9 would shift attention toward 688.5–682.1.
📈 Above the market, meaningful short-liquidation liquidity becomes more visible from around 736.5 and increases sharply across 742.9–749.3. The strongest cluster sits near 746.1, where the liquidation bar approaches $1.2 million. Further out, 752.5–758.9 also contains several $500,000–750,000 clusters.
🧭 The broader setup remains relatively balanced but modestly favors the downside. Losing 694.9 would increase the probability of a sweep toward 688.5–682.1, while a move above 736.5 would shift attention toward 742.9–749.3.
#LiquidationMap
🔎 The 7-day liquidation map shows roughly $22 million in long liquidations below the current price, slightly exceeding approximately $21 million in short liquidations above. The overall structure is therefore fairly balanced but modestly tilted to the downside.
📉 Below the market, long-liquidation liquidity is concentrated heavily around 688.5–675.7. The strongest cluster sits near 682.1, where the liquidation bar approaches $1.2 million, while 675.7 and 662.9 also contain large clusters around $700,000–1 million. Losing 694.9 would shift attention toward 688.5–682.1.
📈 Above the market, meaningful short-liquidation liquidity becomes more visible from around 736.5 and increases sharply across 742.9–749.3. The strongest cluster sits near 746.1, where the liquidation bar approaches $1.2 million. Further out, 752.5–758.9 also contains several $500,000–750,000 clusters.
🧭 The broader setup remains relatively balanced but modestly favors the downside. Losing 694.9 would increase the probability of a sweep toward 688.5–682.1, while a move above 736.5 would shift attention toward 742.9–749.3.
#LiquidationMap
13
·
--
Bullish
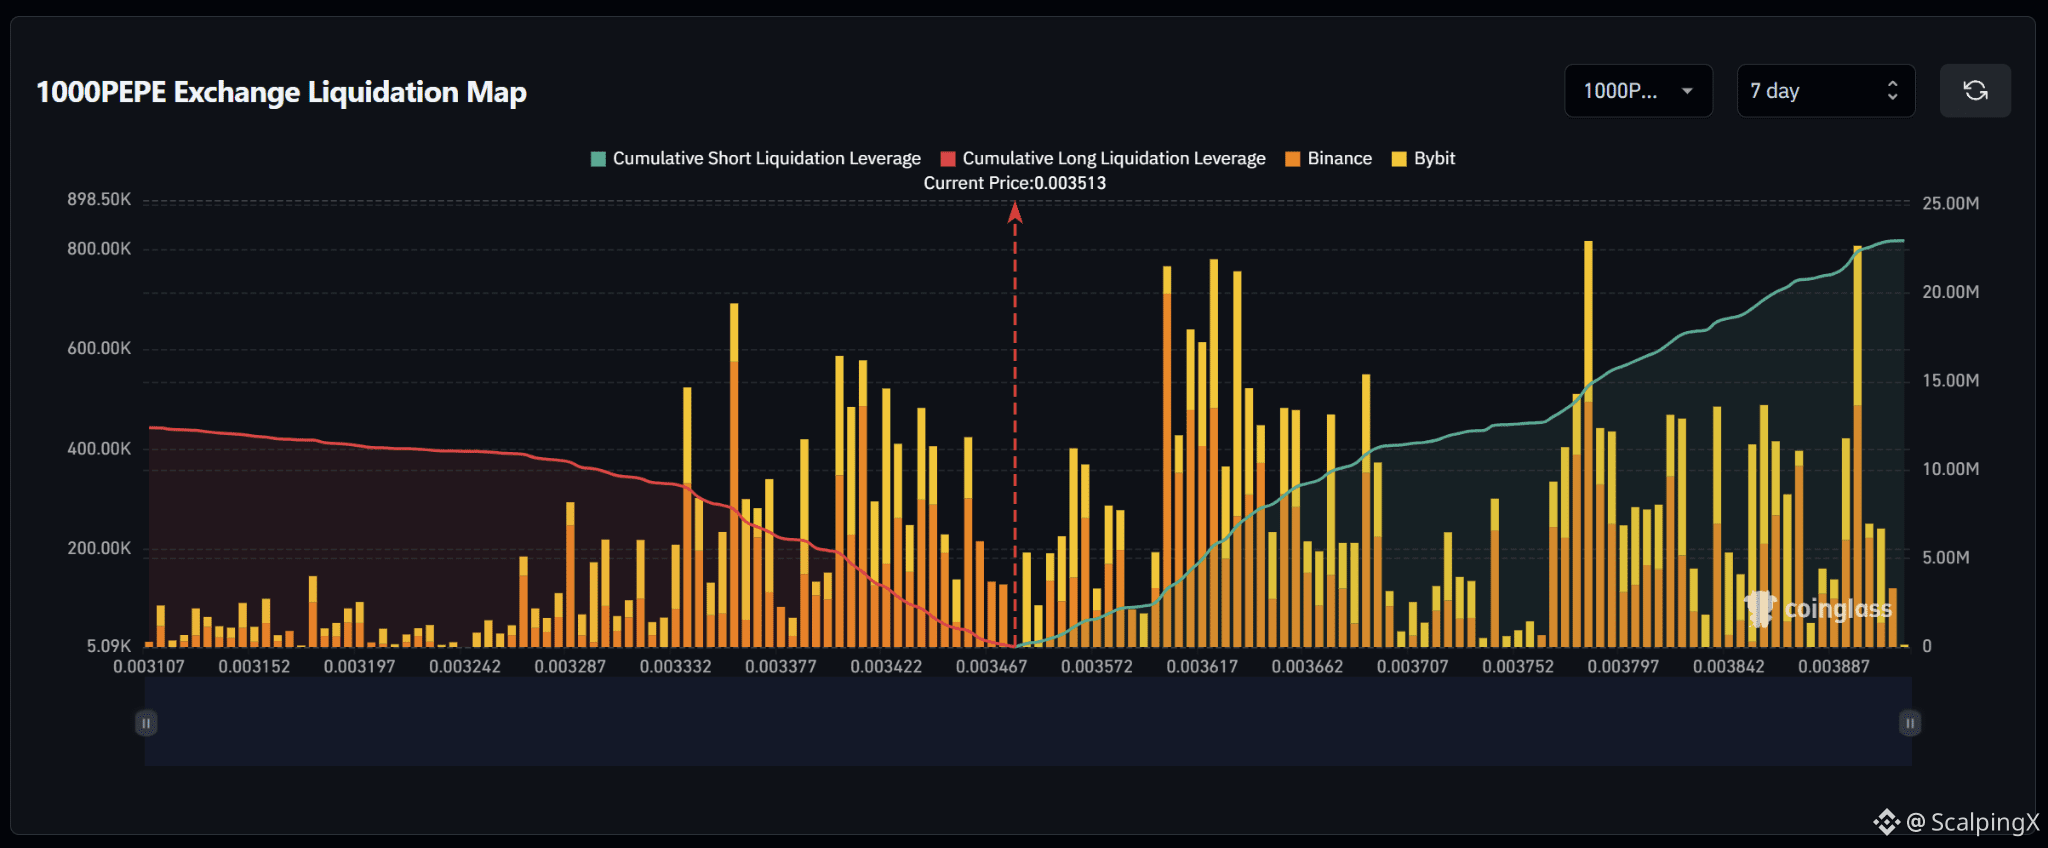
$PEPE – Liquidation Map (7 Days) – Current Price 0.003513
🔎 The 7-day liquidation map shows roughly $22–23 million in short liquidations above the current price, nearly double the approximately $12 million in long liquidations below. The liquidity structure therefore clearly favors the upside, with roughly 1.8–1.9 times more cumulative liquidity above the market.
📉 Below the market, nearby long-liquidation liquidity is concentrated around 0.003467–0.003377. Notable clusters appear around 0.003422–0.003377, with several liquidation bars reaching roughly $400,000–600,000. Further down, the 0.003332 area also contains a large cluster near $500,000. Losing 0.003467 would shift attention toward 0.003422–0.003377.
📈 Above the market, short-liquidation liquidity begins building from around 0.003572 and increases sharply across 0.00360–0.00366, where several bars reach roughly $600,000–780,000. Further out, 0.003797 and 0.003887 stand out with bars near $800,000, forming some of the largest upside clusters.
🧭 The broader setup favors the upside because short-liquidation exposure above is nearly twice as large. Breaking 0.003572 would increase the probability of a sweep toward 0.00360–0.00366, while losing 0.003467 would shift attention toward 0.003422–0.003377.
#LiquidationMap
$PEPE – Liquidation Map (7 Days) – Current Price 0.003513
🔎 The 7-day liquidation map shows roughly $22–23 million in short liquidations above the current price, nearly double the approximately $12 million in long liquidations below. The liquidity structure therefore clearly favors the upside, with roughly 1.8–1.9 times more cumulative liquidity above the market.
📉 Below the market, nearby long-liquidation liquidity is concentrated around 0.003467–0.003377. Notable clusters appear around 0.003422–0.003377, with several liquidation bars reaching roughly $400,000–600,000. Further down, the 0.003332 area also contains a large cluster near $500,000. Losing 0.003467 would shift attention toward 0.003422–0.003377.
📈 Above the market, short-liquidation liquidity begins building from around 0.003572 and increases sharply across 0.00360–0.00366, where several bars reach roughly $600,000–780,000. Further out, 0.003797 and 0.003887 stand out with bars near $800,000, forming some of the largest upside clusters.
🧭 The broader setup favors the upside because short-liquidation exposure above is nearly twice as large. Breaking 0.003572 would increase the probability of a sweep toward 0.00360–0.00366, while losing 0.003467 would shift attention toward 0.003422–0.003377.
#LiquidationMap
🔎 The 7-day liquidation map shows roughly $22–23 million in short liquidations above the current price, nearly double the approximately $12 million in long liquidations below. The liquidity structure therefore clearly favors the upside, with roughly 1.8–1.9 times more cumulative liquidity above the market.
📉 Below the market, nearby long-liquidation liquidity is concentrated around 0.003467–0.003377. Notable clusters appear around 0.003422–0.003377, with several liquidation bars reaching roughly $400,000–600,000. Further down, the 0.003332 area also contains a large cluster near $500,000. Losing 0.003467 would shift attention toward 0.003422–0.003377.
📈 Above the market, short-liquidation liquidity begins building from around 0.003572 and increases sharply across 0.00360–0.00366, where several bars reach roughly $600,000–780,000. Further out, 0.003797 and 0.003887 stand out with bars near $800,000, forming some of the largest upside clusters.
🧭 The broader setup favors the upside because short-liquidation exposure above is nearly twice as large. Breaking 0.003572 would increase the probability of a sweep toward 0.00360–0.00366, while losing 0.003467 would shift attention toward 0.003422–0.003377.
#LiquidationMap
1
22
·
--
Bullish
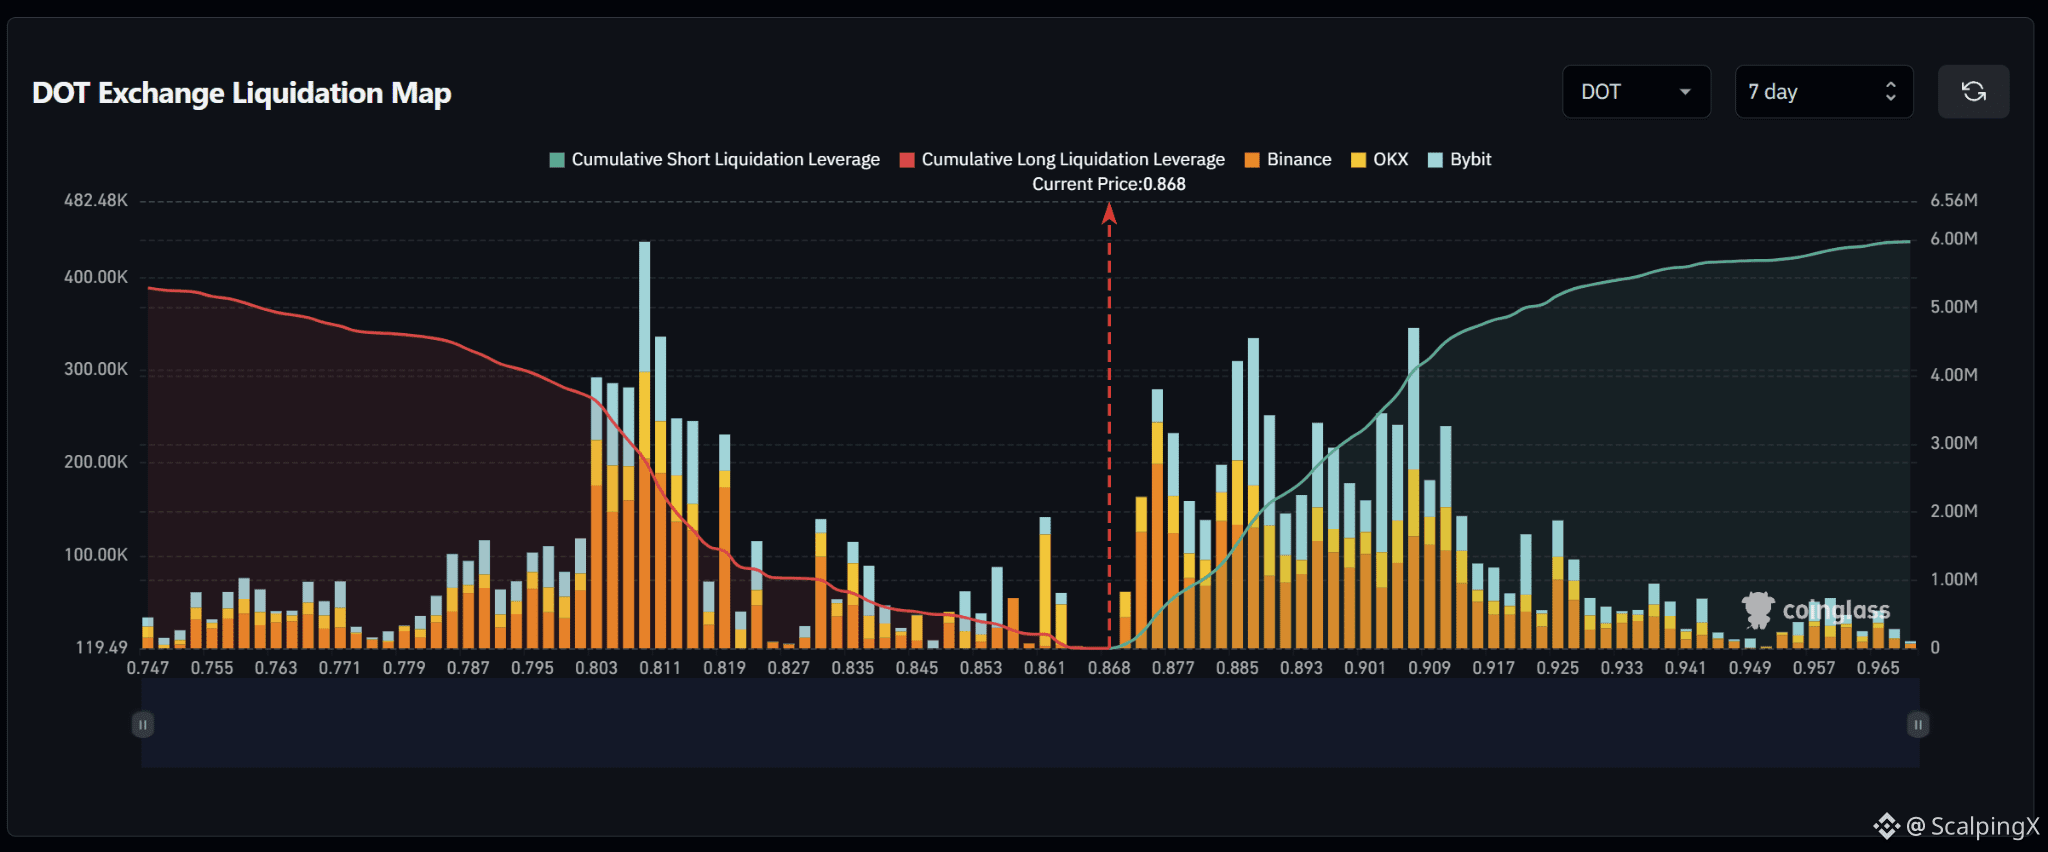
$DOT – Liquidation Map (7 Days) – Current Price 0.868
🔎 The 7-day liquidation map shows roughly $6 million in short liquidations above the current price, slightly exceeding approximately $5.3 million in long liquidations below. The overall structure is therefore fairly balanced but modestly tilted to the upside.
📉 Below the market, nearby long-liquidation liquidity remains relatively thin around 0.861–0.845 before increasing across 0.835–0.803. The strongest cluster sits near 0.811, where the liquidation bar exceeds $400,000, while 0.803–0.819 also contains several $200,000–300,000 clusters. Losing 0.861 would shift attention toward 0.853–0.835.
📈 Above the market, short-liquidation liquidity begins building around 0.877 and becomes much denser across 0.885–0.909. The strongest clusters near 0.885 and 0.909 reach roughly $300,000–350,000. Further out, 0.917–0.925 also contains notable liquidity.
🧭 The broader setup modestly favors the upside because short-liquidation exposure above is larger. Breaking 0.877 would increase the probability of a sweep toward 0.885–0.909, while losing 0.861 would shift attention toward 0.853–0.835.
#LiquidationMap
$DOT – Liquidation Map (7 Days) – Current Price 0.868
🔎 The 7-day liquidation map shows roughly $6 million in short liquidations above the current price, slightly exceeding approximately $5.3 million in long liquidations below. The overall structure is therefore fairly balanced but modestly tilted to the upside.
📉 Below the market, nearby long-liquidation liquidity remains relatively thin around 0.861–0.845 before increasing across 0.835–0.803. The strongest cluster sits near 0.811, where the liquidation bar exceeds $400,000, while 0.803–0.819 also contains several $200,000–300,000 clusters. Losing 0.861 would shift attention toward 0.853–0.835.
📈 Above the market, short-liquidation liquidity begins building around 0.877 and becomes much denser across 0.885–0.909. The strongest clusters near 0.885 and 0.909 reach roughly $300,000–350,000. Further out, 0.917–0.925 also contains notable liquidity.
🧭 The broader setup modestly favors the upside because short-liquidation exposure above is larger. Breaking 0.877 would increase the probability of a sweep toward 0.885–0.909, while losing 0.861 would shift attention toward 0.853–0.835.
#LiquidationMap
🔎 The 7-day liquidation map shows roughly $6 million in short liquidations above the current price, slightly exceeding approximately $5.3 million in long liquidations below. The overall structure is therefore fairly balanced but modestly tilted to the upside.
📉 Below the market, nearby long-liquidation liquidity remains relatively thin around 0.861–0.845 before increasing across 0.835–0.803. The strongest cluster sits near 0.811, where the liquidation bar exceeds $400,000, while 0.803–0.819 also contains several $200,000–300,000 clusters. Losing 0.861 would shift attention toward 0.853–0.835.
📈 Above the market, short-liquidation liquidity begins building around 0.877 and becomes much denser across 0.885–0.909. The strongest clusters near 0.885 and 0.909 reach roughly $300,000–350,000. Further out, 0.917–0.925 also contains notable liquidity.
🧭 The broader setup modestly favors the upside because short-liquidation exposure above is larger. Breaking 0.877 would increase the probability of a sweep toward 0.885–0.909, while losing 0.861 would shift attention toward 0.853–0.835.
#LiquidationMap
35
·
--
Bullish
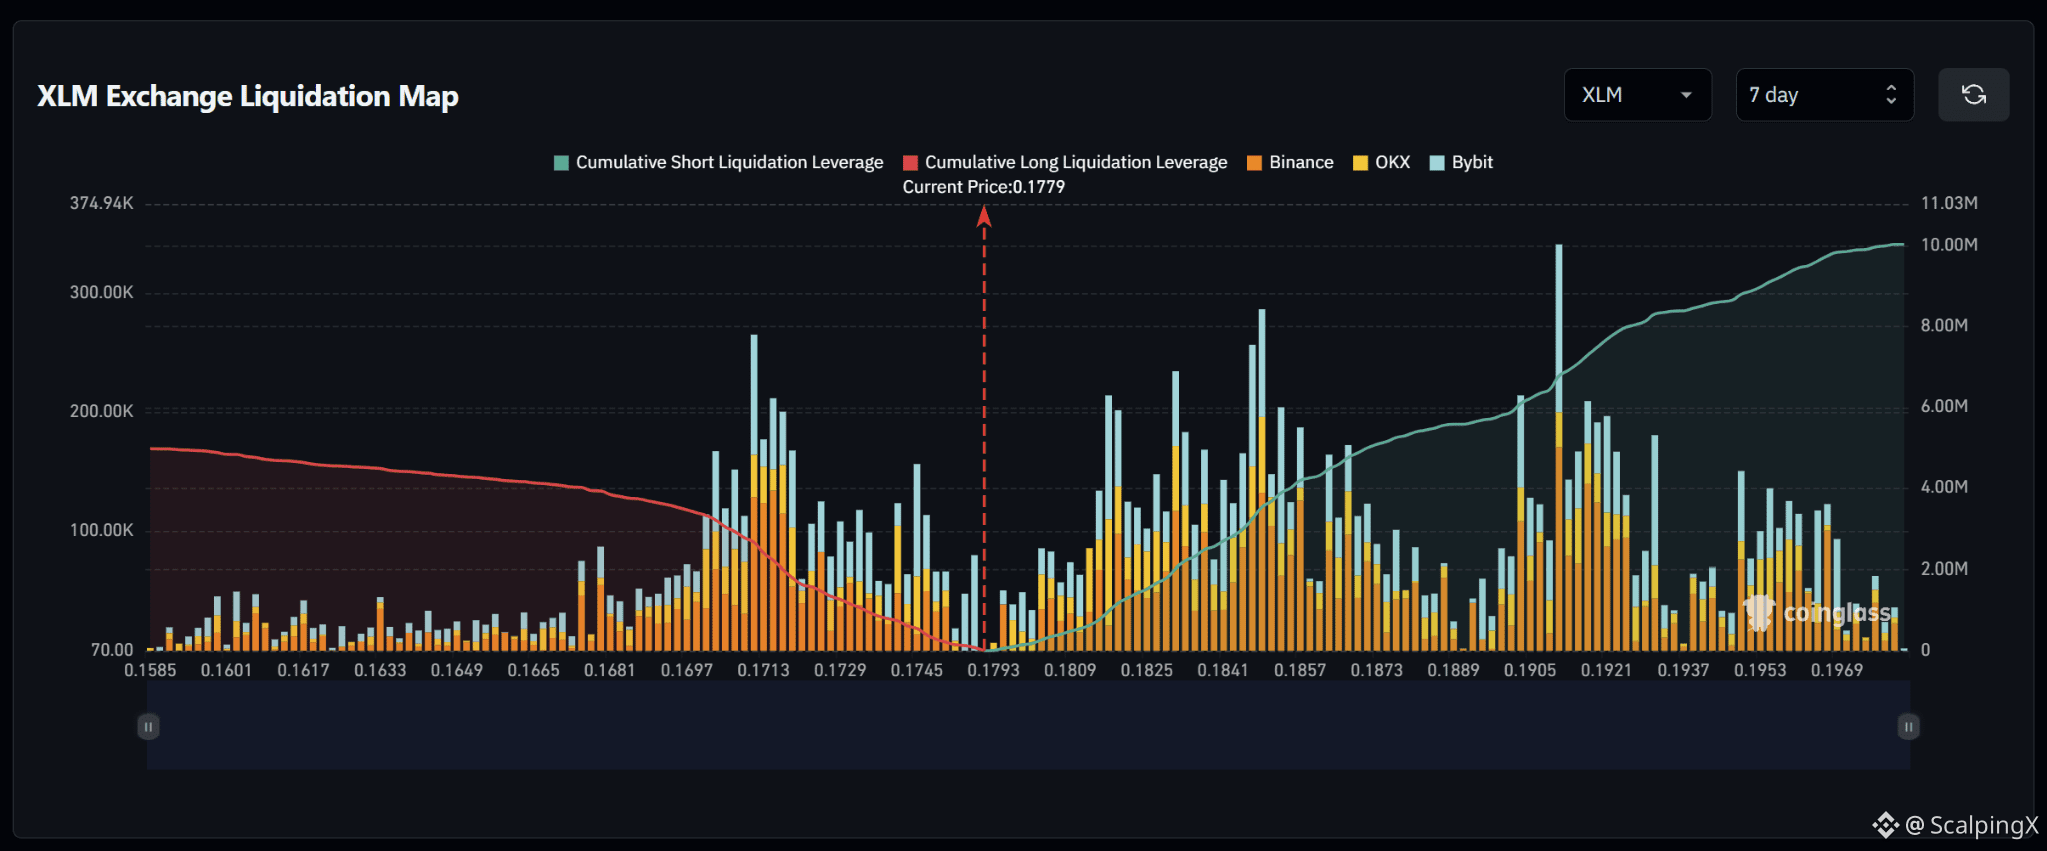
$XLM – Liquidation Map (7 Days) – Current Price 0.1779
🔎 The 7-day liquidation map shows roughly $10 million in short liquidations above the current price, nearly double the approximately $5 million in long liquidations below. The liquidity structure therefore clearly favors the upside.
📉 Below the market, nearby long-liquidation liquidity is concentrated around 0.1745–0.1713. The strongest cluster sits near 0.1713, where the liquidation bar reaches roughly $250,000–270,000, while 0.1697–0.1681 also contains notable liquidity. Losing 0.1745 would increase the probability of a sweep toward 0.1729–0.1713.
📈 Above the market, short-liquidation liquidity begins building around 0.1809 and becomes denser across 0.1825–0.1857. Further out, 0.1905–0.1921 stands out more clearly, with the largest bar near 0.1905 exceeding $300,000. A break above 0.1809 would bring 0.1825–0.1857 into focus first.
🧭 The broader setup favors the upside because short-liquidation exposure above is nearly twice as large. Breaking 0.1809 would increase the probability of a sweep toward 0.1825–0.1857, while losing 0.1745 would shift attention toward 0.1729–0.1713.
#LiquidationMap
$XLM – Liquidation Map (7 Days) – Current Price 0.1779
🔎 The 7-day liquidation map shows roughly $10 million in short liquidations above the current price, nearly double the approximately $5 million in long liquidations below. The liquidity structure therefore clearly favors the upside.
📉 Below the market, nearby long-liquidation liquidity is concentrated around 0.1745–0.1713. The strongest cluster sits near 0.1713, where the liquidation bar reaches roughly $250,000–270,000, while 0.1697–0.1681 also contains notable liquidity. Losing 0.1745 would increase the probability of a sweep toward 0.1729–0.1713.
📈 Above the market, short-liquidation liquidity begins building around 0.1809 and becomes denser across 0.1825–0.1857. Further out, 0.1905–0.1921 stands out more clearly, with the largest bar near 0.1905 exceeding $300,000. A break above 0.1809 would bring 0.1825–0.1857 into focus first.
🧭 The broader setup favors the upside because short-liquidation exposure above is nearly twice as large. Breaking 0.1809 would increase the probability of a sweep toward 0.1825–0.1857, while losing 0.1745 would shift attention toward 0.1729–0.1713.
#LiquidationMap
🔎 The 7-day liquidation map shows roughly $10 million in short liquidations above the current price, nearly double the approximately $5 million in long liquidations below. The liquidity structure therefore clearly favors the upside.
📉 Below the market, nearby long-liquidation liquidity is concentrated around 0.1745–0.1713. The strongest cluster sits near 0.1713, where the liquidation bar reaches roughly $250,000–270,000, while 0.1697–0.1681 also contains notable liquidity. Losing 0.1745 would increase the probability of a sweep toward 0.1729–0.1713.
📈 Above the market, short-liquidation liquidity begins building around 0.1809 and becomes denser across 0.1825–0.1857. Further out, 0.1905–0.1921 stands out more clearly, with the largest bar near 0.1905 exceeding $300,000. A break above 0.1809 would bring 0.1825–0.1857 into focus first.
🧭 The broader setup favors the upside because short-liquidation exposure above is nearly twice as large. Breaking 0.1809 would increase the probability of a sweep toward 0.1825–0.1857, while losing 0.1745 would shift attention toward 0.1729–0.1713.
#LiquidationMap
18
·
--
Bullish
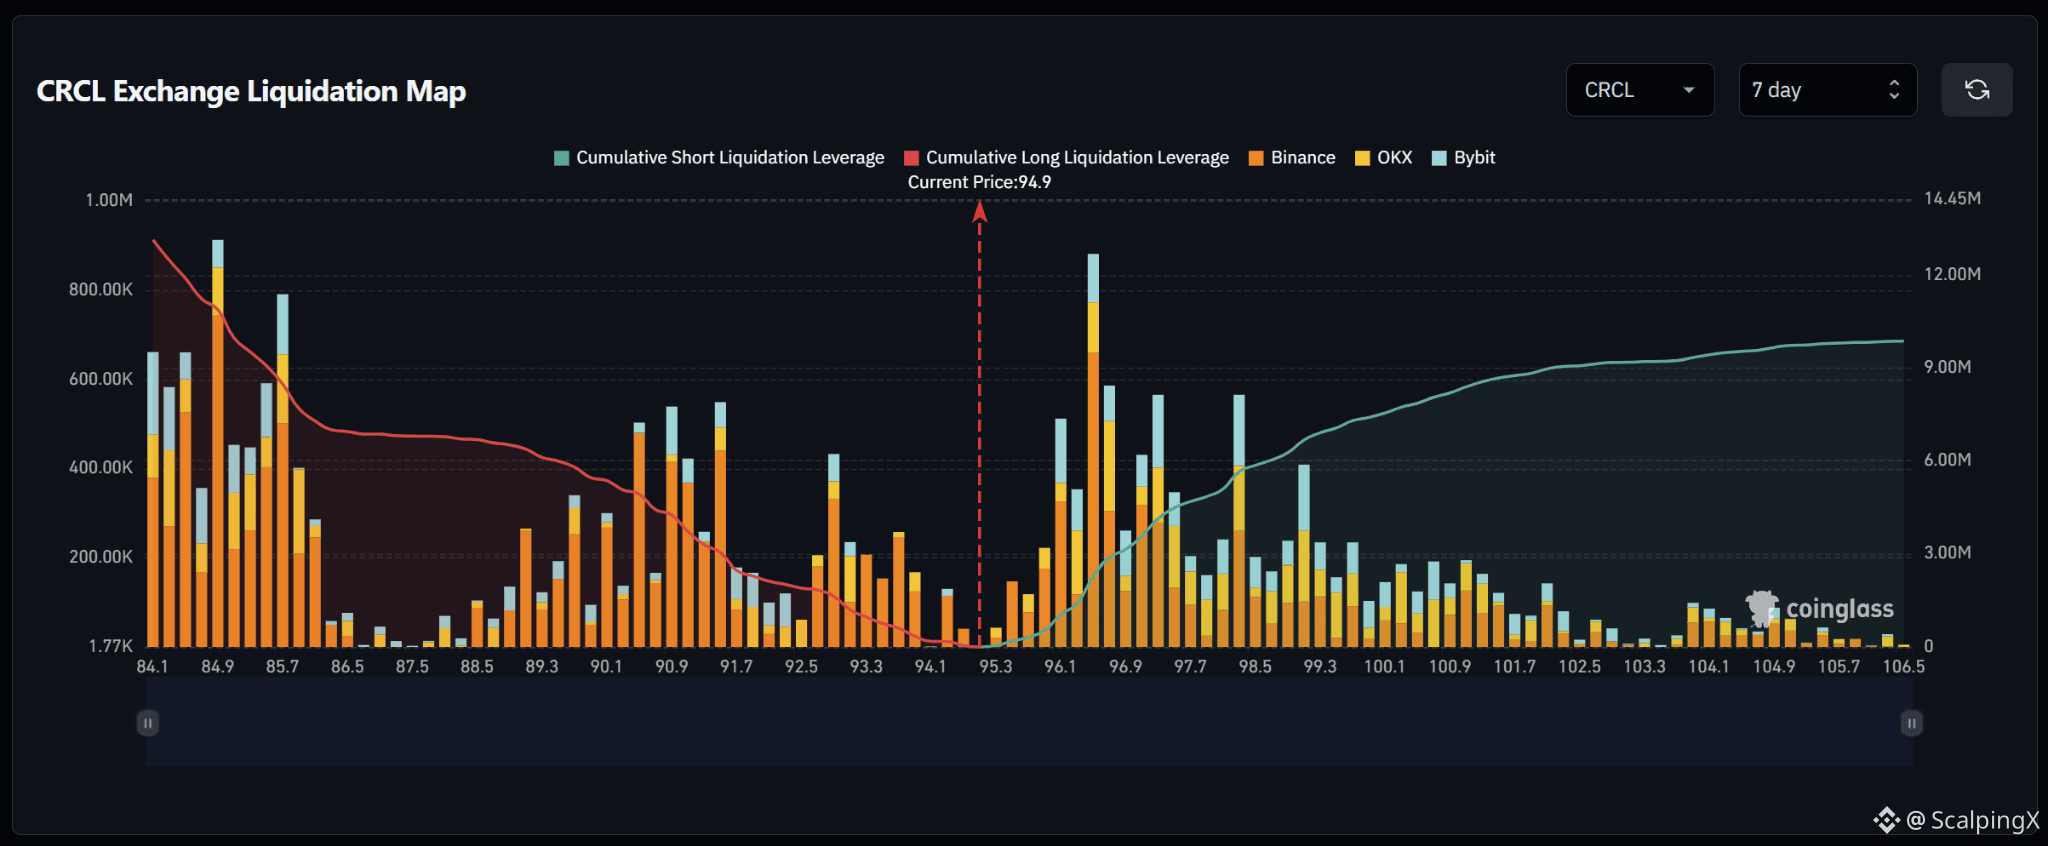
$CRCL – Liquidation Map (7 Days) – Current Price 94.9
🔎 The 7-day liquidation map shows roughly $13 million in long liquidations below the current price, exceeding approximately $9–10 million in short liquidations above. The liquidity structure therefore favors the downside, with roughly 1.3–1.4 times more cumulative liquidity sitting below the market.
📉 Below the market, nearby long-liquidation liquidity remains relatively thin around 94.1 before increasing across 93.3–92.5. Further down, 91.7–90.1 contains several clusters around $300,000–550,000. Losing 94.1 would increase the probability of a sweep toward 93.3–92.5.
📈 Above the market, short-liquidation liquidity begins building around 95.3–96.1 and increases sharply across 96.1–96.9. The strongest nearby cluster sits around 96.5, where the liquidation bar approaches $900,000. Further out, 97.7–99.3 also contains notable liquidity. A break above 95.3 would bring 96.1–96.9 into focus first.
🧭 The broader setup modestly favors the downside because long-liquidation exposure below is roughly 1.3–1.4 times larger. Losing 94.1 would increase the probability of a sweep toward 93.3–92.5, while breaking above 95.3 would shift attention toward 96.1–96.9.
#LiquidationMap
$CRCL – Liquidation Map (7 Days) – Current Price 94.9
🔎 The 7-day liquidation map shows roughly $13 million in long liquidations below the current price, exceeding approximately $9–10 million in short liquidations above. The liquidity structure therefore favors the downside, with roughly 1.3–1.4 times more cumulative liquidity sitting below the market.
📉 Below the market, nearby long-liquidation liquidity remains relatively thin around 94.1 before increasing across 93.3–92.5. Further down, 91.7–90.1 contains several clusters around $300,000–550,000. Losing 94.1 would increase the probability of a sweep toward 93.3–92.5.
📈 Above the market, short-liquidation liquidity begins building around 95.3–96.1 and increases sharply across 96.1–96.9. The strongest nearby cluster sits around 96.5, where the liquidation bar approaches $900,000. Further out, 97.7–99.3 also contains notable liquidity. A break above 95.3 would bring 96.1–96.9 into focus first.
🧭 The broader setup modestly favors the downside because long-liquidation exposure below is roughly 1.3–1.4 times larger. Losing 94.1 would increase the probability of a sweep toward 93.3–92.5, while breaking above 95.3 would shift attention toward 96.1–96.9.
#LiquidationMap
🔎 The 7-day liquidation map shows roughly $13 million in long liquidations below the current price, exceeding approximately $9–10 million in short liquidations above. The liquidity structure therefore favors the downside, with roughly 1.3–1.4 times more cumulative liquidity sitting below the market.
📉 Below the market, nearby long-liquidation liquidity remains relatively thin around 94.1 before increasing across 93.3–92.5. Further down, 91.7–90.1 contains several clusters around $300,000–550,000. Losing 94.1 would increase the probability of a sweep toward 93.3–92.5.
📈 Above the market, short-liquidation liquidity begins building around 95.3–96.1 and increases sharply across 96.1–96.9. The strongest nearby cluster sits around 96.5, where the liquidation bar approaches $900,000. Further out, 97.7–99.3 also contains notable liquidity. A break above 95.3 would bring 96.1–96.9 into focus first.
🧭 The broader setup modestly favors the downside because long-liquidation exposure below is roughly 1.3–1.4 times larger. Losing 94.1 would increase the probability of a sweep toward 93.3–92.5, while breaking above 95.3 would shift attention toward 96.1–96.9.
#LiquidationMap
14
·
--
Bullish
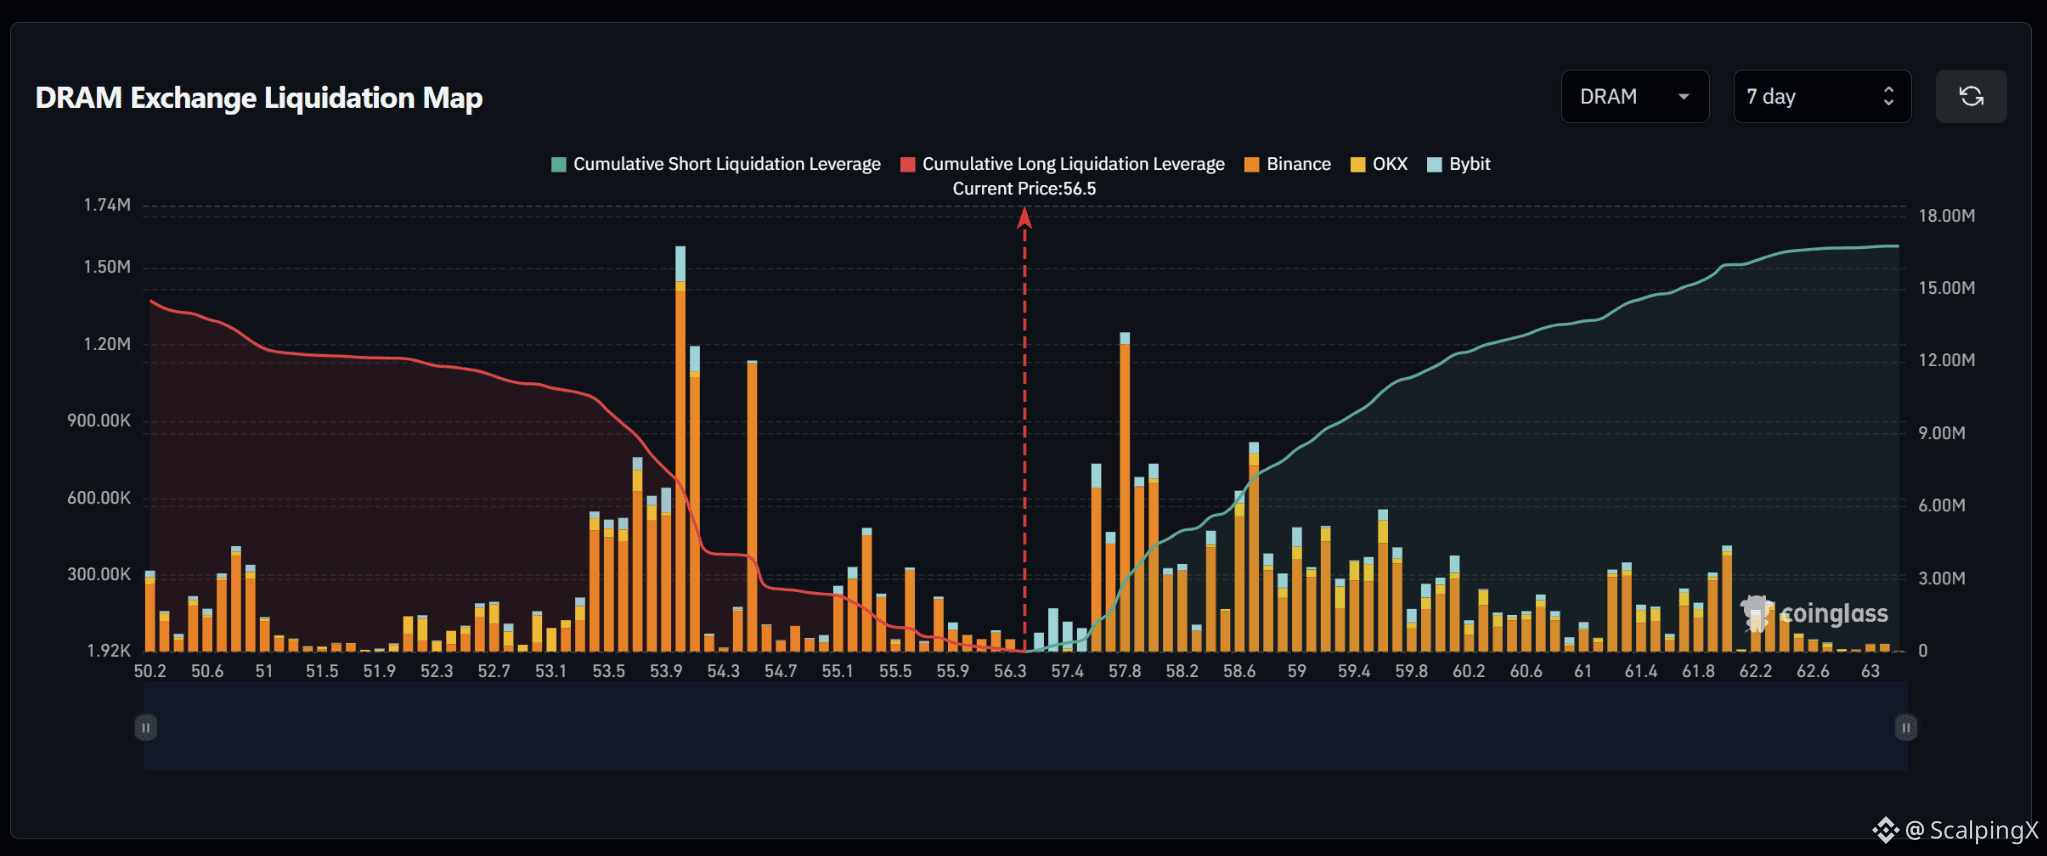
$DRAM – Liquidation Map (7 Days) – Current Price 56.5
🔎 The 7-day liquidation map shows roughly $16 million in short liquidations above the current price, slightly exceeding approximately $14–15 million in long liquidations below. The overall structure is therefore fairly balanced but modestly tilted to the upside.
📉 Below the market, nearby long-liquidation liquidity is concentrated around 55.9–55.1 before becoming much denser across 54.7–53.5. The strongest cluster sits around 53.9–54.3, where the largest liquidation bar reaches roughly $1.6 million. Losing 55.9 would increase the probability of a sweep toward 55.1–54.7 before the larger downside cluster comes into focus.
📈 Above the market, short-liquidation liquidity begins building around 57.4 and increases sharply across 57.8–58.6. The 57.8 cluster stands out with a liquidation bar above $1.2 million, while 58.6 also contains notable liquidity. Further out, 59.0–59.8 continues to hold relatively dense liquidity.
🧭 The broader setup modestly favors the upside because short-liquidation exposure above is larger. Breaking 57.4 would increase the probability of a sweep toward 57.8–58.6, while losing 55.9 would shift attention toward 55.1–54.7.
#LiquidationMap
$DRAM – Liquidation Map (7 Days) – Current Price 56.5
🔎 The 7-day liquidation map shows roughly $16 million in short liquidations above the current price, slightly exceeding approximately $14–15 million in long liquidations below. The overall structure is therefore fairly balanced but modestly tilted to the upside.
📉 Below the market, nearby long-liquidation liquidity is concentrated around 55.9–55.1 before becoming much denser across 54.7–53.5. The strongest cluster sits around 53.9–54.3, where the largest liquidation bar reaches roughly $1.6 million. Losing 55.9 would increase the probability of a sweep toward 55.1–54.7 before the larger downside cluster comes into focus.
📈 Above the market, short-liquidation liquidity begins building around 57.4 and increases sharply across 57.8–58.6. The 57.8 cluster stands out with a liquidation bar above $1.2 million, while 58.6 also contains notable liquidity. Further out, 59.0–59.8 continues to hold relatively dense liquidity.
🧭 The broader setup modestly favors the upside because short-liquidation exposure above is larger. Breaking 57.4 would increase the probability of a sweep toward 57.8–58.6, while losing 55.9 would shift attention toward 55.1–54.7.
#LiquidationMap
🔎 The 7-day liquidation map shows roughly $16 million in short liquidations above the current price, slightly exceeding approximately $14–15 million in long liquidations below. The overall structure is therefore fairly balanced but modestly tilted to the upside.
📉 Below the market, nearby long-liquidation liquidity is concentrated around 55.9–55.1 before becoming much denser across 54.7–53.5. The strongest cluster sits around 53.9–54.3, where the largest liquidation bar reaches roughly $1.6 million. Losing 55.9 would increase the probability of a sweep toward 55.1–54.7 before the larger downside cluster comes into focus.
📈 Above the market, short-liquidation liquidity begins building around 57.4 and increases sharply across 57.8–58.6. The 57.8 cluster stands out with a liquidation bar above $1.2 million, while 58.6 also contains notable liquidity. Further out, 59.0–59.8 continues to hold relatively dense liquidity.
🧭 The broader setup modestly favors the upside because short-liquidation exposure above is larger. Breaking 57.4 would increase the probability of a sweep toward 57.8–58.6, while losing 55.9 would shift attention toward 55.1–54.7.
#LiquidationMap
64
·
--
Bullish
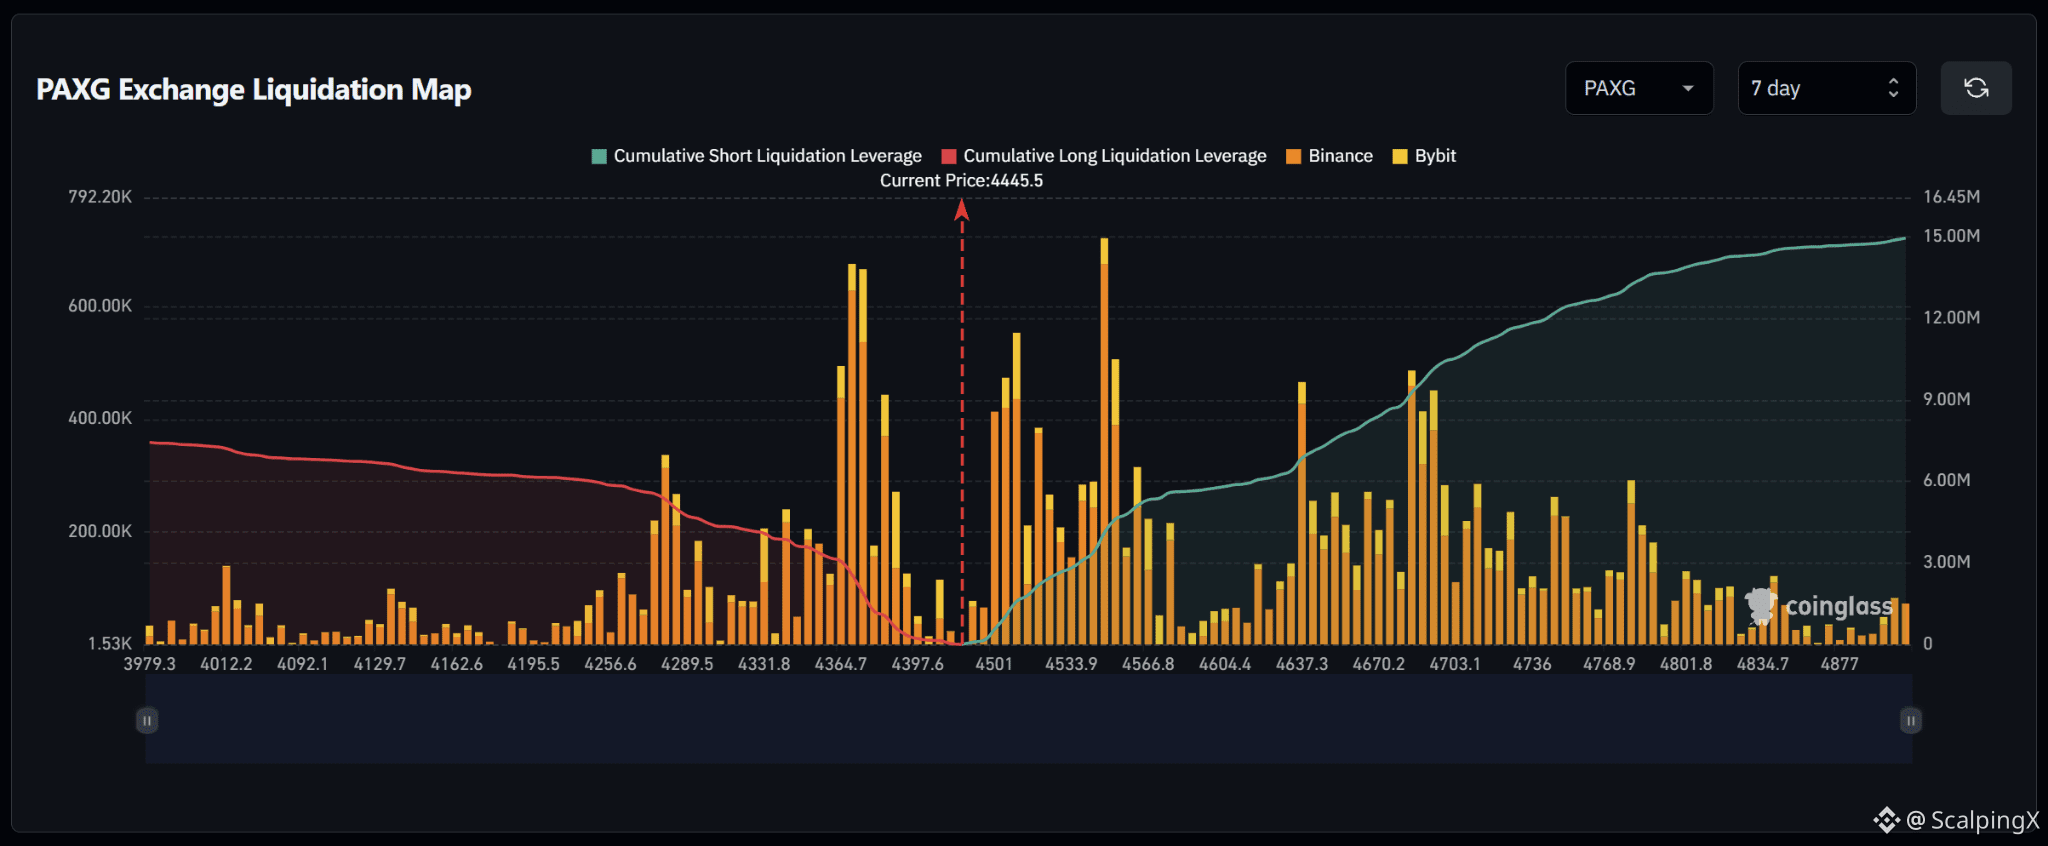
$PAXG – Liquidation Map (7 Days) – Current Price 4,445.5
🔎 The 7-day liquidation map shows roughly $15 million in short liquidations above the current price, significantly exceeding approximately $6.5–7 million in long liquidations below. The liquidity structure therefore clearly favors the upside, with roughly 2.2 times more cumulative liquidity sitting above the market.
📉 Below the market, long-liquidation liquidity is concentrated heavily around 4,397.6–4,364.7. The strongest cluster sits near 4,364.7, where liquidation bars reach roughly $650,000–700,000, while 4,331.8–4,289.5 also contains notable liquidity. Losing 4,397.6 would increase the probability of a sweep toward 4,364.7–4,331.8.
📈 Above the market, short-liquidation liquidity begins building from 4,501 and increases sharply across 4,533.9–4,566.8. The strongest cluster sits around 4,550, where the liquidation bar exceeds $700,000. Further out, 4,637.3–4,703.1 also contains substantial liquidity. A break above 4,501 would bring 4,533.9–4,566.8 into focus next.
🧭 The broader setup favors the upside because short-liquidation exposure above is roughly 2.2 times larger. Breaking 4,501 would increase the probability of a sweep toward 4,533.9–4,566.8, while losing 4,397.6 would shift attention toward 4,364.7–4,331.8.
#LiquidationMap
$PAXG – Liquidation Map (7 Days) – Current Price 4,445.5
🔎 The 7-day liquidation map shows roughly $15 million in short liquidations above the current price, significantly exceeding approximately $6.5–7 million in long liquidations below. The liquidity structure therefore clearly favors the upside, with roughly 2.2 times more cumulative liquidity sitting above the market.
📉 Below the market, long-liquidation liquidity is concentrated heavily around 4,397.6–4,364.7. The strongest cluster sits near 4,364.7, where liquidation bars reach roughly $650,000–700,000, while 4,331.8–4,289.5 also contains notable liquidity. Losing 4,397.6 would increase the probability of a sweep toward 4,364.7–4,331.8.
📈 Above the market, short-liquidation liquidity begins building from 4,501 and increases sharply across 4,533.9–4,566.8. The strongest cluster sits around 4,550, where the liquidation bar exceeds $700,000. Further out, 4,637.3–4,703.1 also contains substantial liquidity. A break above 4,501 would bring 4,533.9–4,566.8 into focus next.
🧭 The broader setup favors the upside because short-liquidation exposure above is roughly 2.2 times larger. Breaking 4,501 would increase the probability of a sweep toward 4,533.9–4,566.8, while losing 4,397.6 would shift attention toward 4,364.7–4,331.8.
#LiquidationMap
🔎 The 7-day liquidation map shows roughly $15 million in short liquidations above the current price, significantly exceeding approximately $6.5–7 million in long liquidations below. The liquidity structure therefore clearly favors the upside, with roughly 2.2 times more cumulative liquidity sitting above the market.
📉 Below the market, long-liquidation liquidity is concentrated heavily around 4,397.6–4,364.7. The strongest cluster sits near 4,364.7, where liquidation bars reach roughly $650,000–700,000, while 4,331.8–4,289.5 also contains notable liquidity. Losing 4,397.6 would increase the probability of a sweep toward 4,364.7–4,331.8.
📈 Above the market, short-liquidation liquidity begins building from 4,501 and increases sharply across 4,533.9–4,566.8. The strongest cluster sits around 4,550, where the liquidation bar exceeds $700,000. Further out, 4,637.3–4,703.1 also contains substantial liquidity. A break above 4,501 would bring 4,533.9–4,566.8 into focus next.
🧭 The broader setup favors the upside because short-liquidation exposure above is roughly 2.2 times larger. Breaking 4,501 would increase the probability of a sweep toward 4,533.9–4,566.8, while losing 4,397.6 would shift attention toward 4,364.7–4,331.8.
#LiquidationMap
20
·
--
Bullish
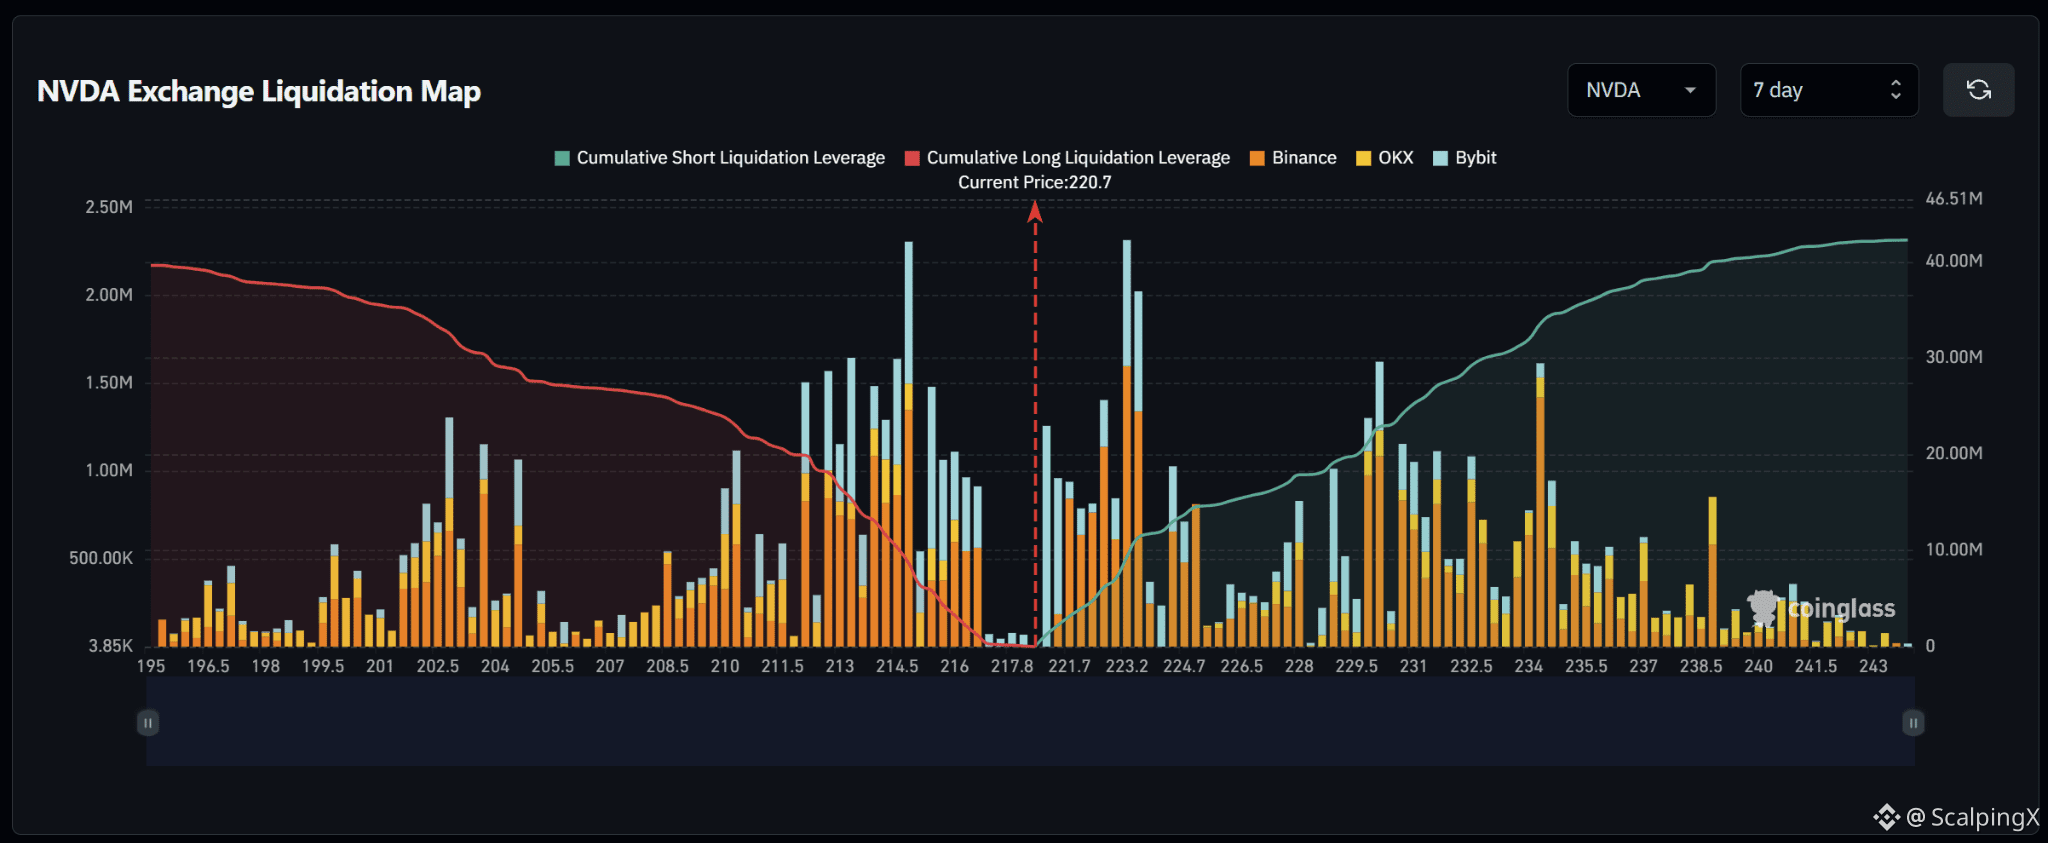
$NVDA – Liquidation Map (7 Days) – Current Price 220.7
🔎 The 7-day liquidation map shows roughly 42 million in short liquidations above the current price, slightly exceeding approximately $40 million in long liquidations below. The overall structure is therefore fairly balanced but modestly tilted to the upside.
📉 Below the market, nearby long-liquidation liquidity is
concentrated around 217.8–214.5. The strongest cluster sits near 214.5, where the liquidation bar exceeds $2.2 million, while 213.0–216.0 also contains substantial liquidity. Losing 217.8 would increase the probability of a sweep toward 216.0–214.5.
📈 Above the market, short-liquidation liquidity begins building around 221.7 and increases sharply across 223.2–224.7. The cluster near 223.2 stands out with a liquidation bar above $2.2 million. Further out, 229.5–234.0 also contains several large clusters. A break above 221.7 would bring 223.2–224.7 into focus first.
🧭 The broader setup remains relatively balanced but modestly favors the upside. Breaking 221.7 would increase the probability of a short-liquidation sweep toward 223.2–224.7, while losing 217.8 would shift attention toward 216.0–214.5.
#LiquidationMap
$NVDA – Liquidation Map (7 Days) – Current Price 220.7
🔎 The 7-day liquidation map shows roughly 42 million in short liquidations above the current price, slightly exceeding approximately $40 million in long liquidations below. The overall structure is therefore fairly balanced but modestly tilted to the upside.
📉 Below the market, nearby long-liquidation liquidity is
concentrated around 217.8–214.5. The strongest cluster sits near 214.5, where the liquidation bar exceeds $2.2 million, while 213.0–216.0 also contains substantial liquidity. Losing 217.8 would increase the probability of a sweep toward 216.0–214.5.
📈 Above the market, short-liquidation liquidity begins building around 221.7 and increases sharply across 223.2–224.7. The cluster near 223.2 stands out with a liquidation bar above $2.2 million. Further out, 229.5–234.0 also contains several large clusters. A break above 221.7 would bring 223.2–224.7 into focus first.
🧭 The broader setup remains relatively balanced but modestly favors the upside. Breaking 221.7 would increase the probability of a short-liquidation sweep toward 223.2–224.7, while losing 217.8 would shift attention toward 216.0–214.5.
#LiquidationMap
🔎 The 7-day liquidation map shows roughly 42 million in short liquidations above the current price, slightly exceeding approximately $40 million in long liquidations below. The overall structure is therefore fairly balanced but modestly tilted to the upside.
📉 Below the market, nearby long-liquidation liquidity is
concentrated around 217.8–214.5. The strongest cluster sits near 214.5, where the liquidation bar exceeds $2.2 million, while 213.0–216.0 also contains substantial liquidity. Losing 217.8 would increase the probability of a sweep toward 216.0–214.5.
📈 Above the market, short-liquidation liquidity begins building around 221.7 and increases sharply across 223.2–224.7. The cluster near 223.2 stands out with a liquidation bar above $2.2 million. Further out, 229.5–234.0 also contains several large clusters. A break above 221.7 would bring 223.2–224.7 into focus first.
🧭 The broader setup remains relatively balanced but modestly favors the upside. Breaking 221.7 would increase the probability of a short-liquidation sweep toward 223.2–224.7, while losing 217.8 would shift attention toward 216.0–214.5.
#LiquidationMap
18
·
--
Bullish
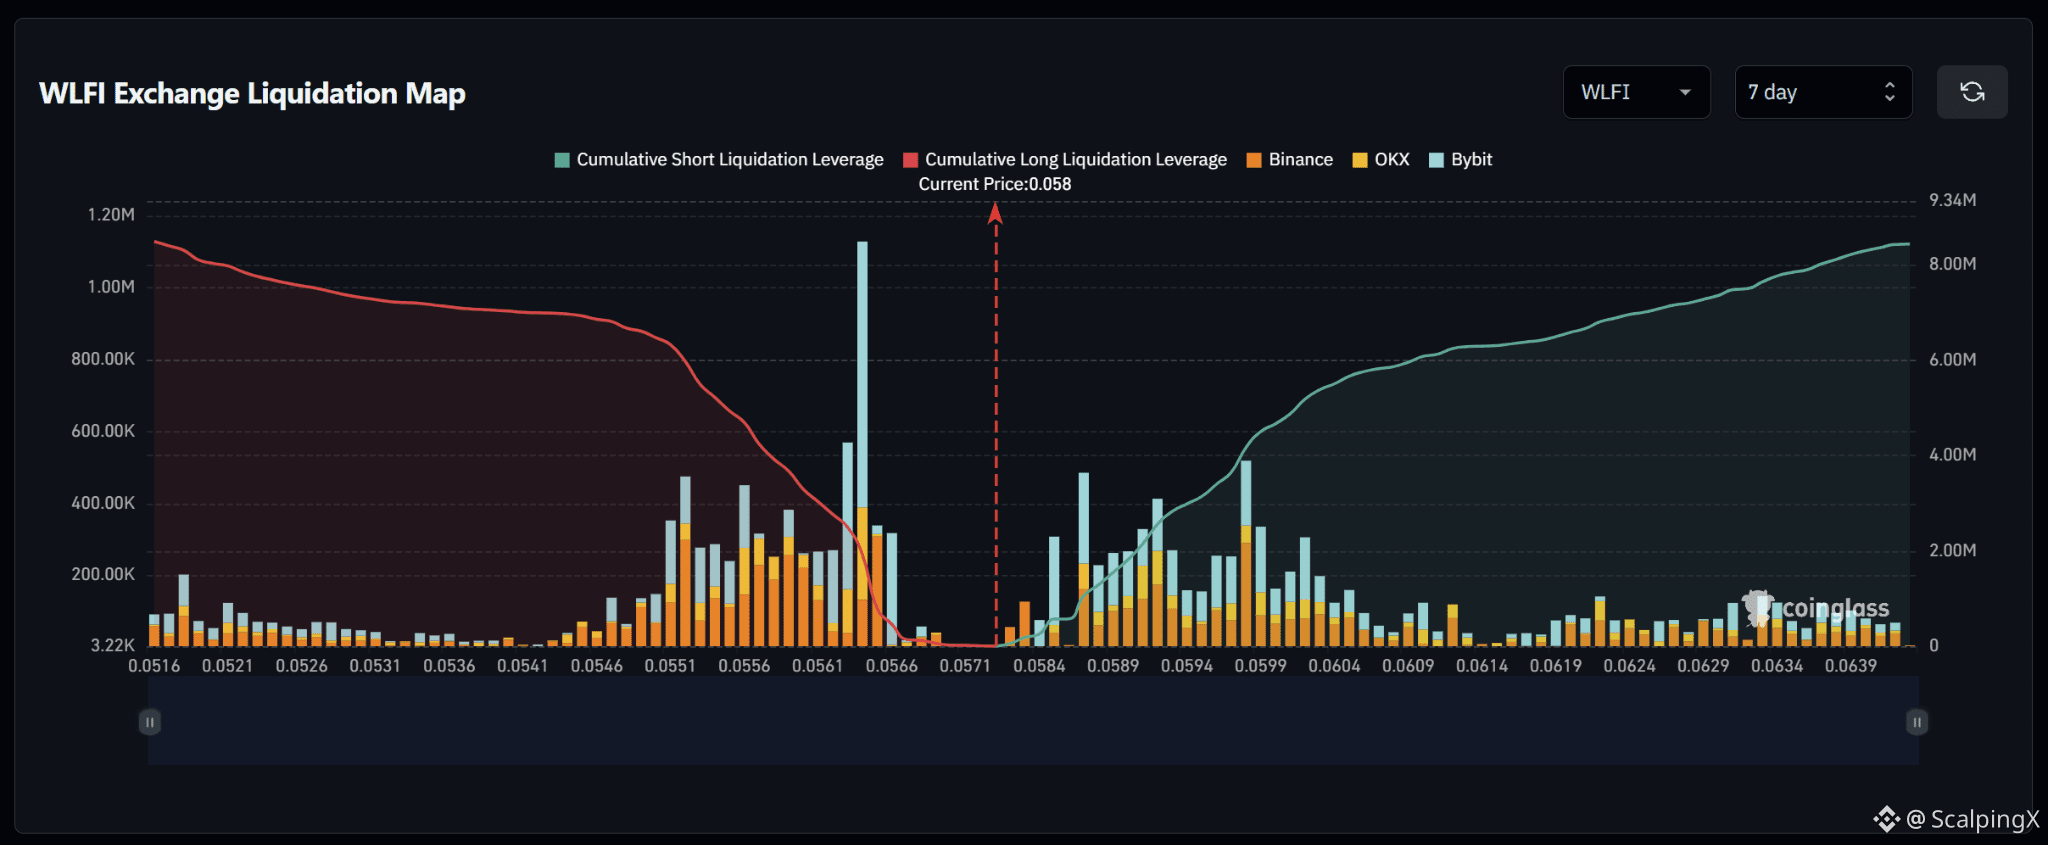
$WLFI – Liquidation Map (7 Days) – Current Price 0.0580
🔎 The 7-day liquidation map shows a fairly balanced liquidity structure, with both long liquidations below and short liquidations above sitting around $8–9 million. The overall setup is therefore close to neutral, without a strong directional imbalance.
📉 Below the market, long-liquidation liquidity is concentrated heavily around 0.0566–0.0551. The strongest cluster sits near 0.0563, where the liquidation bar exceeds 1 million, while 0.0556–0.0551 also contains substantial liquidity. Losing 0.0566 would increase the probability of a sweep toward 0.0561–0.0556.
📈 Above the market, short-liquidation liquidity begins building around 0.0584 and becomes denser across 0.0589–0.0604. The strongest nearby clusters sit around 0.0589 and 0.0599, with liquidation bars reaching roughly $400,000–500,000. A break above 0.0584 would bring 0.0589–0.0599 into focus first.
🧭 The broader setup remains relatively balanced. Breaking 0.0584 would increase the probability of a short-liquidation sweep toward 0.0589–0.0599, while losing 0.0566 would shift attention toward 0.0561–0.0556.
#LiquidationMap
$WLFI – Liquidation Map (7 Days) – Current Price 0.0580
🔎 The 7-day liquidation map shows a fairly balanced liquidity structure, with both long liquidations below and short liquidations above sitting around $8–9 million. The overall setup is therefore close to neutral, without a strong directional imbalance.
📉 Below the market, long-liquidation liquidity is concentrated heavily around 0.0566–0.0551. The strongest cluster sits near 0.0563, where the liquidation bar exceeds 1 million, while 0.0556–0.0551 also contains substantial liquidity. Losing 0.0566 would increase the probability of a sweep toward 0.0561–0.0556.
📈 Above the market, short-liquidation liquidity begins building around 0.0584 and becomes denser across 0.0589–0.0604. The strongest nearby clusters sit around 0.0589 and 0.0599, with liquidation bars reaching roughly $400,000–500,000. A break above 0.0584 would bring 0.0589–0.0599 into focus first.
🧭 The broader setup remains relatively balanced. Breaking 0.0584 would increase the probability of a short-liquidation sweep toward 0.0589–0.0599, while losing 0.0566 would shift attention toward 0.0561–0.0556.
#LiquidationMap
🔎 The 7-day liquidation map shows a fairly balanced liquidity structure, with both long liquidations below and short liquidations above sitting around $8–9 million. The overall setup is therefore close to neutral, without a strong directional imbalance.
📉 Below the market, long-liquidation liquidity is concentrated heavily around 0.0566–0.0551. The strongest cluster sits near 0.0563, where the liquidation bar exceeds 1 million, while 0.0556–0.0551 also contains substantial liquidity. Losing 0.0566 would increase the probability of a sweep toward 0.0561–0.0556.
📈 Above the market, short-liquidation liquidity begins building around 0.0584 and becomes denser across 0.0589–0.0604. The strongest nearby clusters sit around 0.0589 and 0.0599, with liquidation bars reaching roughly $400,000–500,000. A break above 0.0584 would bring 0.0589–0.0599 into focus first.
🧭 The broader setup remains relatively balanced. Breaking 0.0584 would increase the probability of a short-liquidation sweep toward 0.0589–0.0599, while losing 0.0566 would shift attention toward 0.0561–0.0556.
#LiquidationMap
8
·
--
Bullish
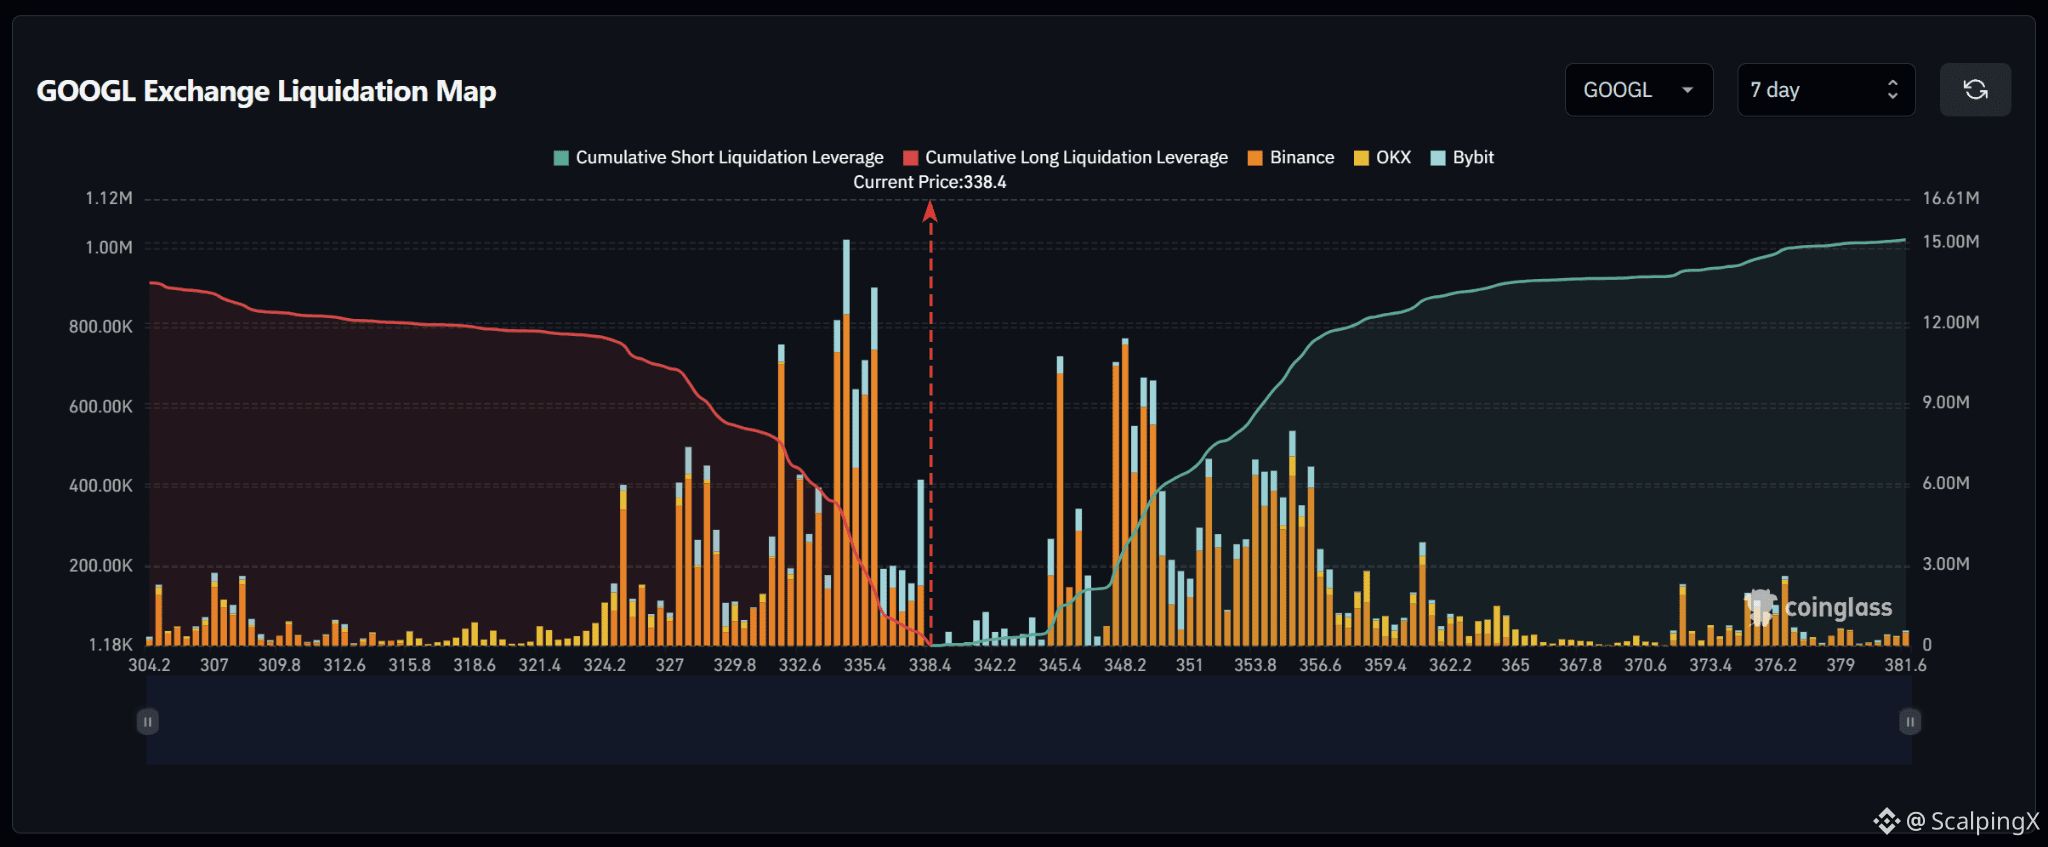
$GOOGL – Liquidation Map (7 Days) – Current Price 338.4
🔎 The 7-day liquidation map shows roughly $15 million in short liquidations above the current price, slightly exceeding approximately $13 million in long liquidations below. The overall structure is therefore fairly balanced but modestly tilted to the upside, with about 1.15 times more cumulative liquidity above the market.
📉 Below the market, long-liquidation liquidity is concentrated heavily around 335.4–332.6. The strongest clusters sit near 335.4 and 334.0, where liquidation bars approach $900,000–1 million, while 332.6 also contains notable liquidity. Losing 335.4 would increase the probability of a sweep toward 334.0–332.6.
📈 Above the market, liquidity remains relatively thin between 338.4 and 342.2 before short-liquidation exposure increases sharply from 345.4. Strong clusters appear around 345.4 and 348.2–351.0, with several bars reaching roughly $600,000–800,000. A break above 342.2 would bring 345.4–348.2 into focus next.
🧭 The broader setup modestly favors the upside because short-liquidation exposure above is larger. Breaking 342.2 would increase the probability of a sweep toward 345.4–348.2, while losing 335.4 would shift attention toward 334.0–332.6.
#LiquidationMap
$GOOGL – Liquidation Map (7 Days) – Current Price 338.4
🔎 The 7-day liquidation map shows roughly $15 million in short liquidations above the current price, slightly exceeding approximately $13 million in long liquidations below. The overall structure is therefore fairly balanced but modestly tilted to the upside, with about 1.15 times more cumulative liquidity above the market.
📉 Below the market, long-liquidation liquidity is concentrated heavily around 335.4–332.6. The strongest clusters sit near 335.4 and 334.0, where liquidation bars approach $900,000–1 million, while 332.6 also contains notable liquidity. Losing 335.4 would increase the probability of a sweep toward 334.0–332.6.
📈 Above the market, liquidity remains relatively thin between 338.4 and 342.2 before short-liquidation exposure increases sharply from 345.4. Strong clusters appear around 345.4 and 348.2–351.0, with several bars reaching roughly $600,000–800,000. A break above 342.2 would bring 345.4–348.2 into focus next.
🧭 The broader setup modestly favors the upside because short-liquidation exposure above is larger. Breaking 342.2 would increase the probability of a sweep toward 345.4–348.2, while losing 335.4 would shift attention toward 334.0–332.6.
#LiquidationMap
🔎 The 7-day liquidation map shows roughly $15 million in short liquidations above the current price, slightly exceeding approximately $13 million in long liquidations below. The overall structure is therefore fairly balanced but modestly tilted to the upside, with about 1.15 times more cumulative liquidity above the market.
📉 Below the market, long-liquidation liquidity is concentrated heavily around 335.4–332.6. The strongest clusters sit near 335.4 and 334.0, where liquidation bars approach $900,000–1 million, while 332.6 also contains notable liquidity. Losing 335.4 would increase the probability of a sweep toward 334.0–332.6.
📈 Above the market, liquidity remains relatively thin between 338.4 and 342.2 before short-liquidation exposure increases sharply from 345.4. Strong clusters appear around 345.4 and 348.2–351.0, with several bars reaching roughly $600,000–800,000. A break above 342.2 would bring 345.4–348.2 into focus next.
🧭 The broader setup modestly favors the upside because short-liquidation exposure above is larger. Breaking 342.2 would increase the probability of a sweep toward 345.4–348.2, while losing 335.4 would shift attention toward 334.0–332.6.
#LiquidationMap
21
·
--
Bullish
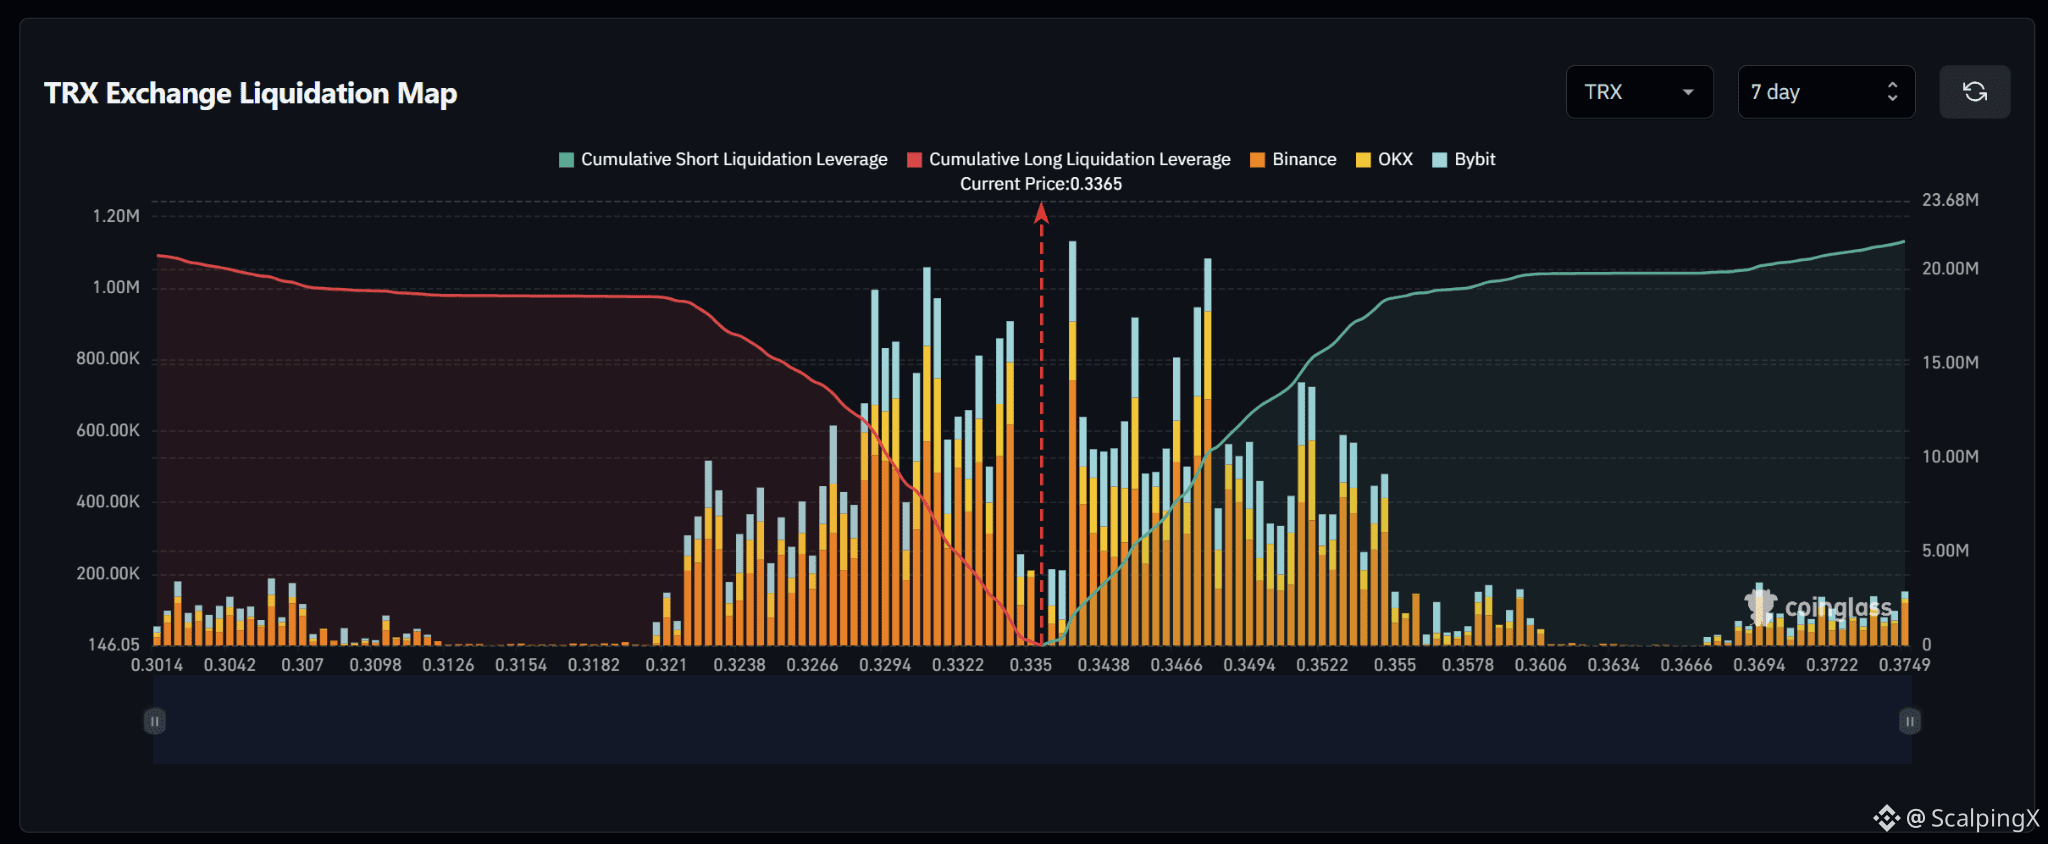
$TRX – Liquidation Map (7 Days) – Current Price 0.3365
🔎 The 7-day liquidation map shows a fairly balanced liquidity structure, with roughly $21–22 million in short liquidations above the current price and around $21 million in long liquidations below. The overall setup is therefore close to neutral but modestly tilted to the upside.
📉 Below the market, nearby long-liquidation liquidity is concentrated heavily around 0.3332–0.3294. Several liquidation bars in this zone reach roughly $800,000–1 million, while 0.3266–0.3238 also contains notable liquidity. Losing 0.3350 would increase the probability of a sweep toward 0.3332–0.3294.
📈 Above the market, short-liquidation liquidity begins building sharply around 0.3438–0.3494. The strongest clusters sit near 0.3438 and 0.3466–0.3494, with several bars exceeding 1 million. Further out, 0.3522–0.3550 also contains notable liquidity.
🧭 The broader setup is relatively balanced but modestly favors the upside. Breaking 0.3438 would increase the probability of a sweep toward 0.3466–0.3494, while losing 0.3350 would shift attention toward 0.3332–0.3294.
#LiquidationMap
$TRX – Liquidation Map (7 Days) – Current Price 0.3365
🔎 The 7-day liquidation map shows a fairly balanced liquidity structure, with roughly $21–22 million in short liquidations above the current price and around $21 million in long liquidations below. The overall setup is therefore close to neutral but modestly tilted to the upside.
📉 Below the market, nearby long-liquidation liquidity is concentrated heavily around 0.3332–0.3294. Several liquidation bars in this zone reach roughly $800,000–1 million, while 0.3266–0.3238 also contains notable liquidity. Losing 0.3350 would increase the probability of a sweep toward 0.3332–0.3294.
📈 Above the market, short-liquidation liquidity begins building sharply around 0.3438–0.3494. The strongest clusters sit near 0.3438 and 0.3466–0.3494, with several bars exceeding 1 million. Further out, 0.3522–0.3550 also contains notable liquidity.
🧭 The broader setup is relatively balanced but modestly favors the upside. Breaking 0.3438 would increase the probability of a sweep toward 0.3466–0.3494, while losing 0.3350 would shift attention toward 0.3332–0.3294.
#LiquidationMap
🔎 The 7-day liquidation map shows a fairly balanced liquidity structure, with roughly $21–22 million in short liquidations above the current price and around $21 million in long liquidations below. The overall setup is therefore close to neutral but modestly tilted to the upside.
📉 Below the market, nearby long-liquidation liquidity is concentrated heavily around 0.3332–0.3294. Several liquidation bars in this zone reach roughly $800,000–1 million, while 0.3266–0.3238 also contains notable liquidity. Losing 0.3350 would increase the probability of a sweep toward 0.3332–0.3294.
📈 Above the market, short-liquidation liquidity begins building sharply around 0.3438–0.3494. The strongest clusters sit near 0.3438 and 0.3466–0.3494, with several bars exceeding 1 million. Further out, 0.3522–0.3550 also contains notable liquidity.
🧭 The broader setup is relatively balanced but modestly favors the upside. Breaking 0.3438 would increase the probability of a sweep toward 0.3466–0.3494, while losing 0.3350 would shift attention toward 0.3332–0.3294.
#LiquidationMap
17
·
--
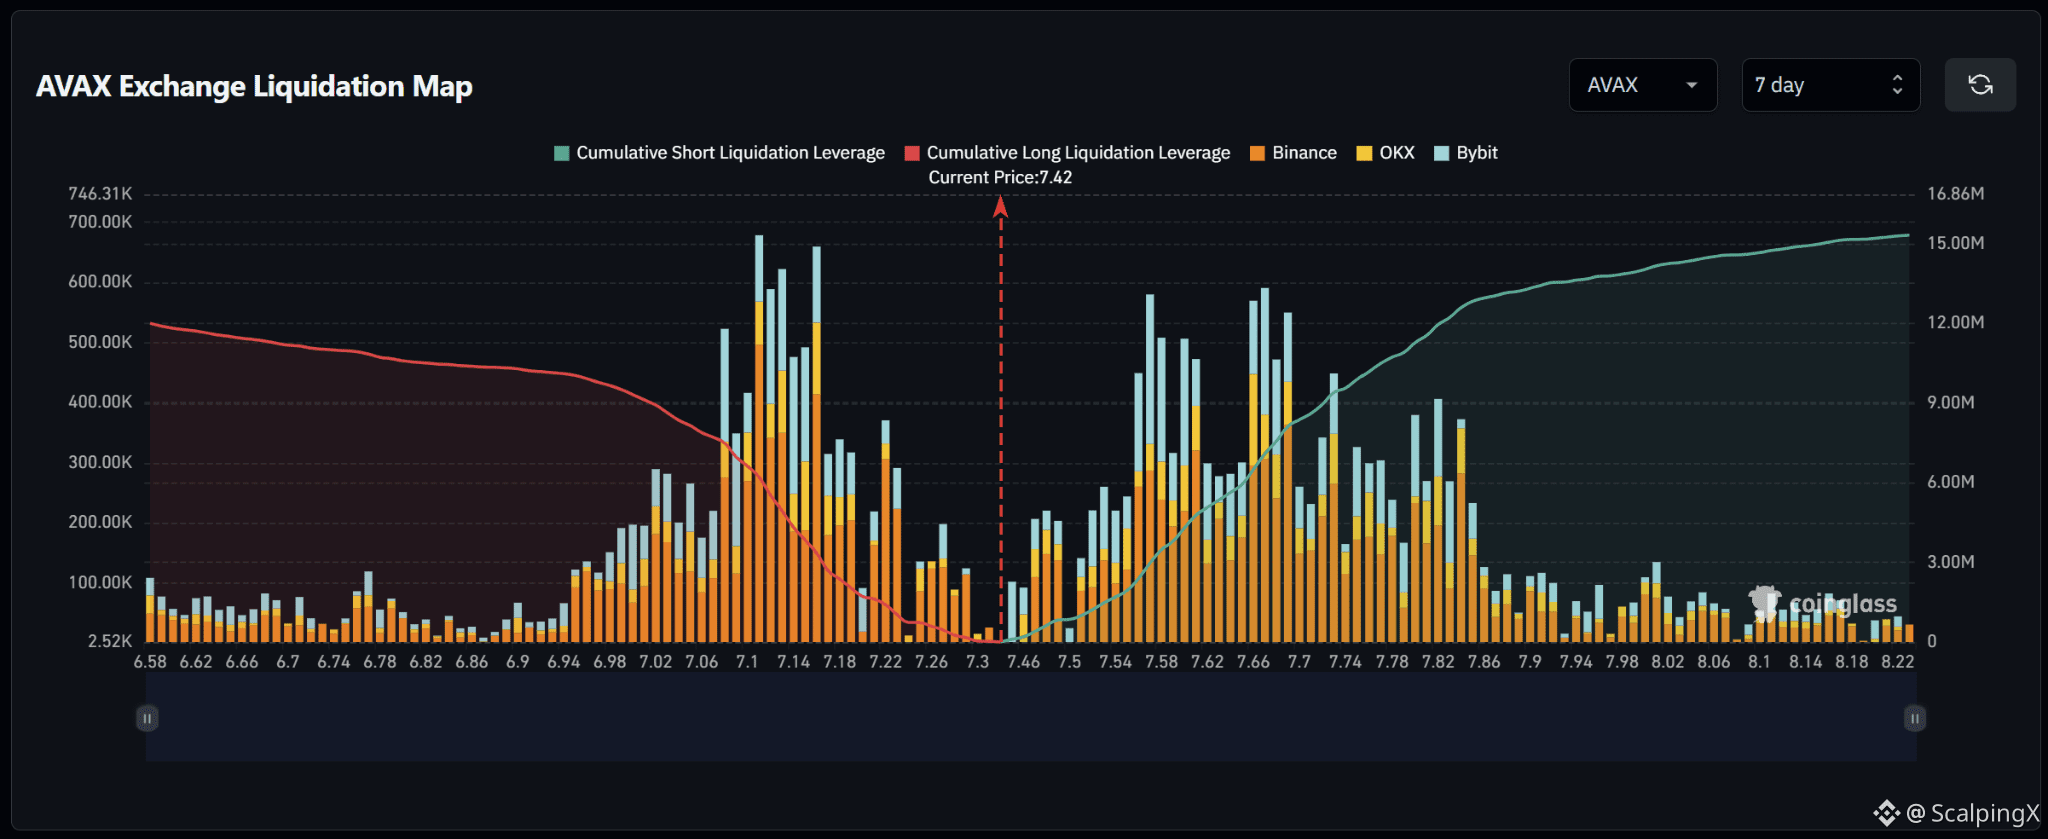
$AVAX – Liquidation Map (7 Days) – Current Price 7.42
🔎 The 7-day liquidation map shows roughly $15 million in short liquidations above the current price, exceeding approximately $12 million in long liquidations below. The overall structure is therefore fairly balanced but modestly tilted to the upside, with roughly 1.2–1.3 times more cumulative liquidity above the market.
📉 Below the market, nearby long-liquidation liquidity is relatively thin around 7.30–7.22 before increasing sharply across 7.18–7.10. The strongest cluster sits around 7.10–7.16, where several liquidation bars reach roughly $600,000–700,000. Losing 7.30 would bring 7.22–7.18 into focus before the larger downside cluster.
📈 Above the market, short-liquidation liquidity begins building from around 7.50 and becomes much denser across 7.54–7.70. The strongest clusters sit near 7.58 and 7.66–7.70, with several bars exceeding $500,000. Further out, 7.74–7.86 also contains notable liquidity.
🧭 The broader setup modestly favors the upside because short-liquidation exposure above is roughly 1.2–1.3 times larger. Breaking 7.50 would increase the probability of a sweep toward 7.54–7.58, while losing 7.30 would shift attention toward 7.22–7.18.
#LiquidationMap
$AVAX – Liquidation Map (7 Days) – Current Price 7.42
🔎 The 7-day liquidation map shows roughly $15 million in short liquidations above the current price, exceeding approximately $12 million in long liquidations below. The overall structure is therefore fairly balanced but modestly tilted to the upside, with roughly 1.2–1.3 times more cumulative liquidity above the market.
📉 Below the market, nearby long-liquidation liquidity is relatively thin around 7.30–7.22 before increasing sharply across 7.18–7.10. The strongest cluster sits around 7.10–7.16, where several liquidation bars reach roughly $600,000–700,000. Losing 7.30 would bring 7.22–7.18 into focus before the larger downside cluster.
📈 Above the market, short-liquidation liquidity begins building from around 7.50 and becomes much denser across 7.54–7.70. The strongest clusters sit near 7.58 and 7.66–7.70, with several bars exceeding $500,000. Further out, 7.74–7.86 also contains notable liquidity.
🧭 The broader setup modestly favors the upside because short-liquidation exposure above is roughly 1.2–1.3 times larger. Breaking 7.50 would increase the probability of a sweep toward 7.54–7.58, while losing 7.30 would shift attention toward 7.22–7.18.
#LiquidationMap
🔎 The 7-day liquidation map shows roughly $15 million in short liquidations above the current price, exceeding approximately $12 million in long liquidations below. The overall structure is therefore fairly balanced but modestly tilted to the upside, with roughly 1.2–1.3 times more cumulative liquidity above the market.
📉 Below the market, nearby long-liquidation liquidity is relatively thin around 7.30–7.22 before increasing sharply across 7.18–7.10. The strongest cluster sits around 7.10–7.16, where several liquidation bars reach roughly $600,000–700,000. Losing 7.30 would bring 7.22–7.18 into focus before the larger downside cluster.
📈 Above the market, short-liquidation liquidity begins building from around 7.50 and becomes much denser across 7.54–7.70. The strongest clusters sit near 7.58 and 7.66–7.70, with several bars exceeding $500,000. Further out, 7.74–7.86 also contains notable liquidity.
🧭 The broader setup modestly favors the upside because short-liquidation exposure above is roughly 1.2–1.3 times larger. Breaking 7.50 would increase the probability of a sweep toward 7.54–7.58, while losing 7.30 would shift attention toward 7.22–7.18.
#LiquidationMap
43
Log in to explore more content
Join global crypto users on Binance Square
⚡️ Get latest and useful information about crypto.
💬 Trusted by the world’s largest crypto exchange.
👍 Discover real insights from verified creators.
Email / Phone number
Trending Topics
1
#AppleDebutsFoldablePhone
24,900 views
530 Discussing
2
#TSMCAugustRevenueUp53.3%YoY
135 views
42 Discussing
3
#IranSaysReadyToEscalateWarWithUS
2,580 views
104 Discussing
4
#EUExtendsCentralContactPointToCASPs
6,611 views
188 Discussing
5
#US10YTreasuryYieldHitsHighestSinceNov2023
25,306 views
413 Discussing
6
#USTreasuryToBuyBackUpTo$6BLongDatedDebt
16,959 views
165 Discussing
7
#BitcoinSurpasses$79K
66,768 views
278 Discussing
8
#BrentCrudeTops$100
124,561 views
404 Discussing
9
#USADPWeeklyEmploymentRises12000
109,424 views
1,320 Discussing
10
#BankOfAmericaGroupPilotsUSBDCStablecoin
81,620 views
1,053 Discussing