
#tradingsignal
tradingsignal
12.6M views
54,160 Discussing
Hot
Latest


·
--
30D trade $BTC 2.6K USDT
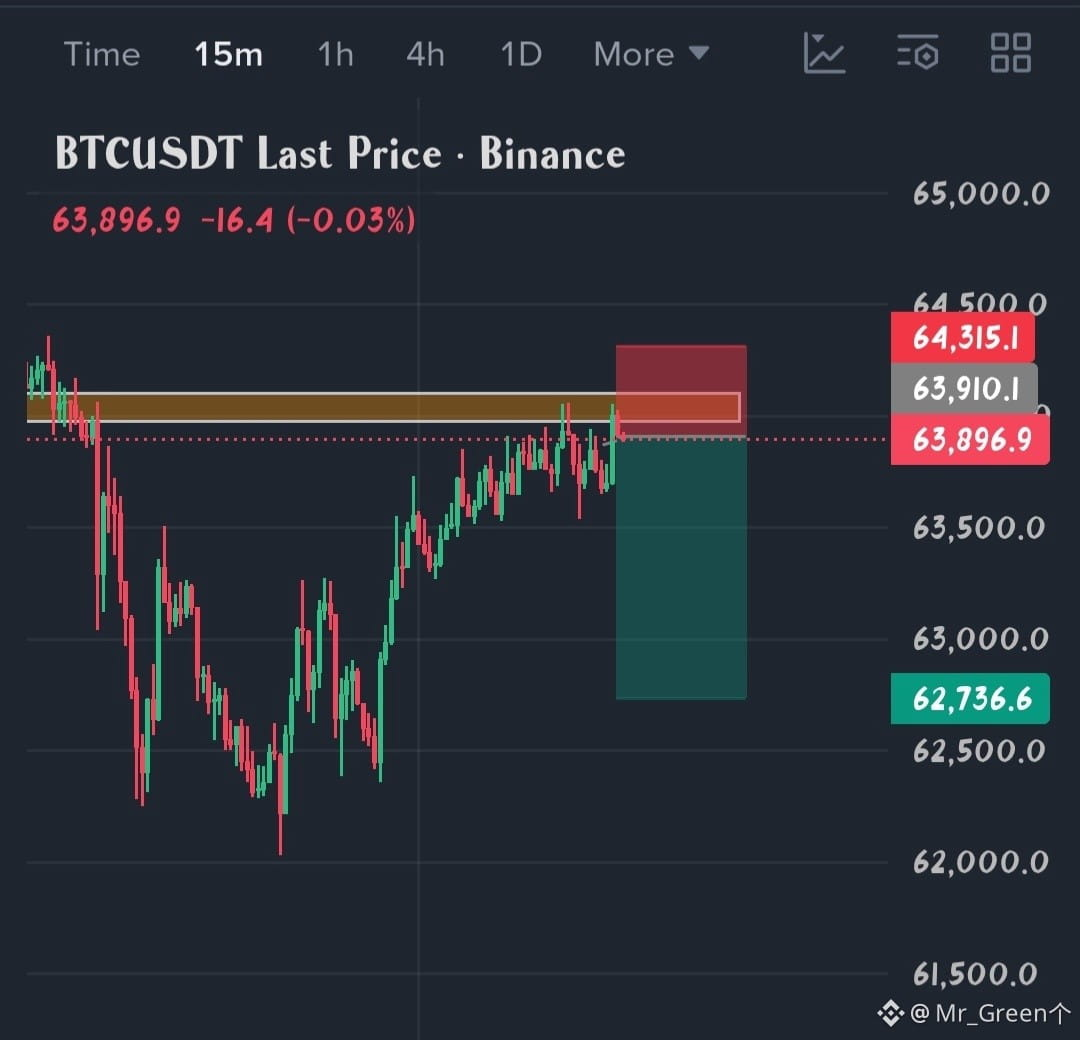
🔻 $BTC SHORT SIGNAL (15M)
Entry: $63,900–$63,950 (on rejection from the resistance zone)
Stop-loss: $64,315.1
TP1: $63,500
TP2: $63,100
TP3: $62,736.6
Risk to reward: roughly 2.9R at the final target.
📊 ANALYSIS
BTC has recovered from the $62,030 low in a steady staircase of higher lows and is now back at the $63,950–$64,100 supply zone, the same area that sparked the earlier sell-off. Price is at $63,896.9 and the latest candle wicked into the zone and was rejected. This is a retest of the breakdown area, and the move up has been slow and corrective. If sellers defend the zone again, I expect a pullback to $63,500, then $63,100, and the $62,737 area as the final target.
I'm not shorting in the middle of the range. The better entry is at the zone, after the rejection shows.
⚠️ INVALIDATION
A 15m close above $64,100 weakens the short, and a break above $64,315.1 cancels it, since that would mean buyers have reclaimed the zone.
Liquidity is stacked above price, with a large short-liquidation cluster near $64.9K–$65K. A squeeze into that area would stop this trade, so respect the stop and don't widen it.
This is a short-term 15m trade, so keep size small and take profits at the targets.
Not financial advice. Trade at your own risk and always use a stop-loss.
Trade here
{future}(BTCUSDT)
#BTC #Bitcoin #Crypto #TradingSignal
$EVAA
🔻 $BTC SHORT SIGNAL (15M)
Entry: $63,900–$63,950 (on rejection from the resistance zone)
Stop-loss: $64,315.1
TP1: $63,500
TP2: $63,100
TP3: $62,736.6
Risk to reward: roughly 2.9R at the final target.
📊 ANALYSIS
BTC has recovered from the $62,030 low in a steady staircase of higher lows and is now back at the $63,950–$64,100 supply zone, the same area that sparked the earlier sell-off. Price is at $63,896.9 and the latest candle wicked into the zone and was rejected. This is a retest of the breakdown area, and the move up has been slow and corrective. If sellers defend the zone again, I expect a pullback to $63,500, then $63,100, and the $62,737 area as the final target.
I'm not shorting in the middle of the range. The better entry is at the zone, after the rejection shows.
⚠️ INVALIDATION
A 15m close above $64,100 weakens the short, and a break above $64,315.1 cancels it, since that would mean buyers have reclaimed the zone.
Liquidity is stacked above price, with a large short-liquidation cluster near $64.9K–$65K. A squeeze into that area would stop this trade, so respect the stop and don't widen it.
This is a short-term 15m trade, so keep size small and take profits at the targets.
Not financial advice. Trade at your own risk and always use a stop-loss.
Trade here
#BTC #Bitcoin #Crypto #TradingSignal
$EVAA
Entry: $63,900–$63,950 (on rejection from the resistance zone)
Stop-loss: $64,315.1
TP1: $63,500
TP2: $63,100
TP3: $62,736.6
Risk to reward: roughly 2.9R at the final target.
📊 ANALYSIS
BTC has recovered from the $62,030 low in a steady staircase of higher lows and is now back at the $63,950–$64,100 supply zone, the same area that sparked the earlier sell-off. Price is at $63,896.9 and the latest candle wicked into the zone and was rejected. This is a retest of the breakdown area, and the move up has been slow and corrective. If sellers defend the zone again, I expect a pullback to $63,500, then $63,100, and the $62,737 area as the final target.
I'm not shorting in the middle of the range. The better entry is at the zone, after the rejection shows.
⚠️ INVALIDATION
A 15m close above $64,100 weakens the short, and a break above $64,315.1 cancels it, since that would mean buyers have reclaimed the zone.
Liquidity is stacked above price, with a large short-liquidation cluster near $64.9K–$65K. A squeeze into that area would stop this trade, so respect the stop and don't widen it.
This is a short-term 15m trade, so keep size small and take profits at the targets.
Not financial advice. Trade at your own risk and always use a stop-loss.
Trade here
#BTC #Bitcoin #Crypto #TradingSignal
$EVAA
1
1
124

🚀 $SOL / USDT - LONG SETUP 🔥
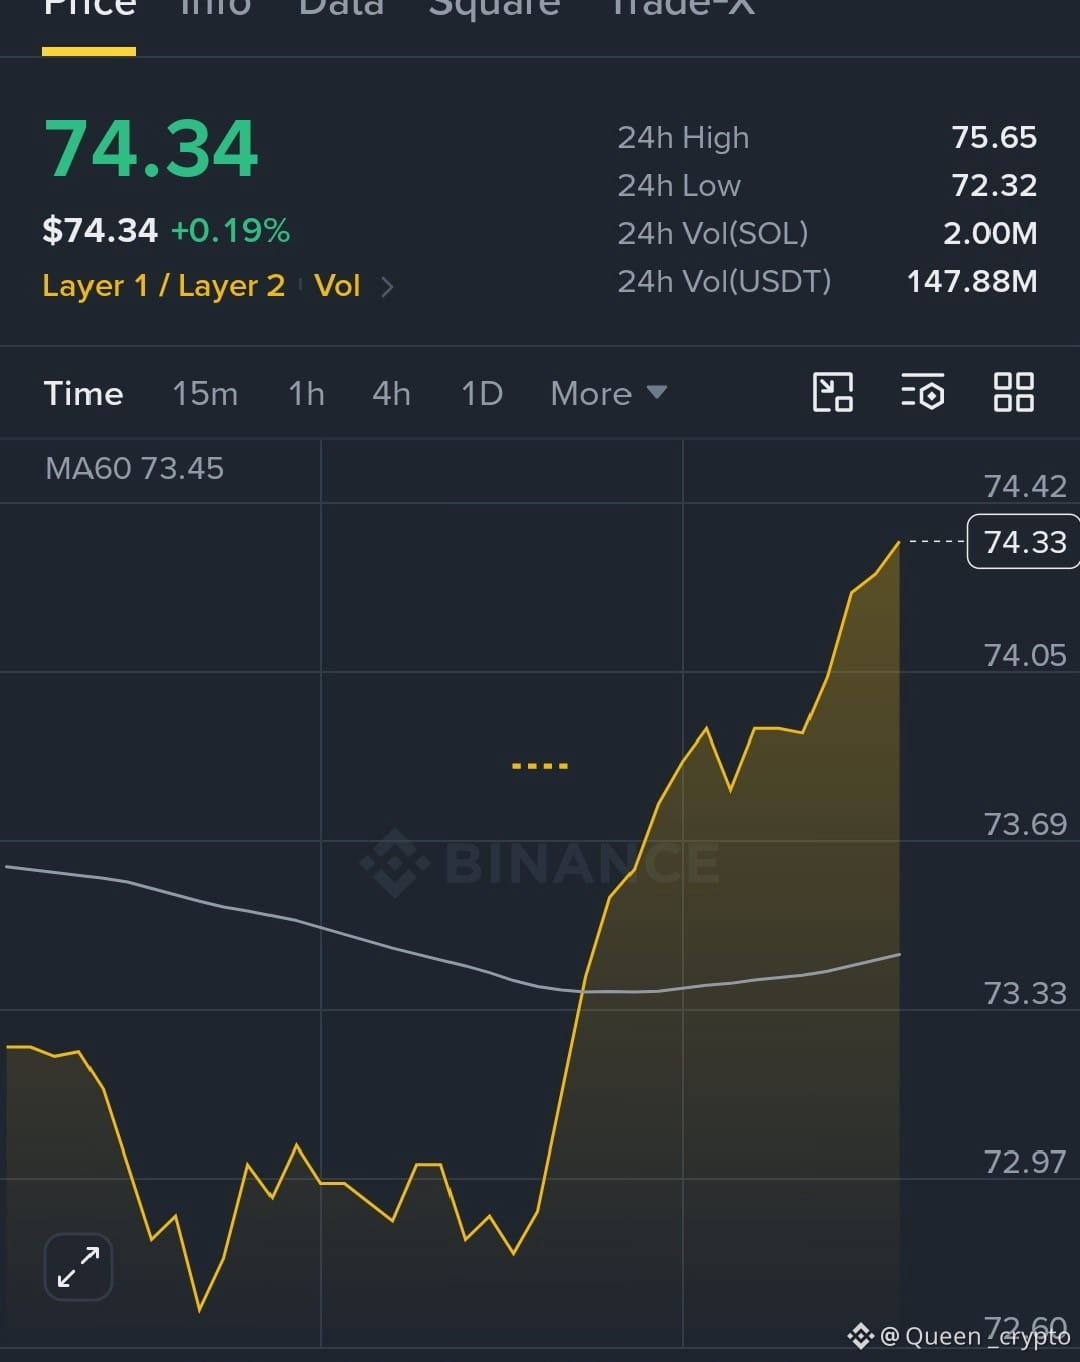
Price: $74.34
✅ ENTRY: $74.00 - $74.40
🎯 TARGETS:
TP1: $75.65
TP2: $77.50
TP3: $80.00
🛑 STOP LOSS: $72.20
Why Long?
SOL took a strong bounce from $72.32 Low and is now trading above MA60 ($73.45). Buyers are back in control.
If $75.65 breaks, next move is directly to $77.50.
Leverage: 5x
Risk: Only 2% Capital
Not Financial Advice - DYOR
#SOL #Solana #Crypto #Binance #TradingSignal
{spot}(SOLUSDT)
🚀 $SOL / USDT - LONG SETUP 🔥
Price: $74.34
✅ ENTRY: $74.00 - $74.40
🎯 TARGETS:
TP1: $75.65
TP2: $77.50
TP3: $80.00
🛑 STOP LOSS: $72.20
Why Long?
SOL took a strong bounce from $72.32 Low and is now trading above MA60 ($73.45). Buyers are back in control.
If $75.65 breaks, next move is directly to $77.50.
Leverage: 5x
Risk: Only 2% Capital
Not Financial Advice - DYOR
#SOL #Solana #Crypto #Binance #TradingSignal
Price: $74.34
✅ ENTRY: $74.00 - $74.40
🎯 TARGETS:
TP1: $75.65
TP2: $77.50
TP3: $80.00
🛑 STOP LOSS: $72.20
Why Long?
SOL took a strong bounce from $72.32 Low and is now trading above MA60 ($73.45). Buyers are back in control.
If $75.65 breaks, next move is directly to $77.50.
Leverage: 5x
Risk: Only 2% Capital
Not Financial Advice - DYOR
#SOL #Solana #Crypto #Binance #TradingSignal
1
48

·
--
Bullish
🚨 SXT/USDT — BULLISH WATCHLIST
{spot}(SXTUSDT)
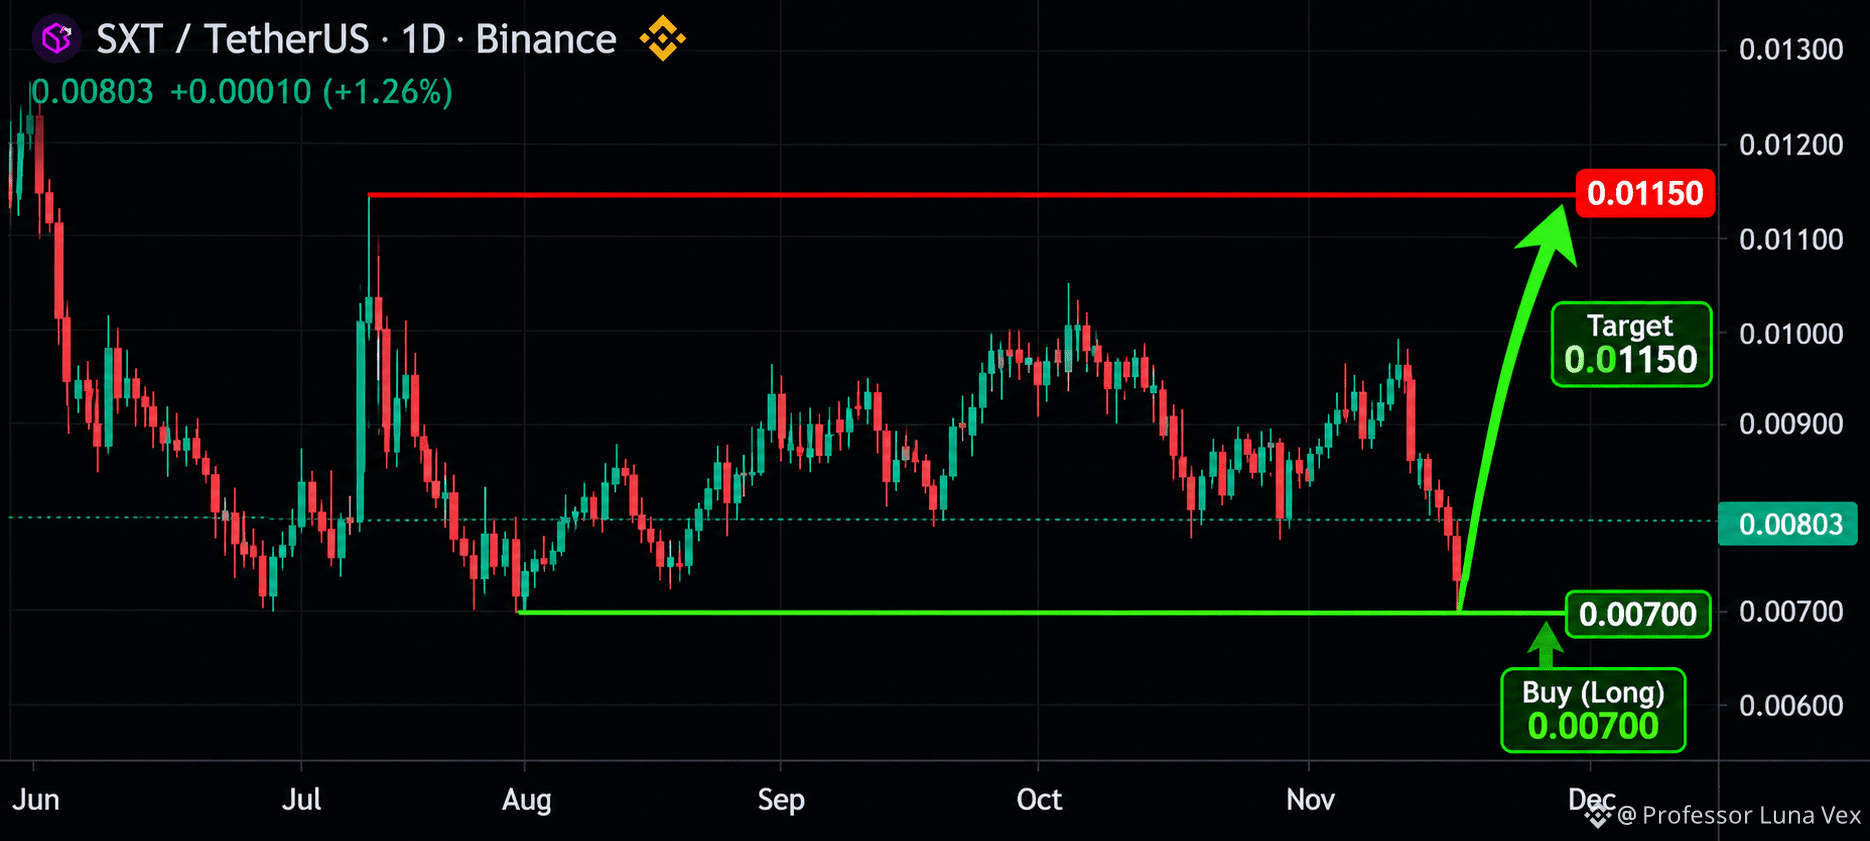
📊 Timeframe: 1D
💰 Current Price: $0.00803
🟢 Potential Long Entry: $0.00700
🎯 Target: $0.01150
📈 Potential Upside: +64.3%
Technical Outlook:
$0.00700 represents an important historical demand zone. A strong bullish reaction and volume confirmation could open the door toward $0.01150.
Manage risk.
Watch the level. Respect the structure.
#SXTSignal #BİNANCE #CryptoAnalysis📈📉🐋📅🚀 #TradingSignal
🚨 SXT/USDT — BULLISH WATCHLIST
📊 Timeframe: 1D
💰 Current Price: $0.00803
🟢 Potential Long Entry: $0.00700
🎯 Target: $0.01150
📈 Potential Upside: +64.3%
Technical Outlook:
$0.00700 represents an important historical demand zone. A strong bullish reaction and volume confirmation could open the door toward $0.01150.
Manage risk.
Watch the level. Respect the structure.
#SXTSignal #BİNANCE #CryptoAnalysis📈📉🐋📅🚀 #TradingSignal
📊 Timeframe: 1D
💰 Current Price: $0.00803
🟢 Potential Long Entry: $0.00700
🎯 Target: $0.01150
📈 Potential Upside: +64.3%
Technical Outlook:
$0.00700 represents an important historical demand zone. A strong bullish reaction and volume confirmation could open the door toward $0.01150.
Manage risk.
Watch the level. Respect the structure.
#SXTSignal #BİNANCE #CryptoAnalysis📈📉🐋📅🚀 #TradingSignal
1
1
293

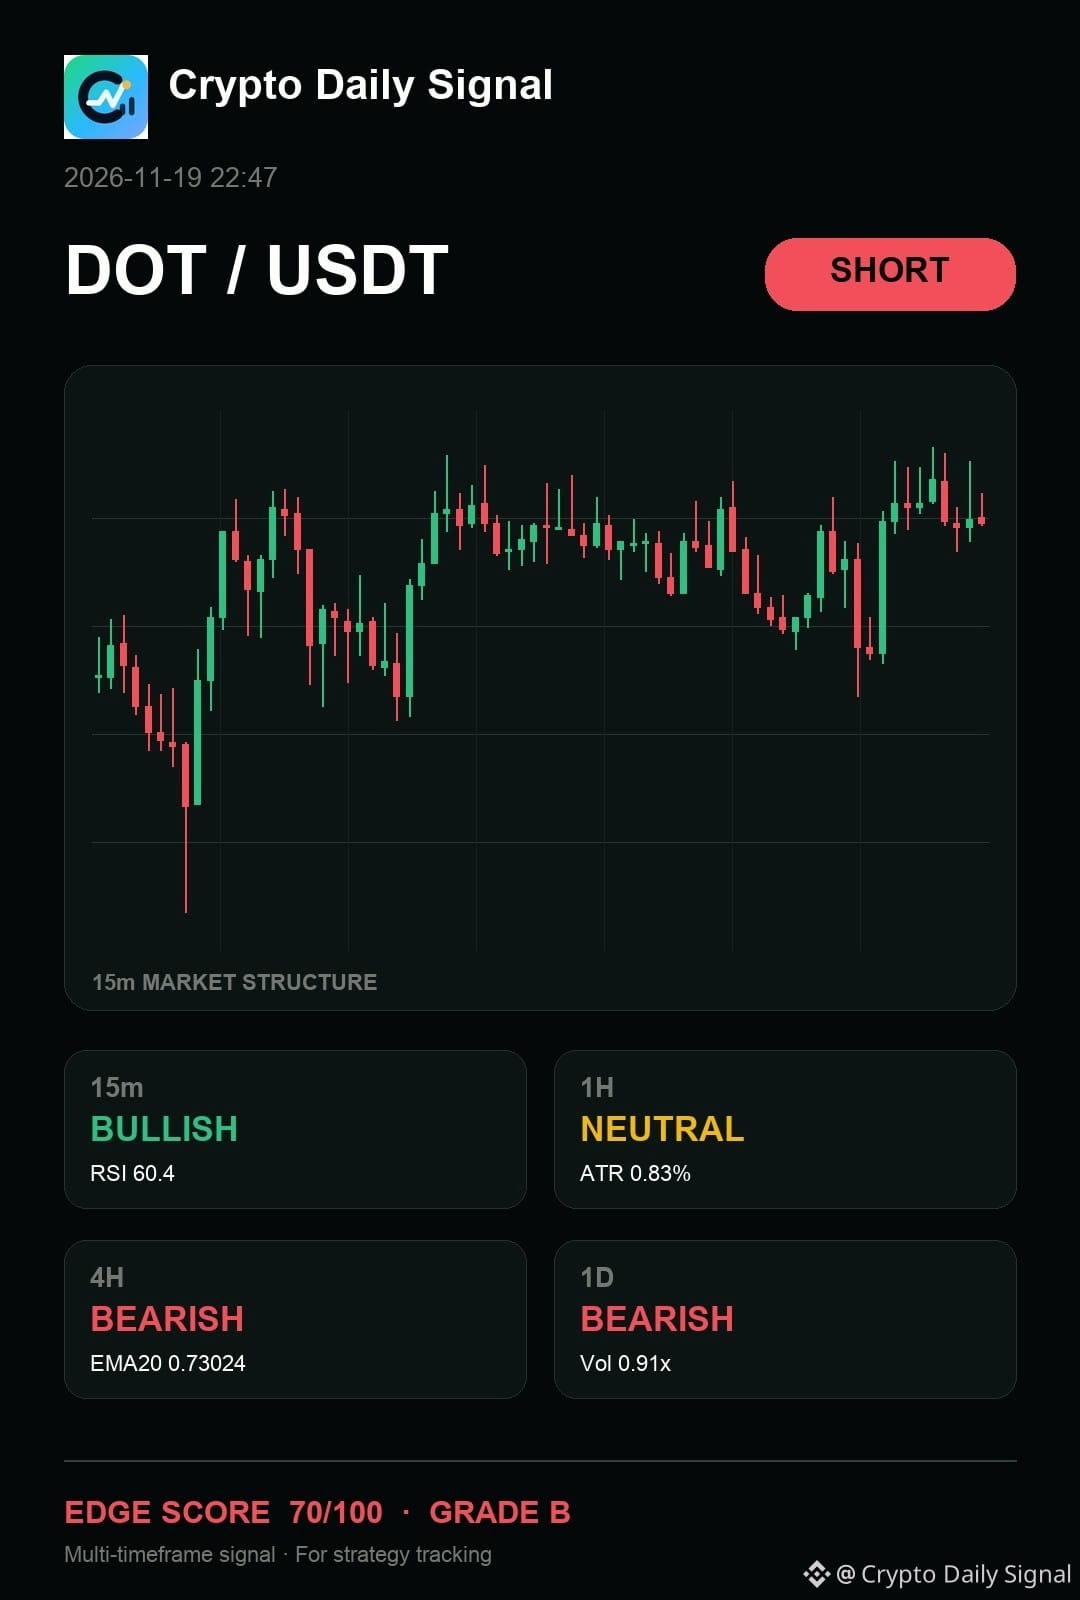
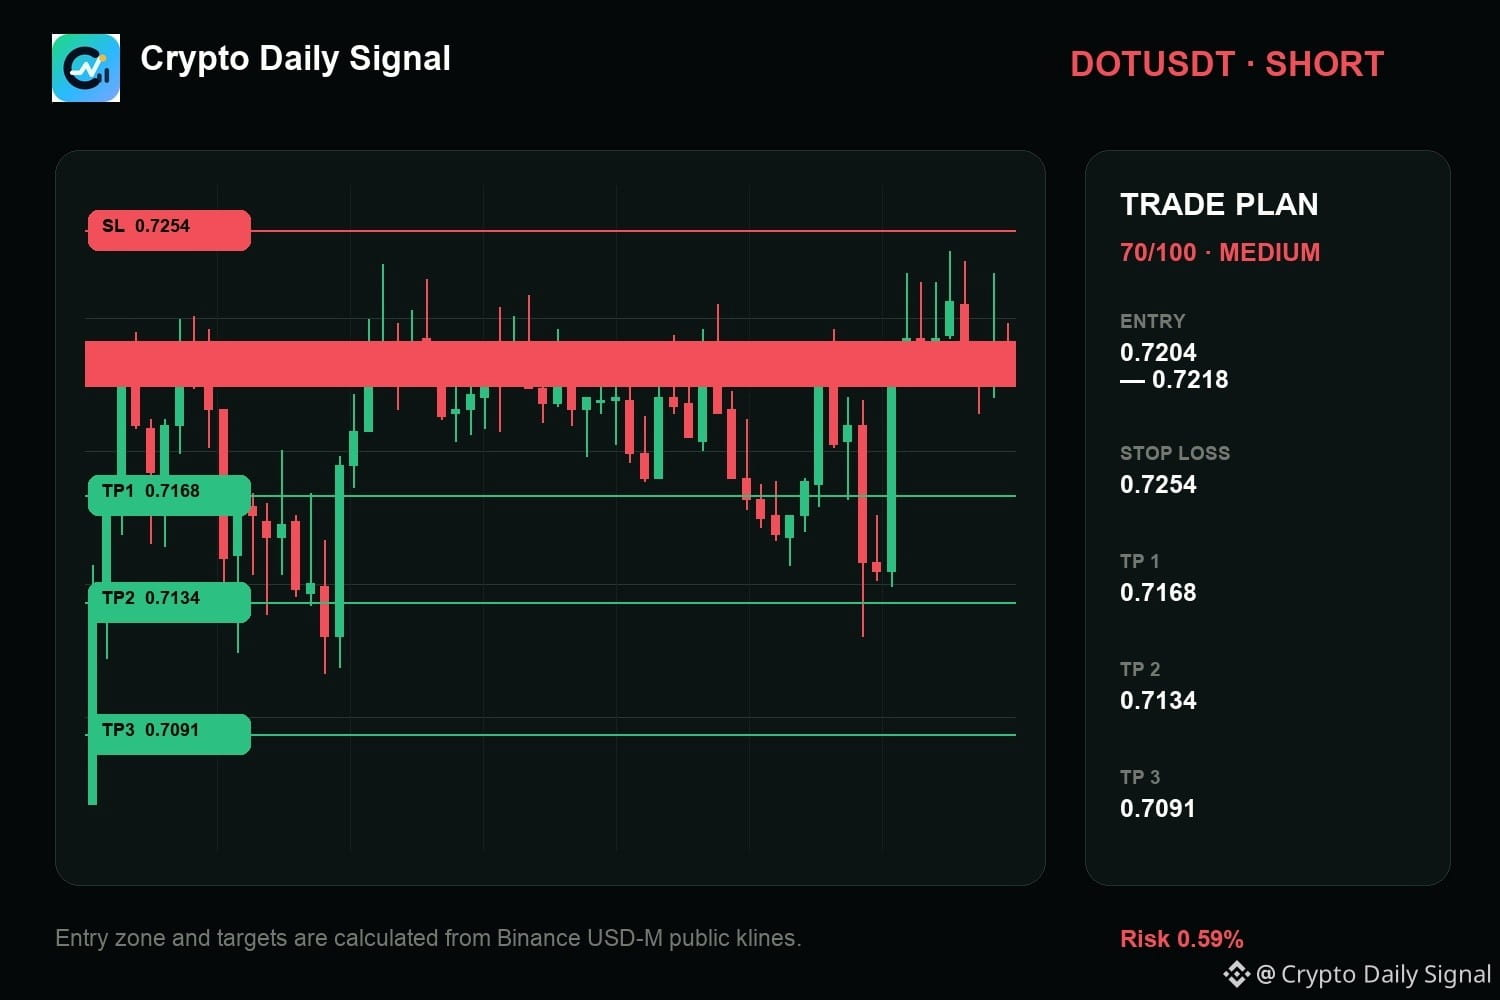
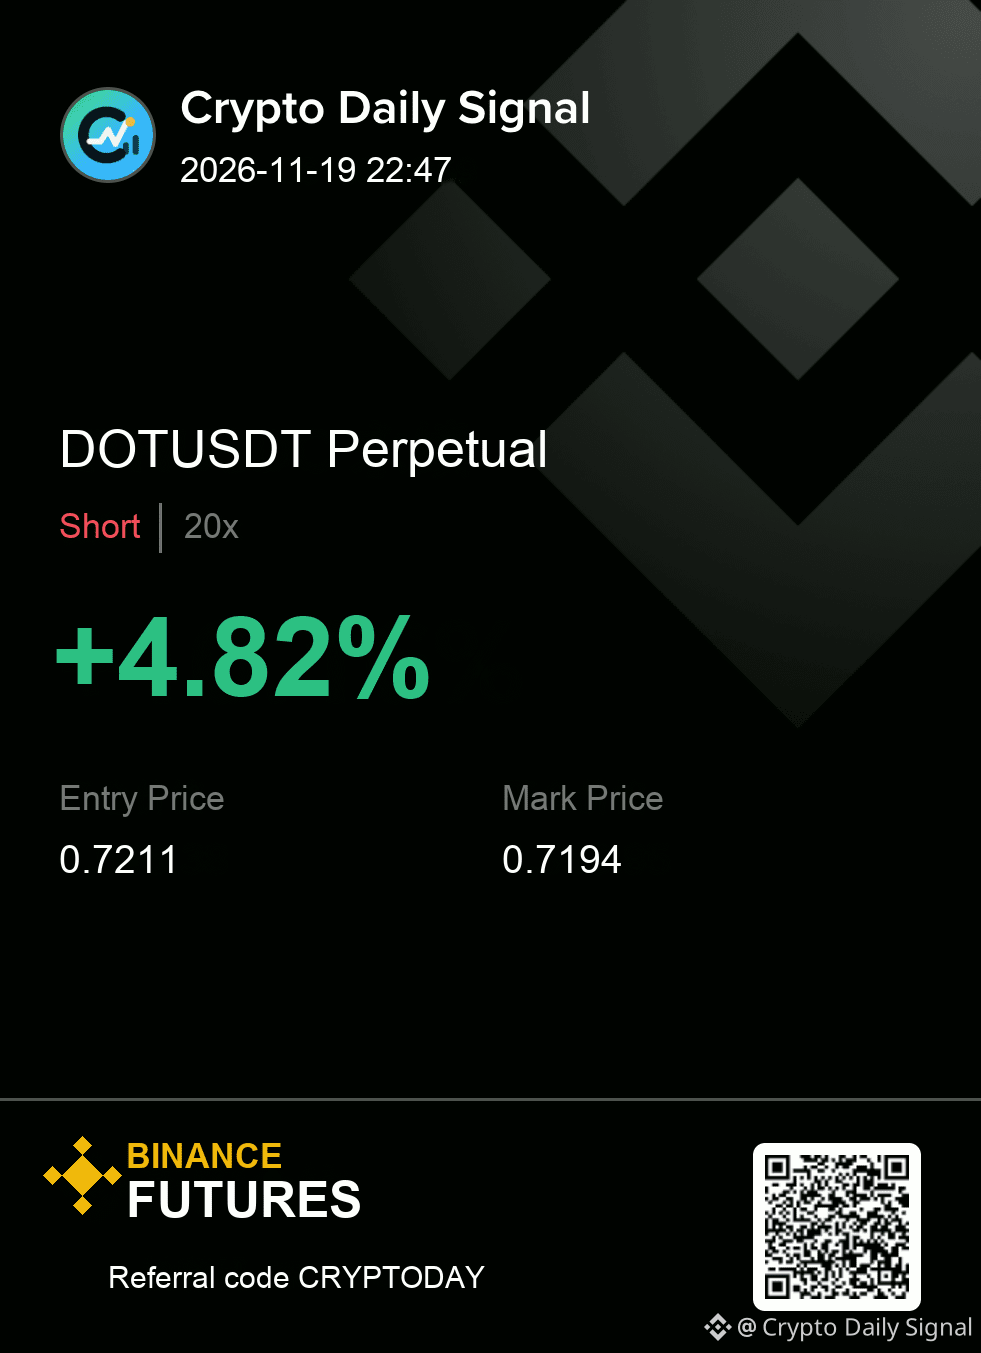
$DOT — man, the part I care about is how it keeps me focused on the downside response as the recent price steps down, making lower highs against the swing high. The four-hour view shows clear bearish bias, aligning with the overall daily trend. This short thesis gets stronger if the price cleanly breaks below the immediate range floor.
Trade Plan — DOTUSDT SHORT
Entry: 0.7204 - 0.7218
Stop Loss: 0.7254
TP1: 0.7168 | TP2: 0.7134 | TP3: 0.7091
#TradingSignal
{future}(DOTUSDT)
$DOT — man, the part I care about is how it keeps me focused on the downside response as the recent price steps down, making lower highs against the swing high. The four-hour view shows clear bearish bias, aligning with the overall daily trend. This short thesis gets stronger if the price cleanly breaks below the immediate range floor.
Trade Plan — DOTUSDT SHORT
Entry: 0.7204 - 0.7218
Stop Loss: 0.7254
TP1: 0.7168 | TP2: 0.7134 | TP3: 0.7091
#TradingSignal
Trade Plan — DOTUSDT SHORT
Entry: 0.7204 - 0.7218
Stop Loss: 0.7254
TP1: 0.7168 | TP2: 0.7134 | TP3: 0.7091
#TradingSignal
11

·
--
Bullish
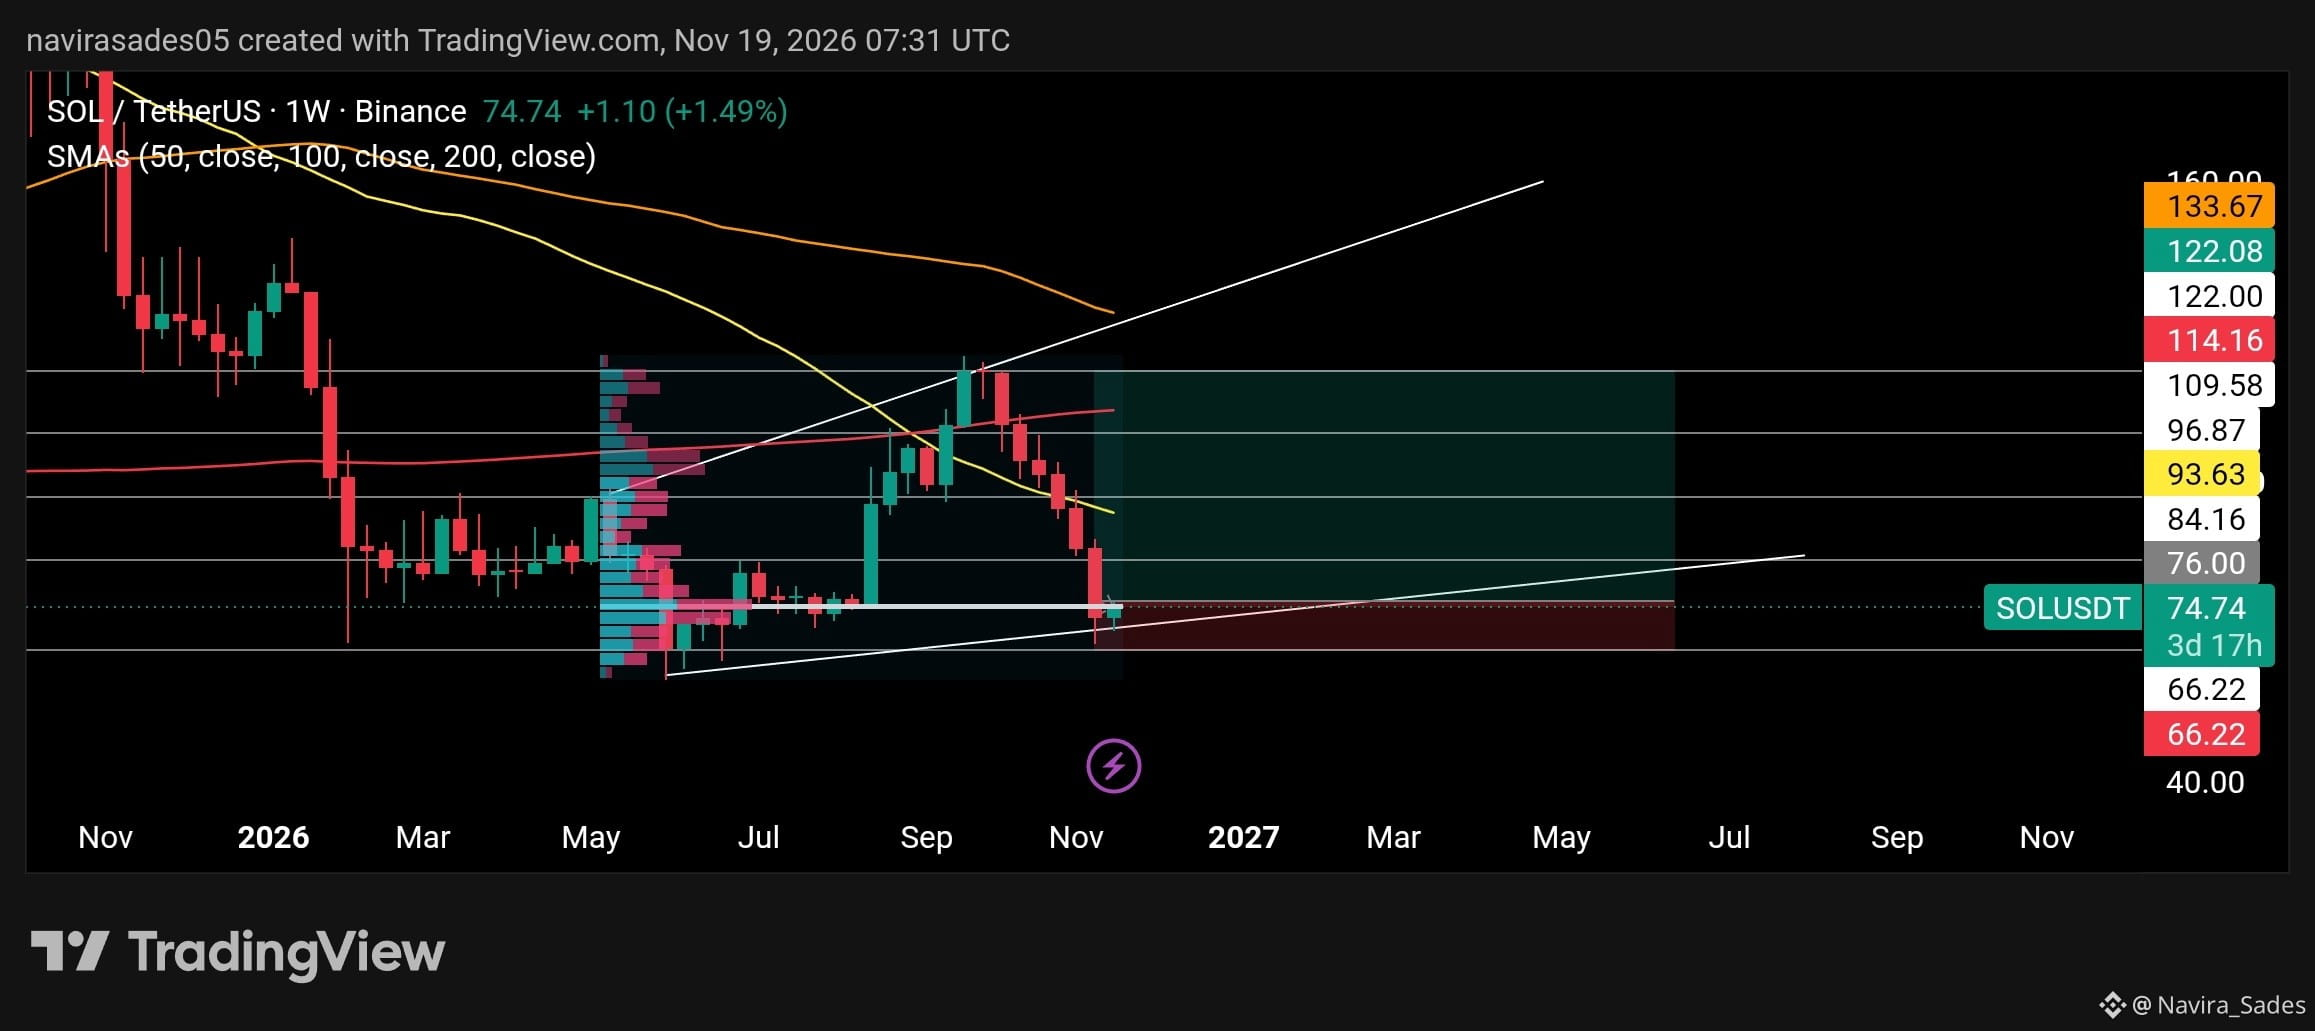
$SOL GET LONG TRADE AFTER CLOSE 1D/1W CANDLE ABOVE THE ENTRY LINE
{future}(SOLUSDT)
use 3x leverage
use 1% of your wallet balance
Entry = 76 - 77
Tp 1 = 84
Tp 2 = 96
Tp 3 = 109
Tp 4 = 122
Sl = 66.22
📜 FALLOW FOR MORE TRADE ENTRY
#solana #sol #TradingSignal
$SOL GET LONG TRADE AFTER CLOSE 1D/1W CANDLE ABOVE THE ENTRY LINE
use 3x leverage
use 1% of your wallet balance
Entry = 76 - 77
Tp 1 = 84
Tp 2 = 96
Tp 3 = 109
Tp 4 = 122
Sl = 66.22
📜 FALLOW FOR MORE TRADE ENTRY
#solana #sol #TradingSignal
use 3x leverage
use 1% of your wallet balance
Entry = 76 - 77
Tp 1 = 84
Tp 2 = 96
Tp 3 = 109
Tp 4 = 122
Sl = 66.22
📜 FALLOW FOR MORE TRADE ENTRY
#solana #sol #TradingSignal
1
42
·
--
Bearish
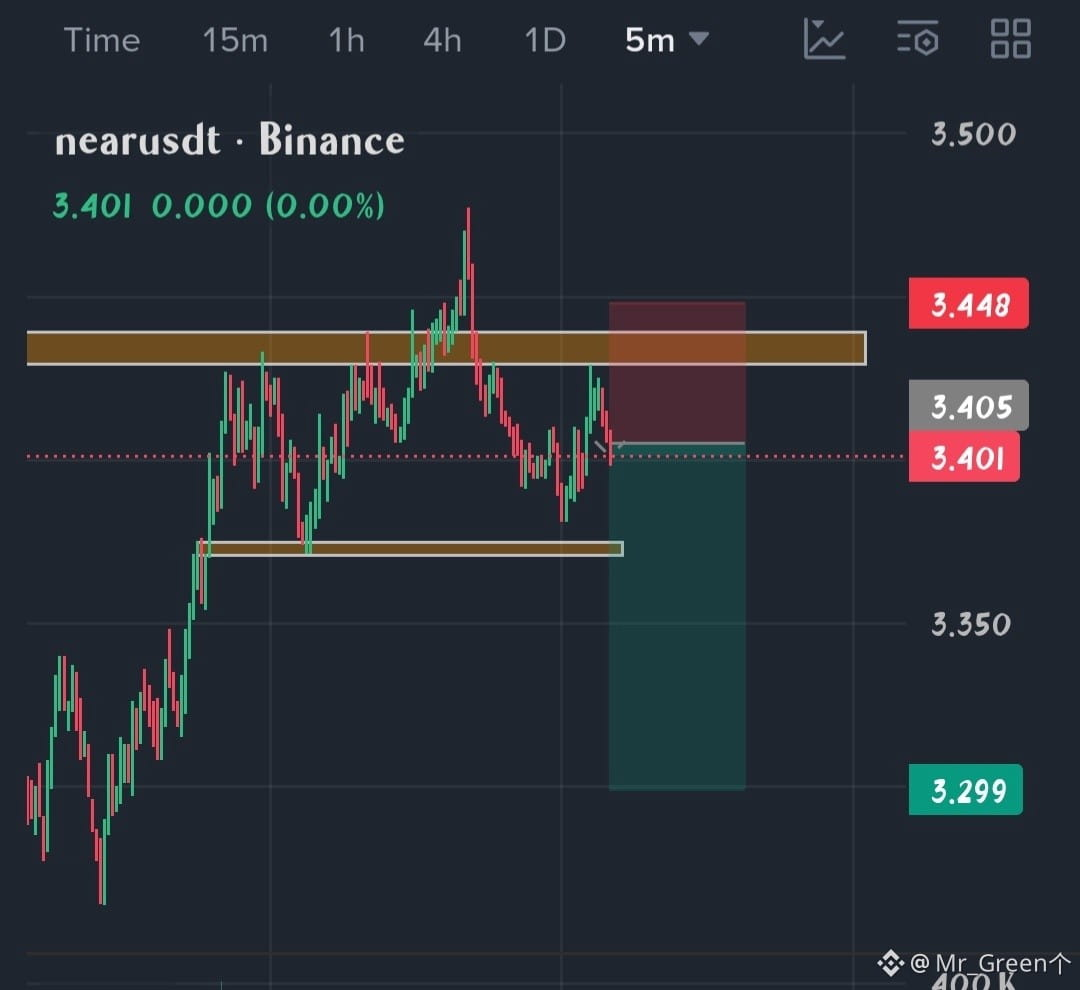
🔻 $NEAR SHORT SIGNAL (5M)
Entry: $3.401–$3.405
Stop-loss: $3.448
TP1: $3.375
TP2: $3.350
TP3: $3.299
Risk to reward: roughly 2.4R at the final target.
📊 ANALYSIS
NEAR spiked to $3.46, swept the liquidity above the $3.43–$3.44 resistance zone, and was rejected sharply. The recovery since then has made a lower high near $3.417, well below that zone, and price is now rolling over at $3.401. That is a sweep, a rejection and a lower high in sequence, which usually favors sellers.
The first target is the $3.371–$3.375 support, which has held several times, so expect a reaction there. A 5m close below it opens the way to $3.350, then $3.299 as the final target.
⚠️ INVALIDATION
A 5m close above $3.43 weakens the short, and a break above $3.448 cancels it, since that would mean buyers have reclaimed the resistance.
If price bounces hard from $3.375, consider taking partial profits there and moving the stop to breakeven.
This is a 5m scalp, so keep size small, take profits at the targets and respect the stop.
Not financial advice. Trade at your own risk and always use a stop-loss.
#NEAR #Crypto #TradingSignal
$EVAA
🔻 $NEAR SHORT SIGNAL (5M)
Entry: $3.401–$3.405
Stop-loss: $3.448
TP1: $3.375
TP2: $3.350
TP3: $3.299
Risk to reward: roughly 2.4R at the final target.
📊 ANALYSIS
NEAR spiked to $3.46, swept the liquidity above the $3.43–$3.44 resistance zone, and was rejected sharply. The recovery since then has made a lower high near $3.417, well below that zone, and price is now rolling over at $3.401. That is a sweep, a rejection and a lower high in sequence, which usually favors sellers.
The first target is the $3.371–$3.375 support, which has held several times, so expect a reaction there. A 5m close below it opens the way to $3.350, then $3.299 as the final target.
⚠️ INVALIDATION
A 5m close above $3.43 weakens the short, and a break above $3.448 cancels it, since that would mean buyers have reclaimed the resistance.
If price bounces hard from $3.375, consider taking partial profits there and moving the stop to breakeven.
This is a 5m scalp, so keep size small, take profits at the targets and respect the stop.
Not financial advice. Trade at your own risk and always use a stop-loss.
#NEAR #Crypto #TradingSignal
$EVAA
Entry: $3.401–$3.405
Stop-loss: $3.448
TP1: $3.375
TP2: $3.350
TP3: $3.299
Risk to reward: roughly 2.4R at the final target.
📊 ANALYSIS
NEAR spiked to $3.46, swept the liquidity above the $3.43–$3.44 resistance zone, and was rejected sharply. The recovery since then has made a lower high near $3.417, well below that zone, and price is now rolling over at $3.401. That is a sweep, a rejection and a lower high in sequence, which usually favors sellers.
The first target is the $3.371–$3.375 support, which has held several times, so expect a reaction there. A 5m close below it opens the way to $3.350, then $3.299 as the final target.
⚠️ INVALIDATION
A 5m close above $3.43 weakens the short, and a break above $3.448 cancels it, since that would mean buyers have reclaimed the resistance.
If price bounces hard from $3.375, consider taking partial profits there and moving the stop to breakeven.
This is a 5m scalp, so keep size small, take profits at the targets and respect the stop.
Not financial advice. Trade at your own risk and always use a stop-loss.
#NEAR #Crypto #TradingSignal
$EVAA
1
125
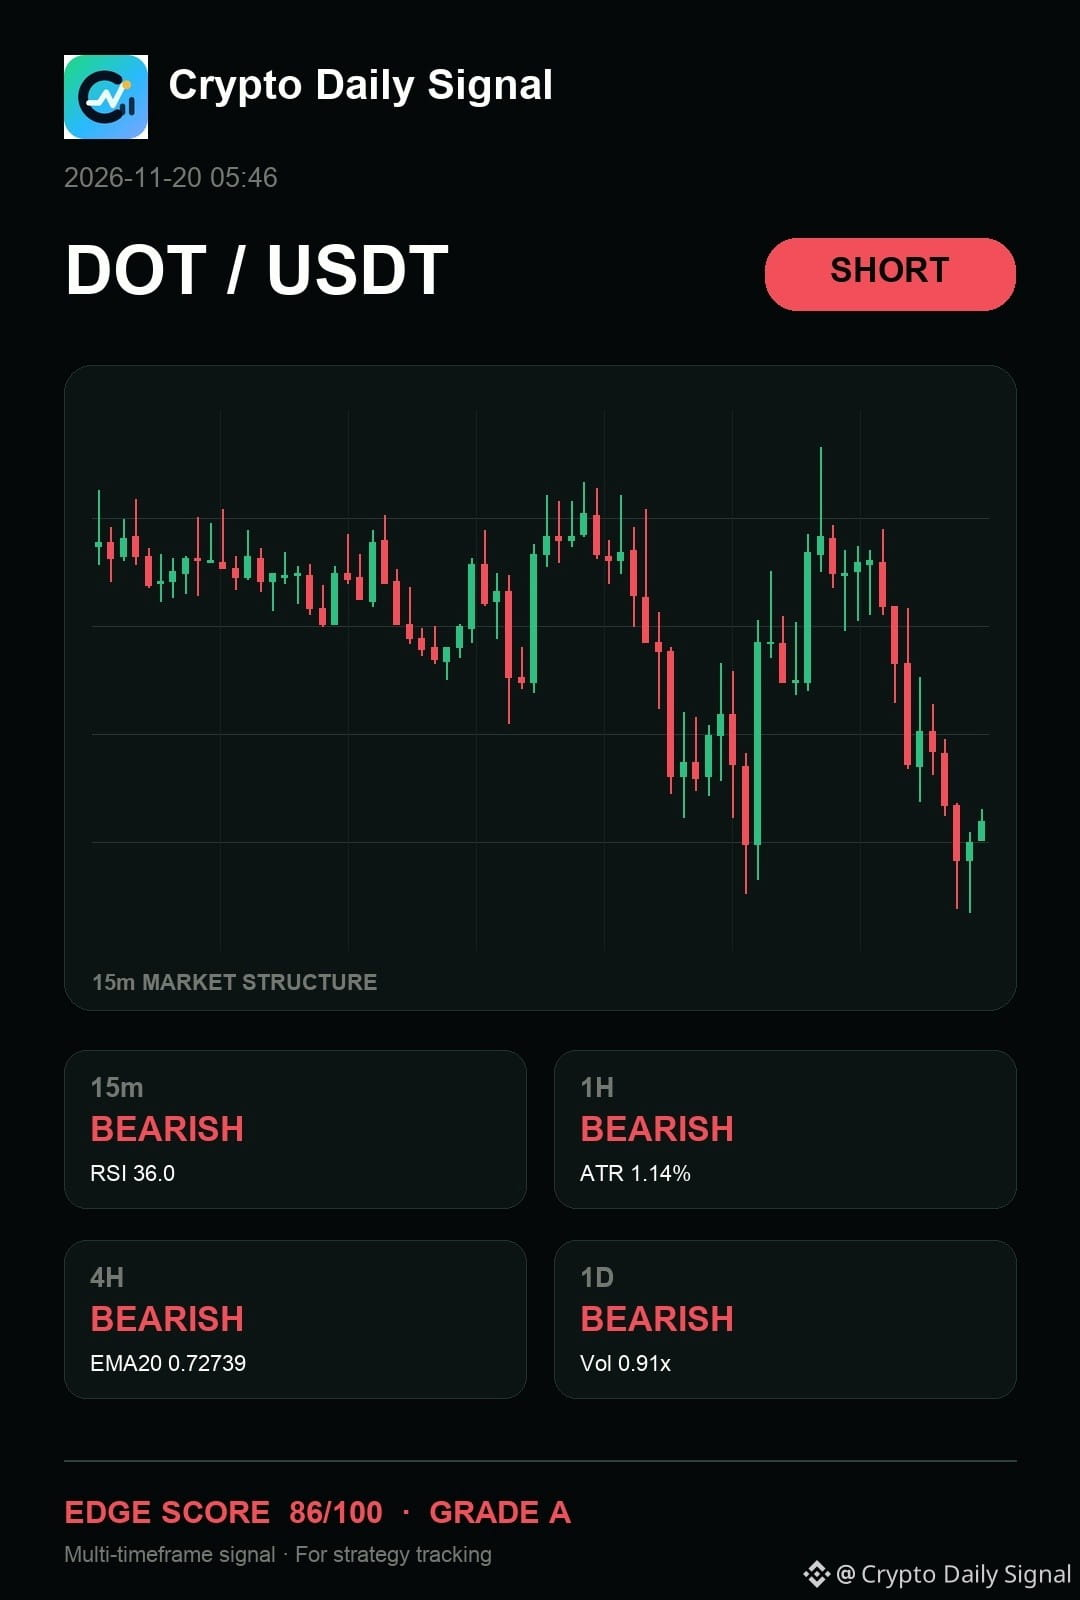
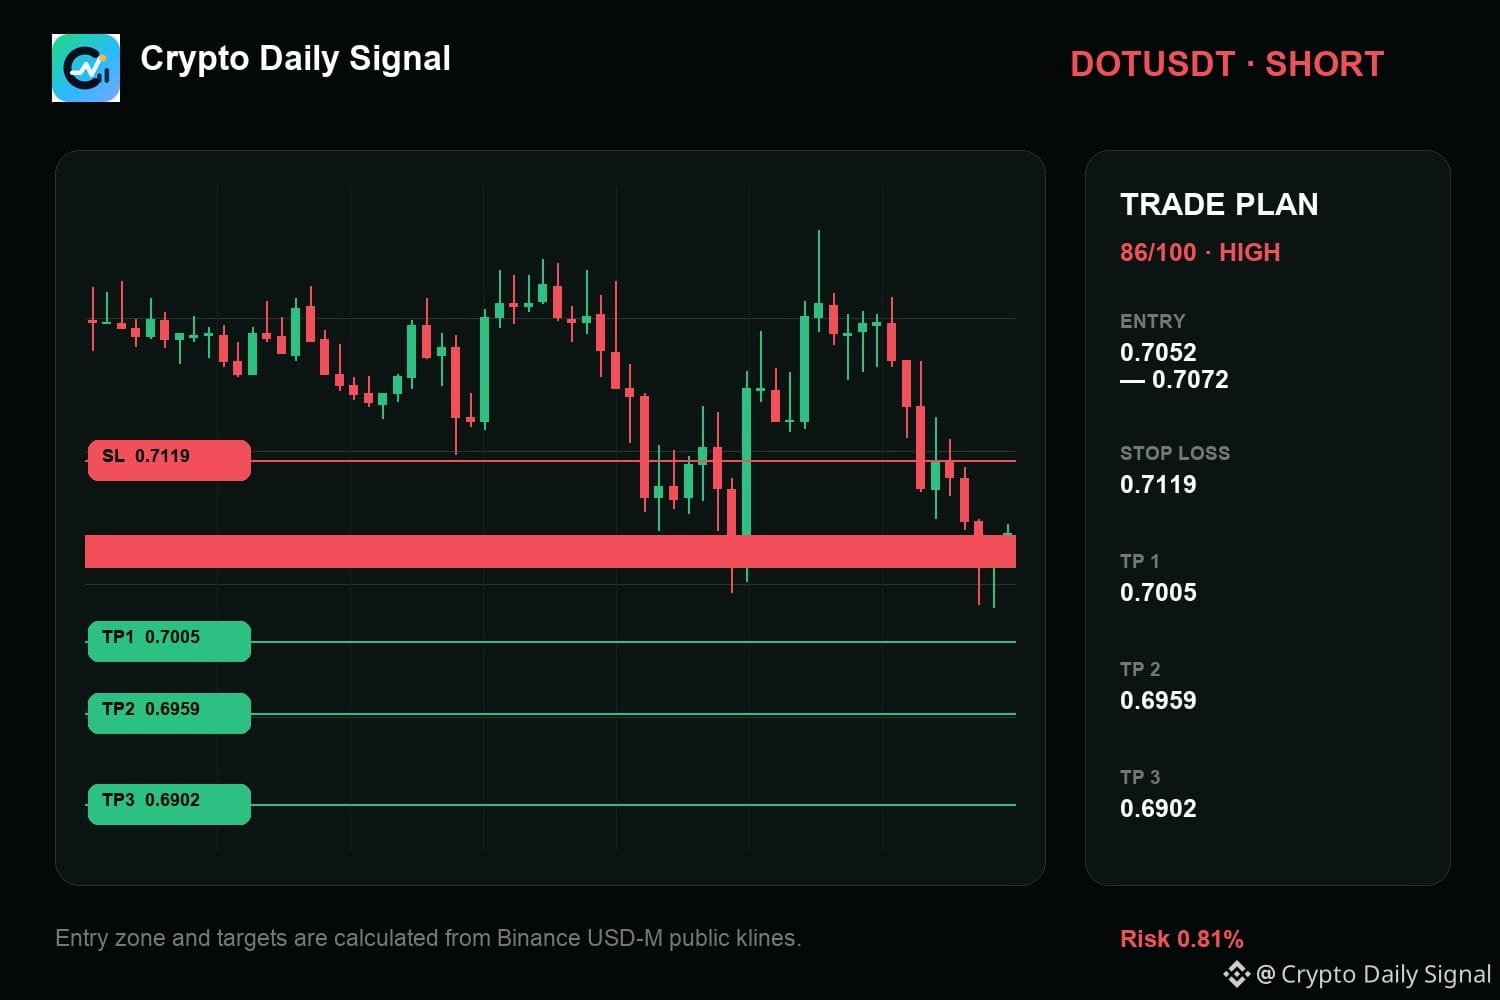
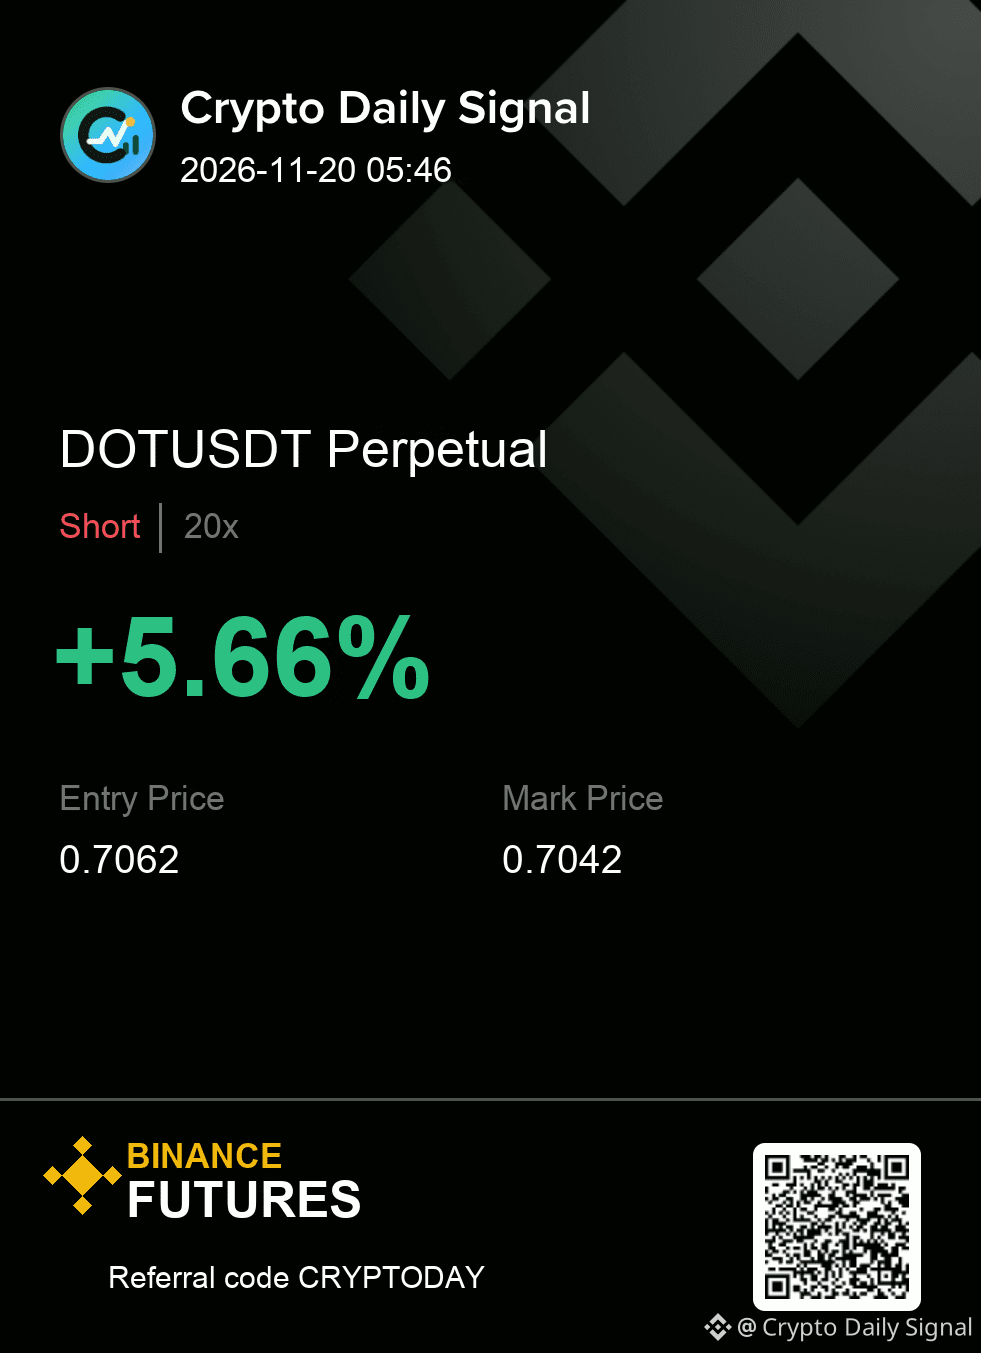
$DOT — okay, my read still says it has my attention on the sell side. The asset is contained within a clear descending channel pattern, with recent upper wick rejections at the high end of that range. A confirmation below the immediate short-term swing low would validate this bearish read.
Levels — DOTUSDT
Zone: 0.7052 - 0.7072
Cut: 0.7119
Scale: 0.7005 | 0.6959 | 0.6902
#TradingSignal
{future}(DOTUSDT)
$DOT — okay, my read still says it has my attention on the sell side. The asset is contained within a clear descending channel pattern, with recent upper wick rejections at the high end of that range. A confirmation below the immediate short-term swing low would validate this bearish read.
Levels — DOTUSDT
Zone: 0.7052 - 0.7072
Cut: 0.7119
Scale: 0.7005 | 0.6959 | 0.6902
#TradingSignal
Levels — DOTUSDT
Zone: 0.7052 - 0.7072
Cut: 0.7119
Scale: 0.7005 | 0.6959 | 0.6902
#TradingSignal
1
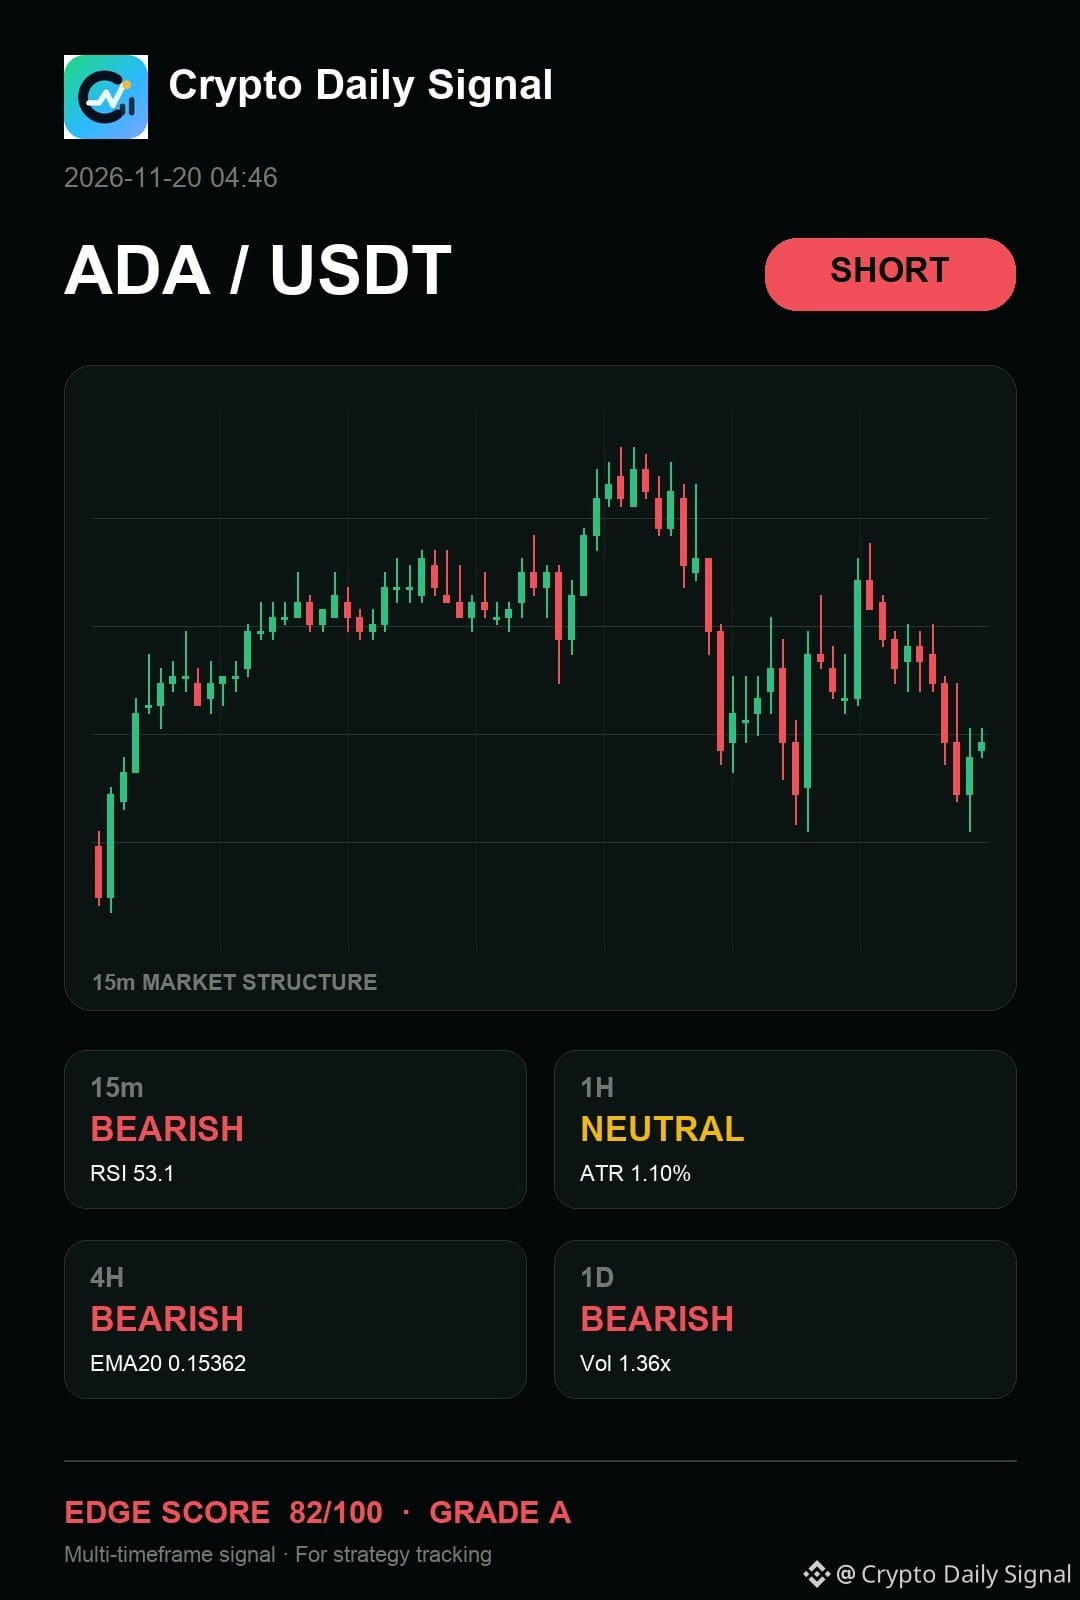
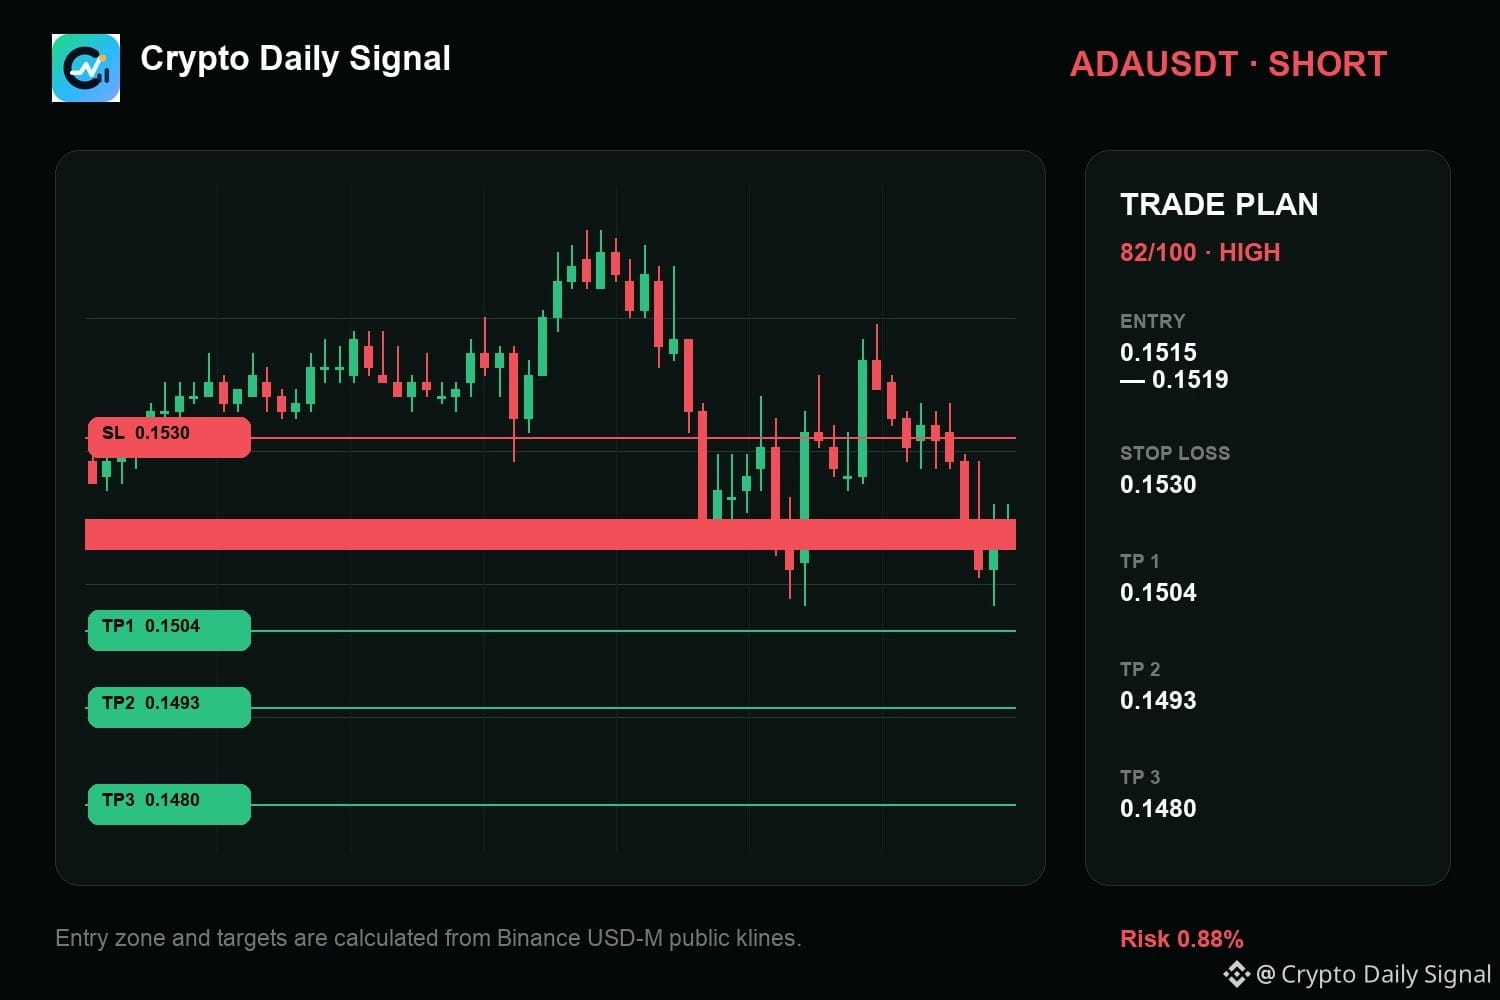
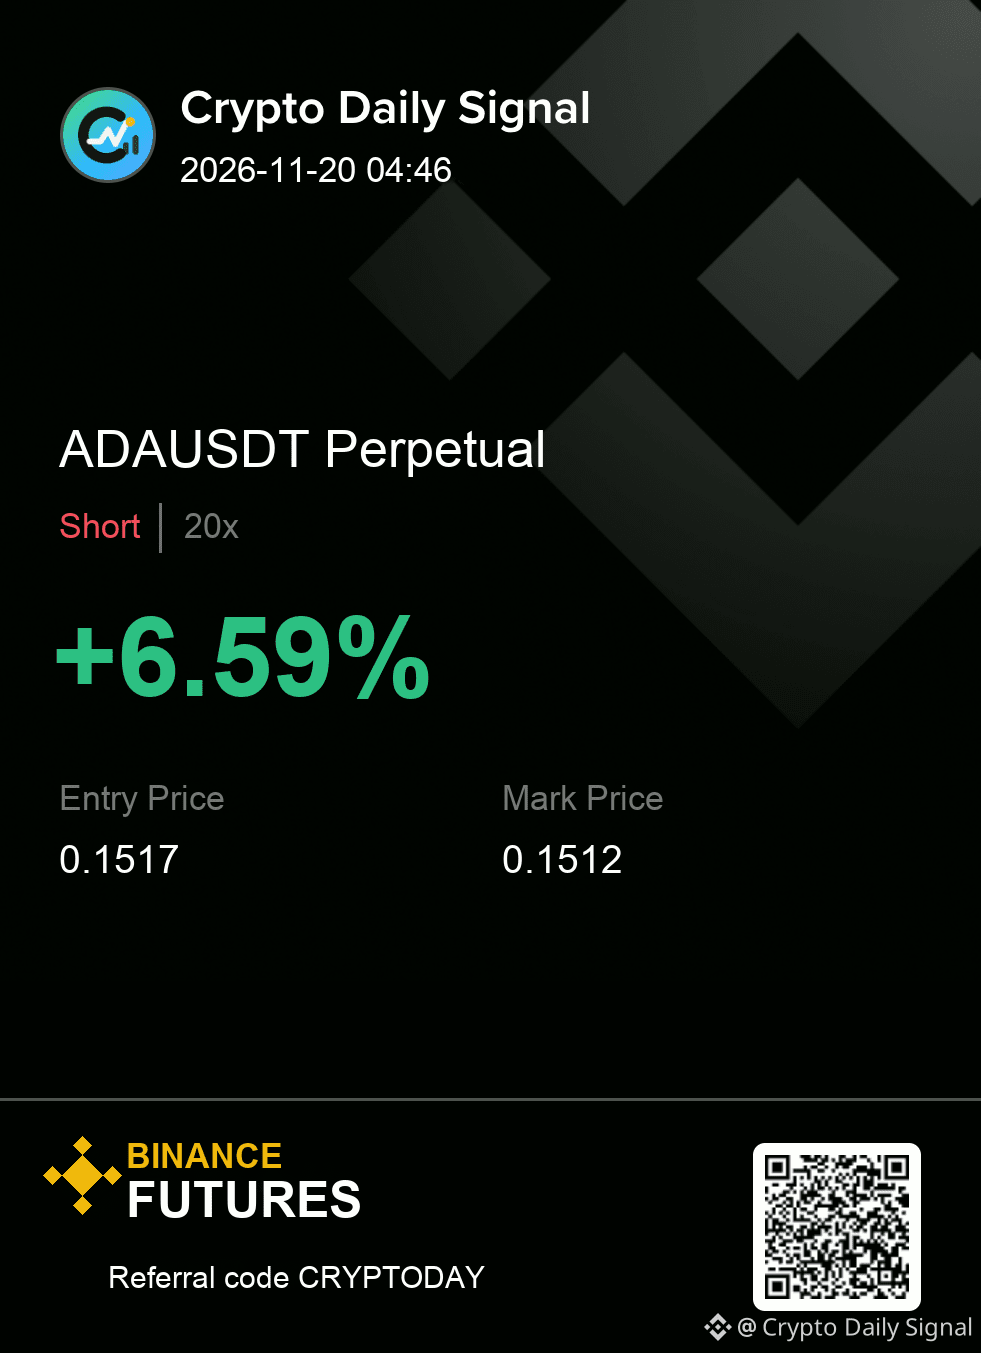
$ADA — bro, here's my read: it remains a short watch for me because the recent price behavior is forming lower highs against earlier peaks. This action is testing a zone that previously saw selling hold up. If the price cleanly breaks below the last short-term low, the downside thesis gets stronger; a strong close above that recent high would put me on the sidelines.
Trade Plan — ADAUSDT SHORT
Entry: 0.1515 - 0.1519
Stop Loss: 0.1530
TP1: 0.1504 | TP2: 0.1493 | TP3: 0.1480
#TradingSignal
{future}(ADAUSDT)
$ADA — bro, here's my read: it remains a short watch for me because the recent price behavior is forming lower highs against earlier peaks. This action is testing a zone that previously saw selling hold up. If the price cleanly breaks below the last short-term low, the downside thesis gets stronger; a strong close above that recent high would put me on the sidelines.
Trade Plan — ADAUSDT SHORT
Entry: 0.1515 - 0.1519
Stop Loss: 0.1530
TP1: 0.1504 | TP2: 0.1493 | TP3: 0.1480
#TradingSignal
Trade Plan — ADAUSDT SHORT
Entry: 0.1515 - 0.1519
Stop Loss: 0.1530
TP1: 0.1504 | TP2: 0.1493 | TP3: 0.1480
#TradingSignal
2
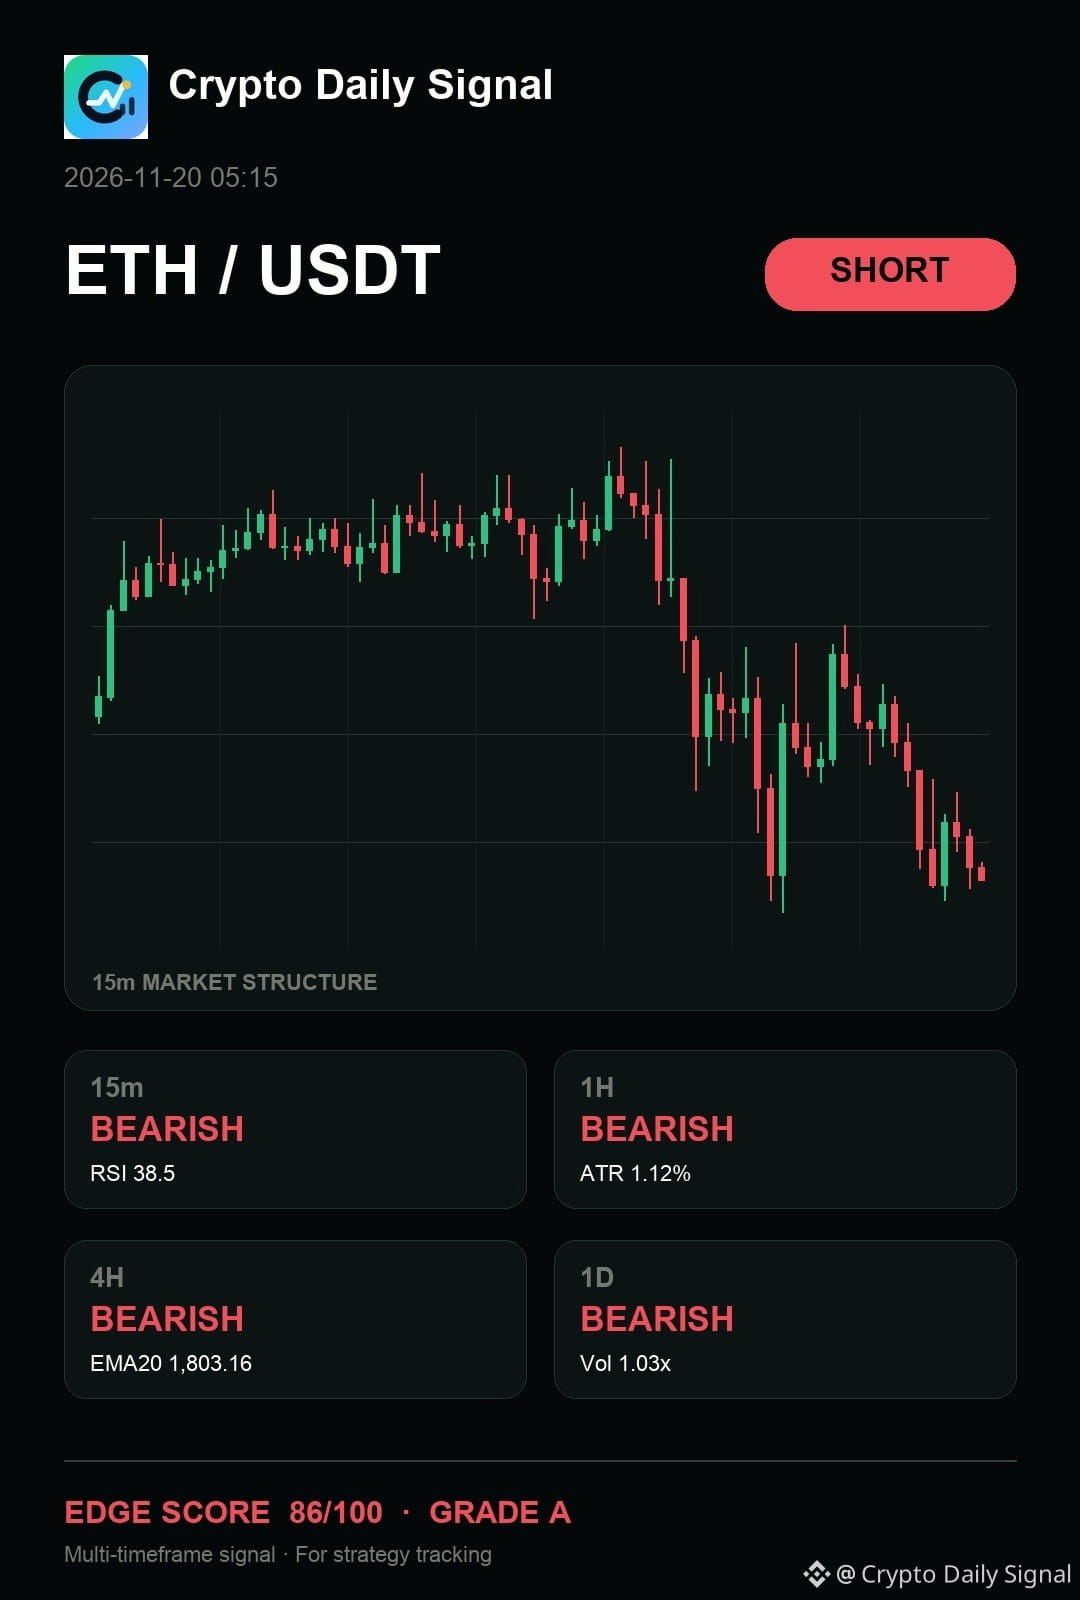
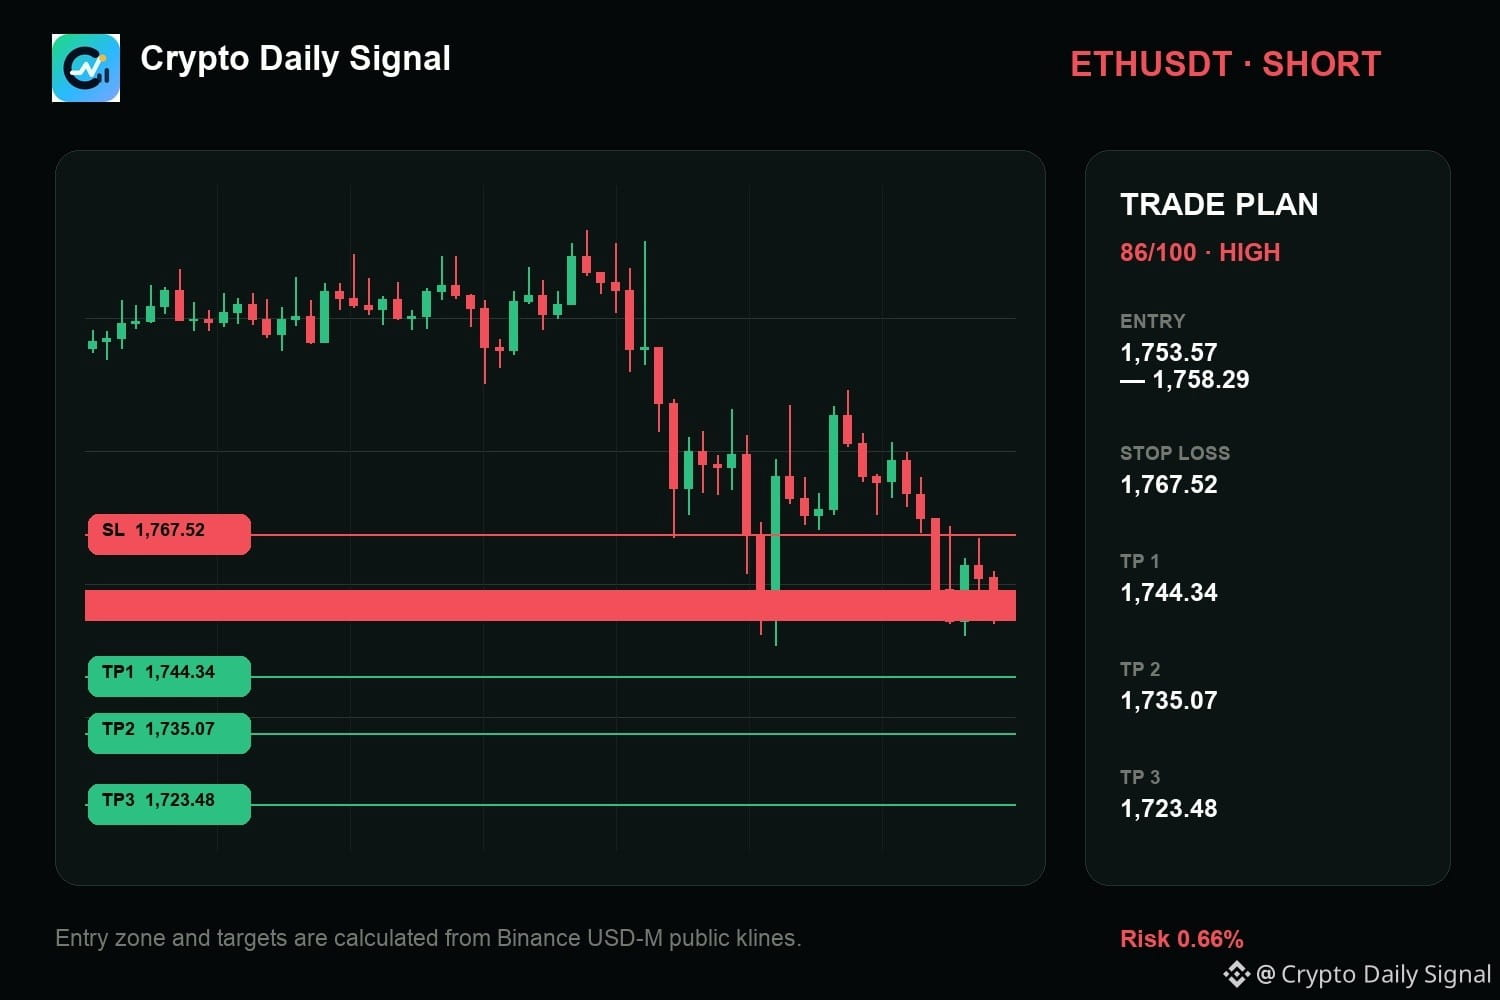
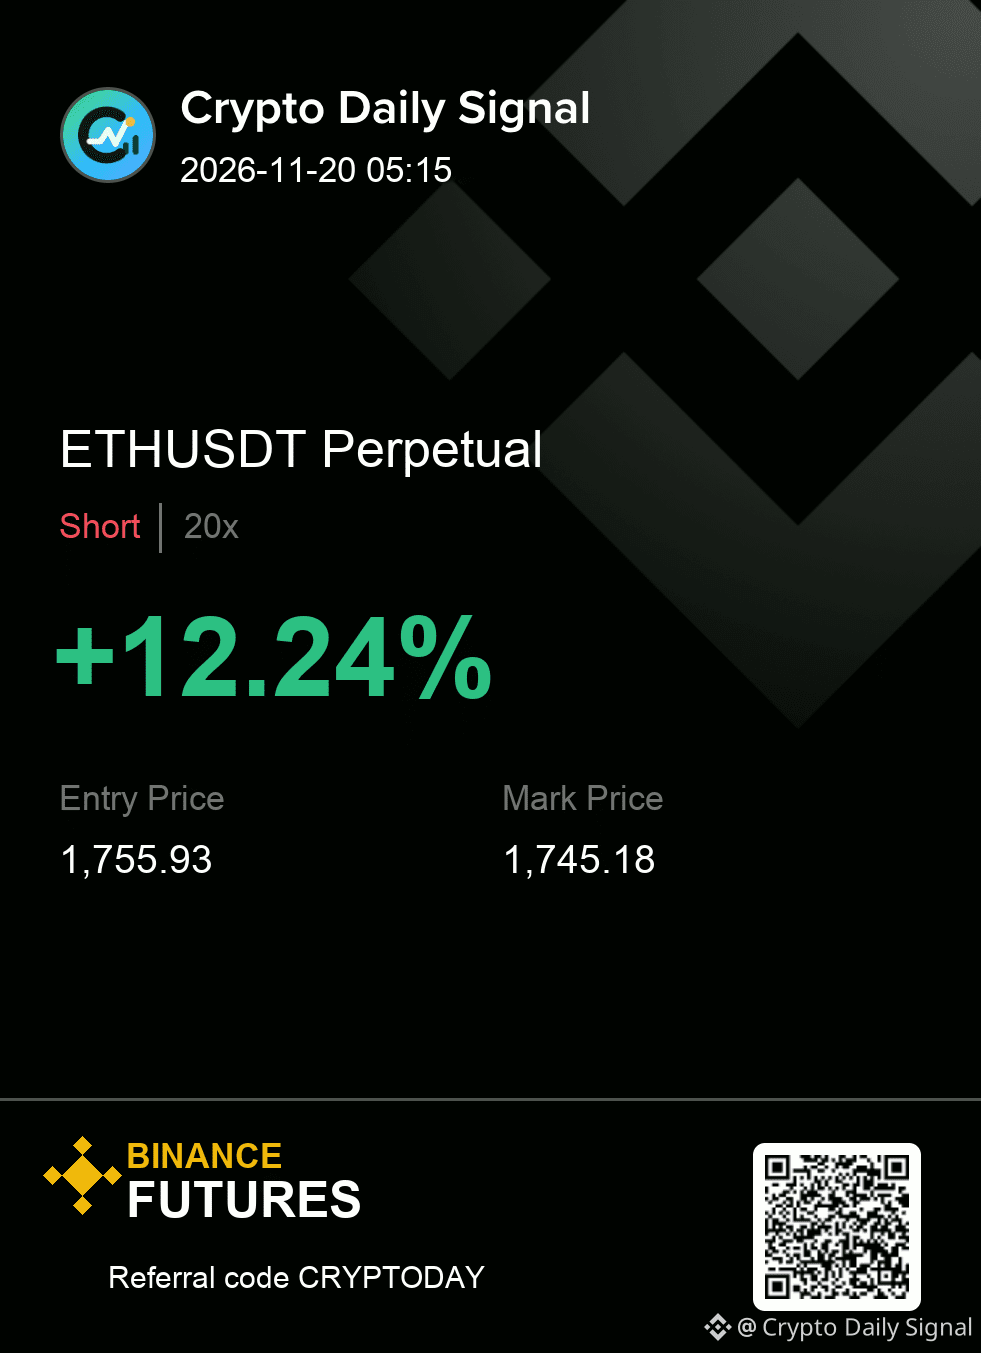
$ETH — right now, I would say it is a patience trade on the short side because the price shows lower highs and lower lows across the recent moves. The overall trend favors the downside, which is what we want to see hold. A decisive drop below the immediate range floor makes this trade stronger, while a quick push back up above that higher point would kill the move.
Trade Plan — ETHUSDT SHORT
Entry: 1,753.57 - 1,758.29
Stop Loss: 1,767.52
TP1: 1,744.34 | TP2: 1,735.07 | TP3: 1,723.48
I only want the planned reaction; anything else is a pass.
#TradingSignal
{future}(ETHUSDT)
$ETH — right now, I would say it is a patience trade on the short side because the price shows lower highs and lower lows across the recent moves. The overall trend favors the downside, which is what we want to see hold. A decisive drop below the immediate range floor makes this trade stronger, while a quick push back up above that higher point would kill the move.
Trade Plan — ETHUSDT SHORT
Entry: 1,753.57 - 1,758.29
Stop Loss: 1,767.52
TP1: 1,744.34 | TP2: 1,735.07 | TP3: 1,723.48
I only want the planned reaction; anything else is a pass.
#TradingSignal
Trade Plan — ETHUSDT SHORT
Entry: 1,753.57 - 1,758.29
Stop Loss: 1,767.52
TP1: 1,744.34 | TP2: 1,735.07 | TP3: 1,723.48
I only want the planned reaction; anything else is a pass.
#TradingSignal
14

·
--
🔥 V4 validated setup for IRYSUSDT.
Bias: LONG | Structure: BULLISH_PRESSURE
Entry: 0.02216 | SL: 0.021893 | TP1: 0.02256 | TP2: 0.022826
Combined Score: 53.85 | Performance: 84.67
24h price +28.22% | Volume spikes confirmed.
A setup, not a guaranteed result.
Question: Are you watching the volume breakout? 👀
#CryptoSetup
$IRYS #TradingSignal #CryptoAnalysis
🔥 V4 validated setup for IRYSUSDT.
Bias: LONG | Structure: BULLISH_PRESSURE
Entry: 0.02216 | SL: 0.021893 | TP1: 0.02256 | TP2: 0.022826
Combined Score: 53.85 | Performance: 84.67
24h price +28.22% | Volume spikes confirmed.
A setup, not a guaranteed result.
Question: Are you watching the volume breakout? 👀
#CryptoSetup
$IRYS #TradingSignal #CryptoAnalysis
Bias: LONG | Structure: BULLISH_PRESSURE
Entry: 0.02216 | SL: 0.021893 | TP1: 0.02256 | TP2: 0.022826
Combined Score: 53.85 | Performance: 84.67
24h price +28.22% | Volume spikes confirmed.
A setup, not a guaranteed result.
Question: Are you watching the volume breakout? 👀
#CryptoSetup
$IRYS #TradingSignal #CryptoAnalysis

148
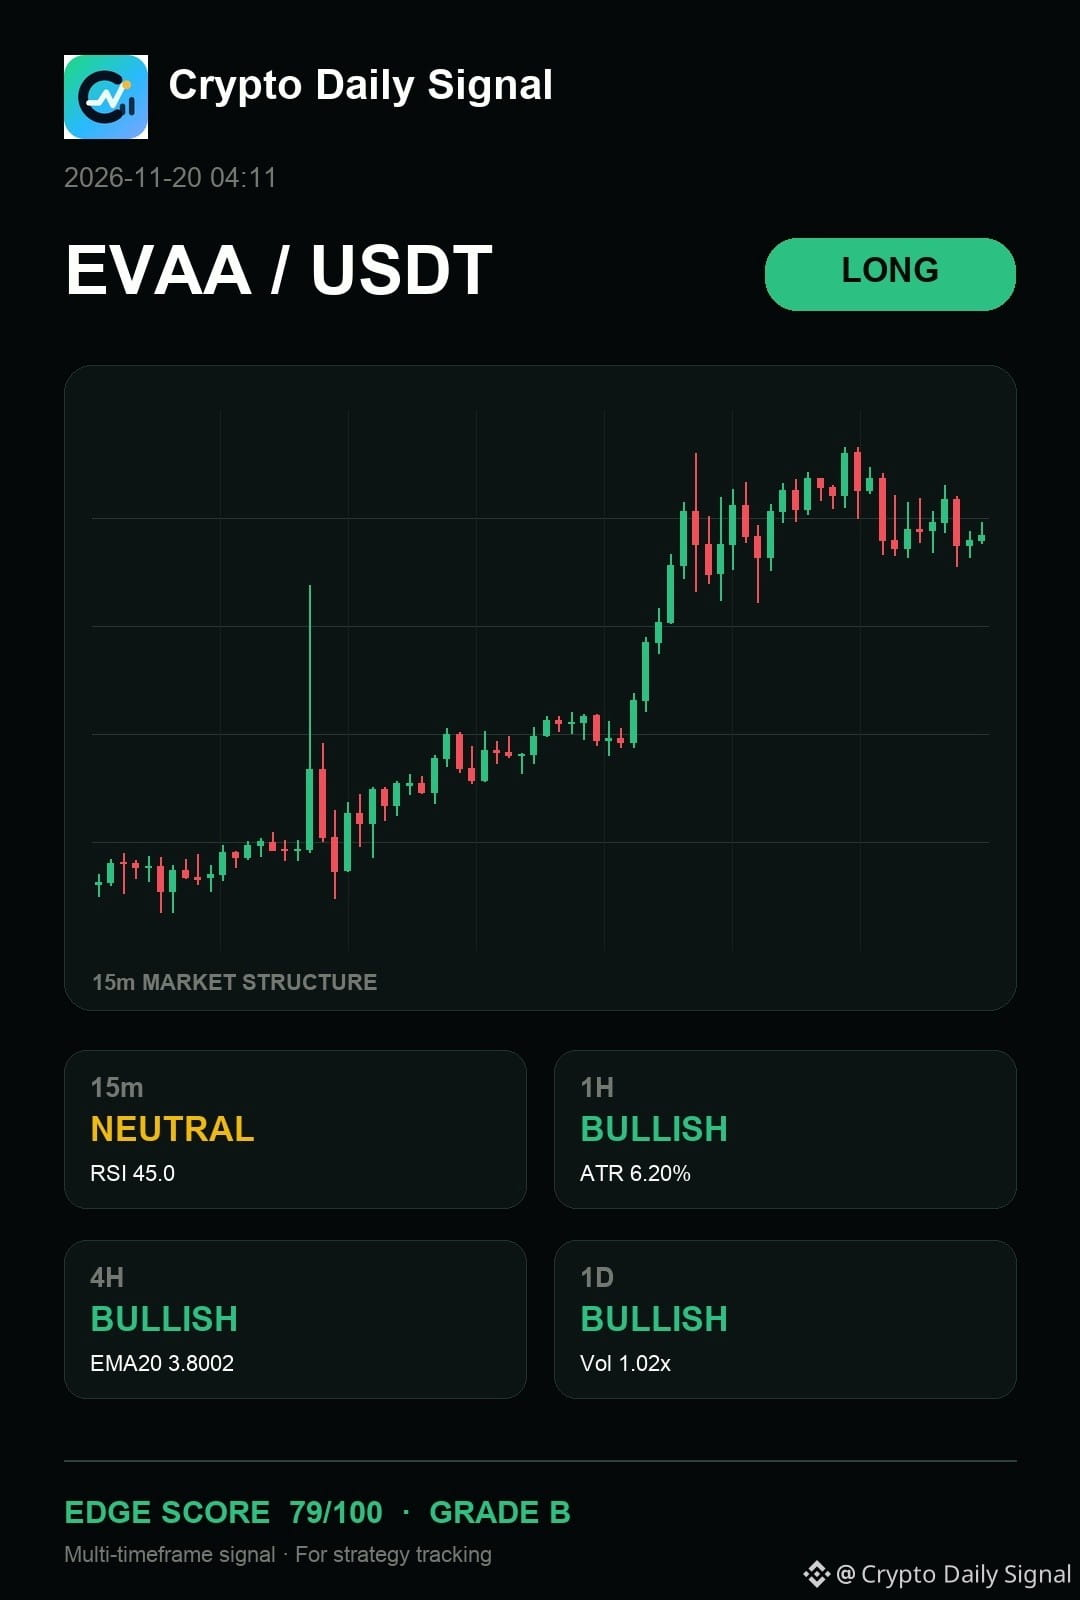
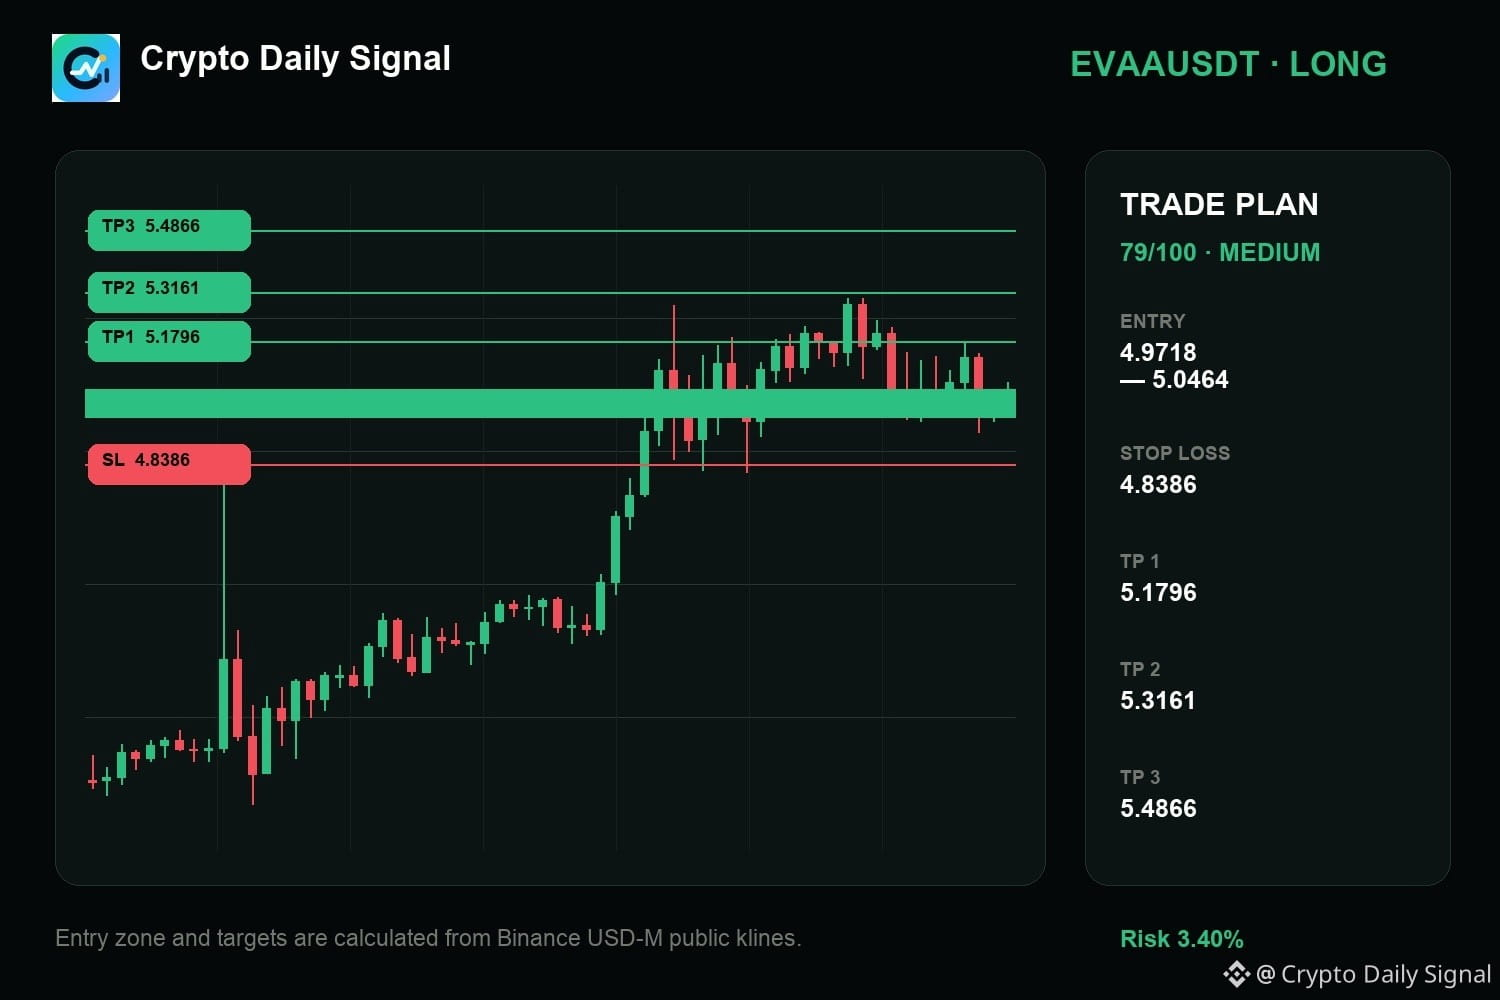
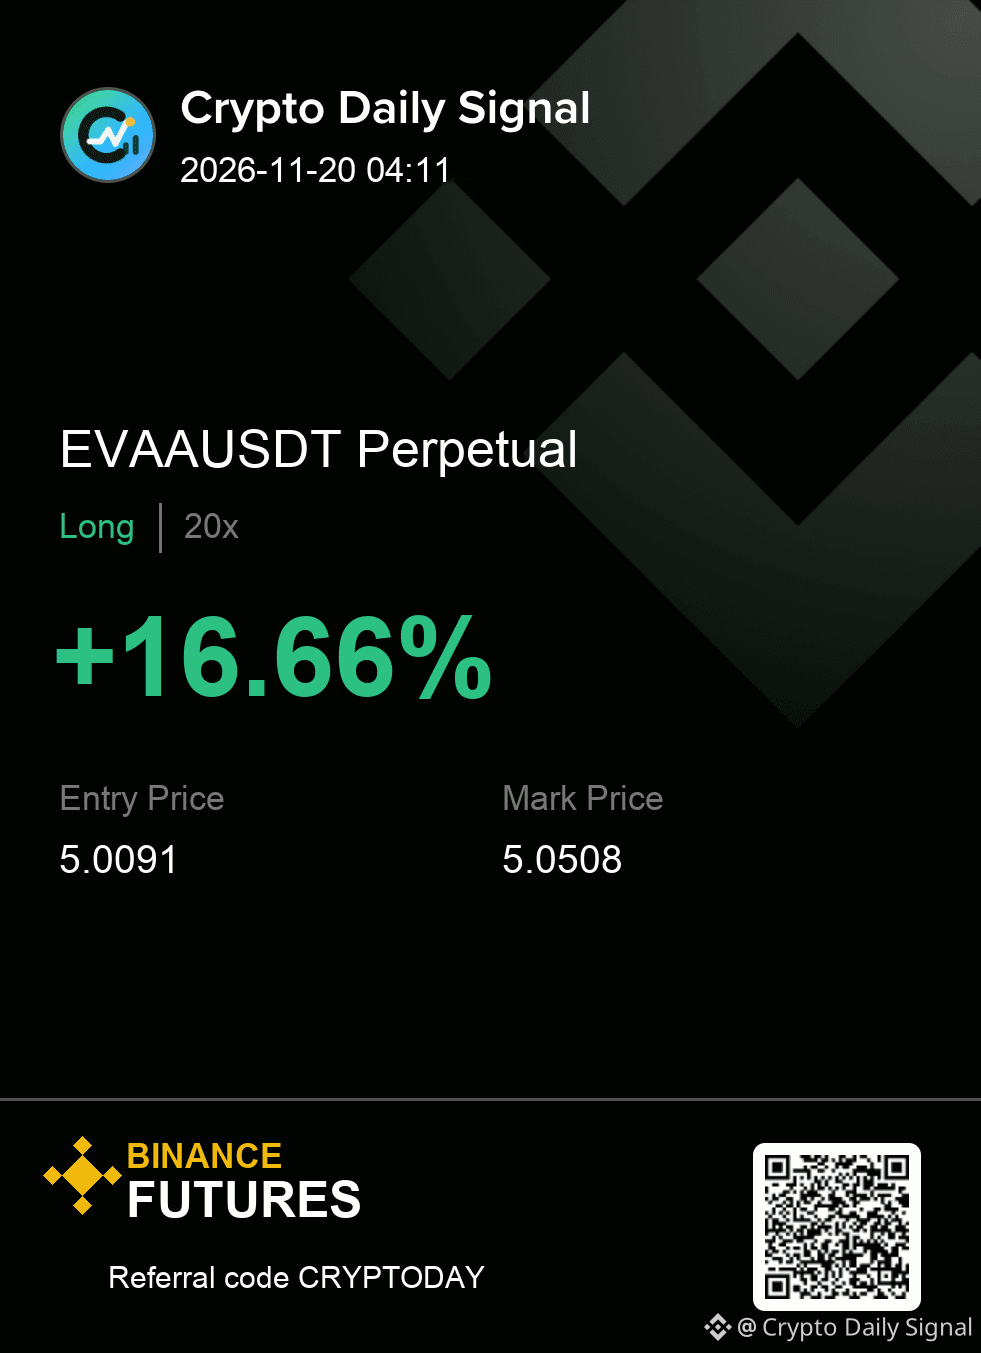
$EVAA — from my side, the tape says it is a long watch, not a blind chase. The daily trend remains bullish, while the four-hour view is bullish, so I would rather let price come into the map. If that zone rejects the idea instead of confirming it, I am out. Patience matters more than being first.
EVAAUSDT | LONG
Entry 4.9718 - 5.0464
Invalidation 4.8386
Targets 5.1796 / 5.3161 / 5.4866
#TradingSignal
{future}(EVAAUSDT)
$EVAA — from my side, the tape says it is a long watch, not a blind chase. The daily trend remains bullish, while the four-hour view is bullish, so I would rather let price come into the map. If that zone rejects the idea instead of confirming it, I am out. Patience matters more than being first.
EVAAUSDT | LONG
Entry 4.9718 - 5.0464
Invalidation 4.8386
Targets 5.1796 / 5.3161 / 5.4866
#TradingSignal
EVAAUSDT | LONG
Entry 4.9718 - 5.0464
Invalidation 4.8386
Targets 5.1796 / 5.3161 / 5.4866
#TradingSignal
23
·
--
🔥 YBUSDT SHORT SETUP
Combined score: 44.18. Bearish breakdown confirmed.
Entry: 0.05454 | SL: 0.055558
TP1: 0.053013 | TP2: 0.051994
Strong volume spikes and negative momentum support the bias.
⚠️ This is a setup, not a guaranteed result.
Question: Will YB respect the bearish structure?
$YB #TradingSignal #CryptoAnalysis
🔥 YBUSDT SHORT SETUP
Combined score: 44.18. Bearish breakdown confirmed.
Entry: 0.05454 | SL: 0.055558
TP1: 0.053013 | TP2: 0.051994
Strong volume spikes and negative momentum support the bias.
⚠️ This is a setup, not a guaranteed result.
Question: Will YB respect the bearish structure?
$YB #TradingSignal #CryptoAnalysis
Combined score: 44.18. Bearish breakdown confirmed.
Entry: 0.05454 | SL: 0.055558
TP1: 0.053013 | TP2: 0.051994
Strong volume spikes and negative momentum support the bias.
⚠️ This is a setup, not a guaranteed result.
Question: Will YB respect the bearish structure?
$YB #TradingSignal #CryptoAnalysis

78
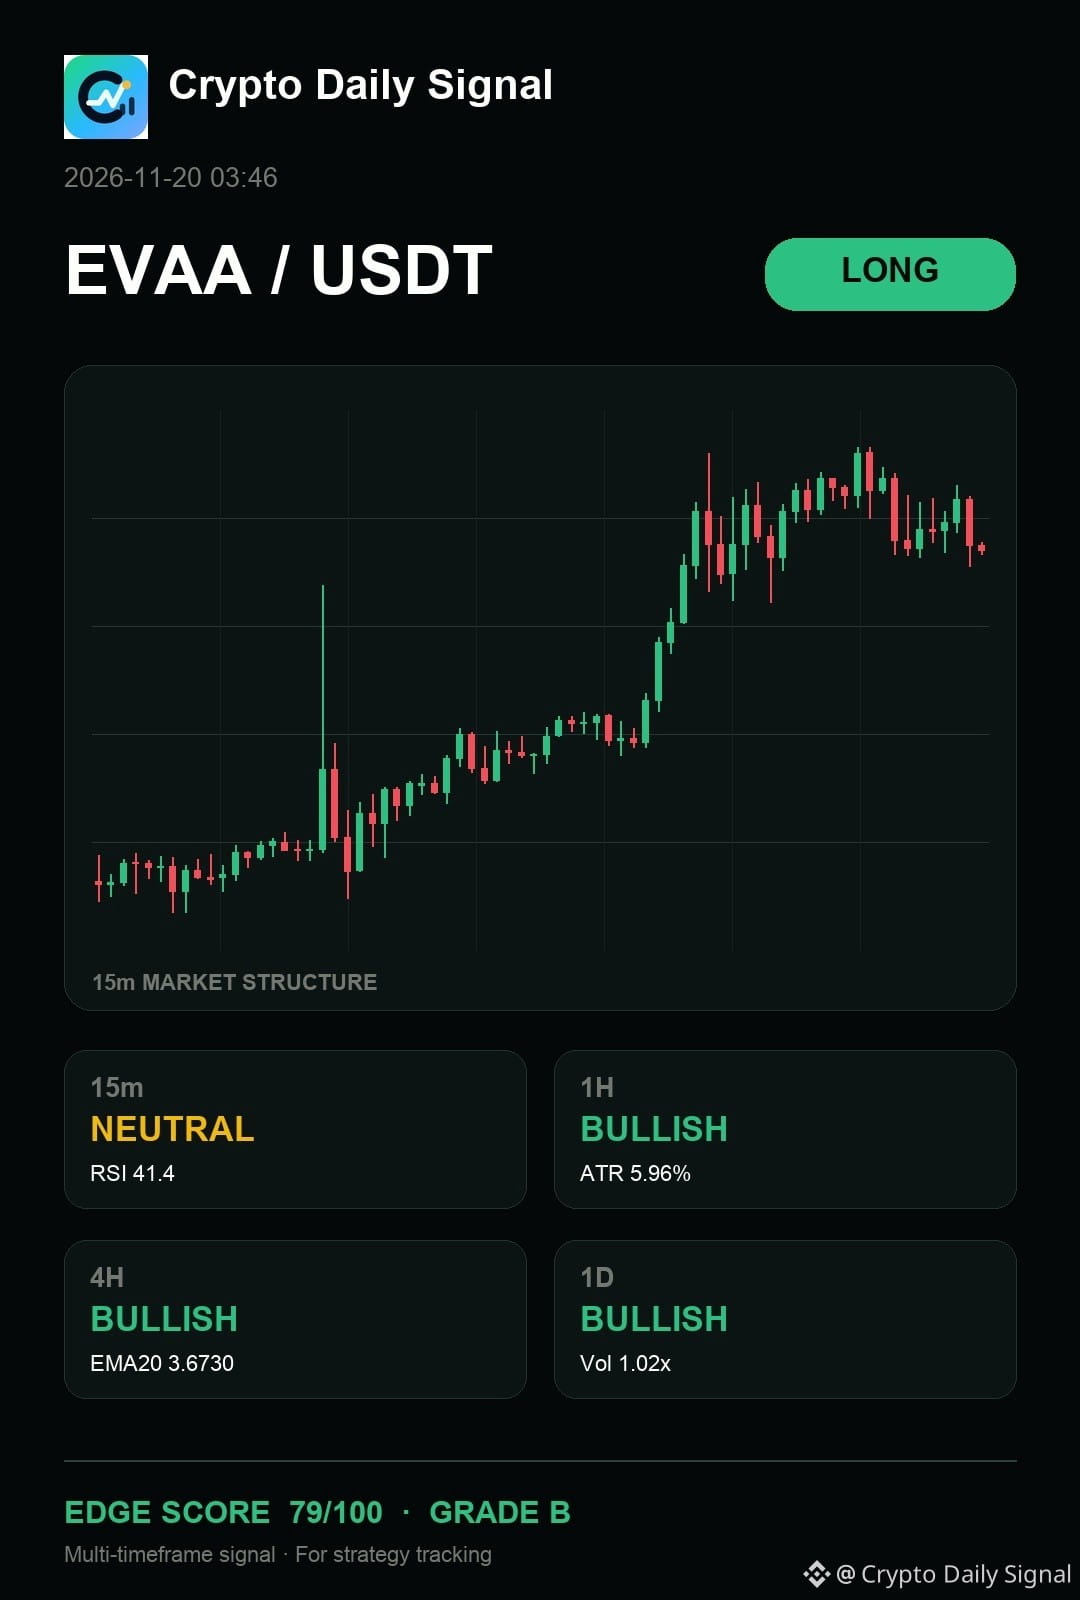
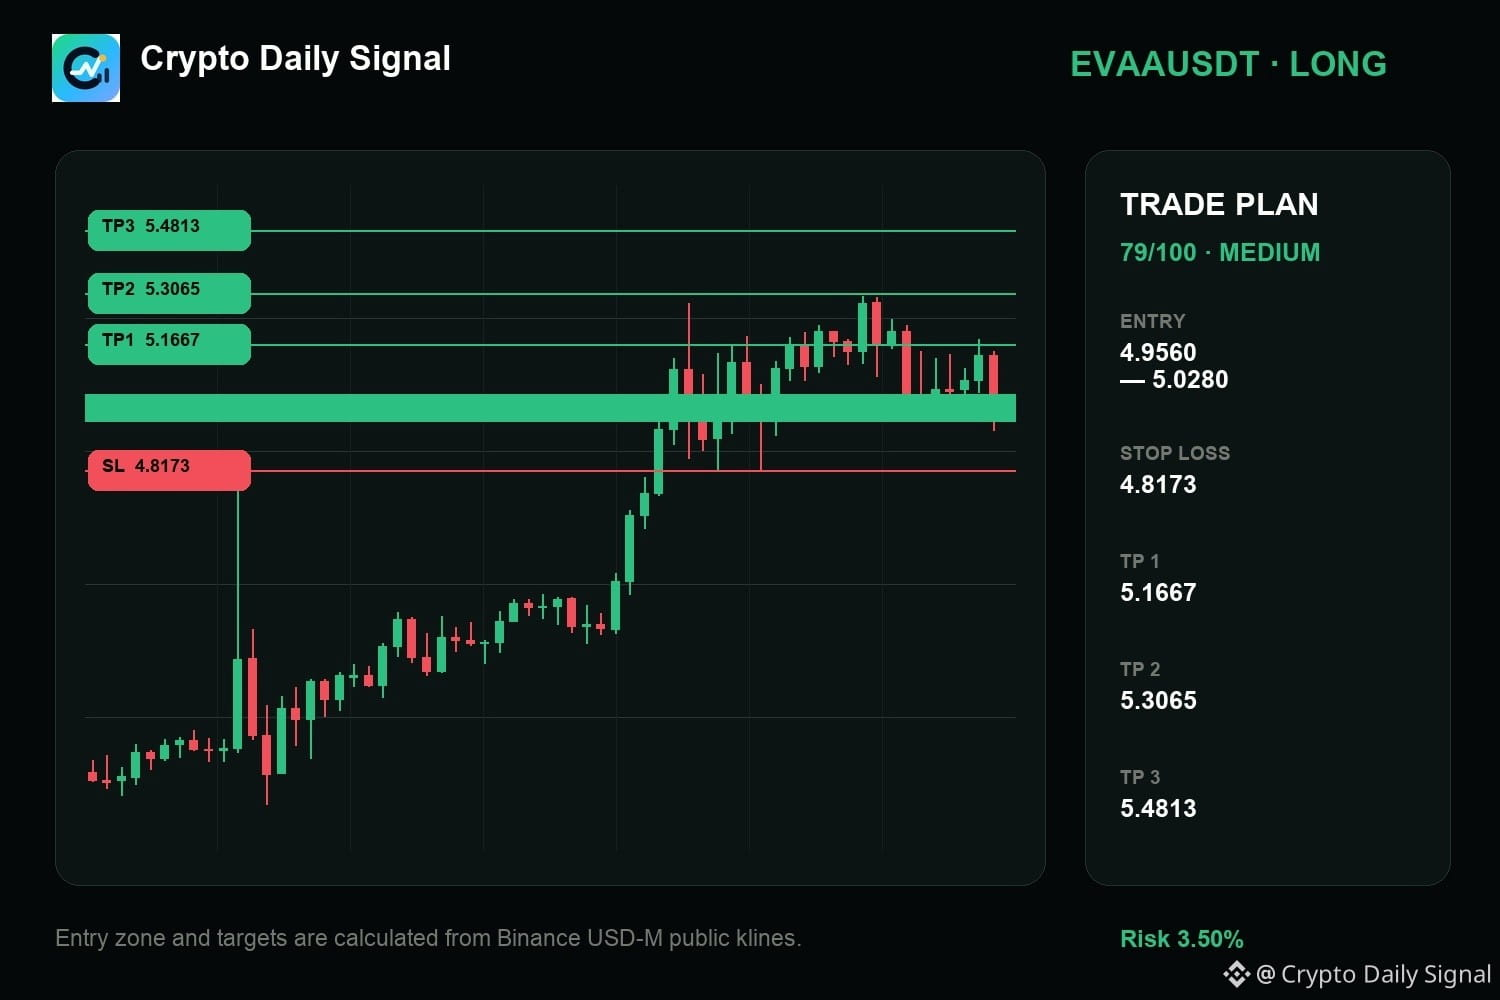
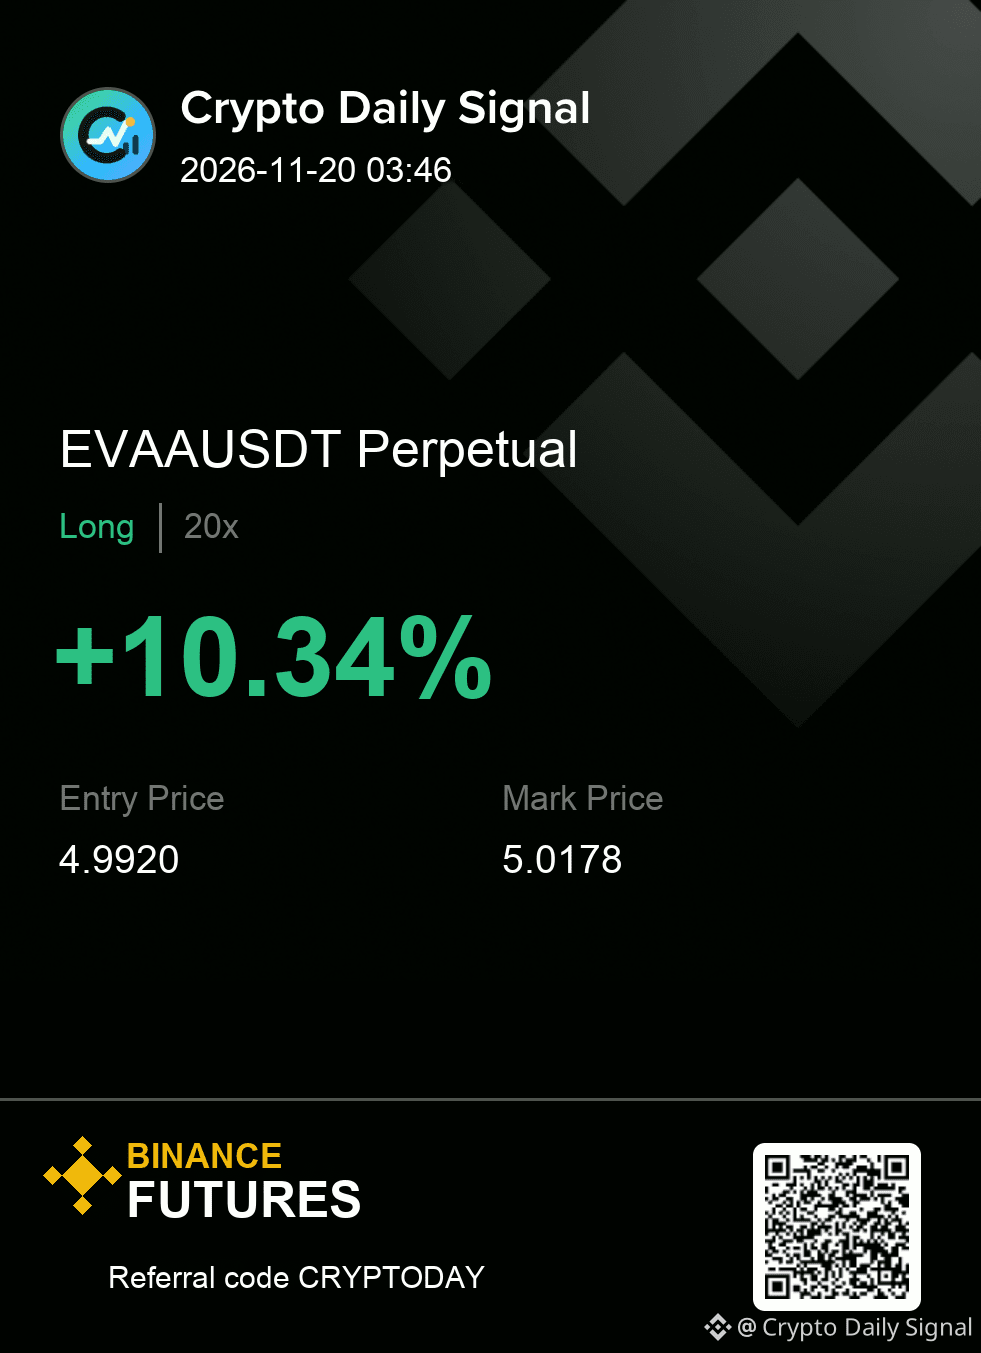
$EVAA still offers the cleaner bullish argument as the price breaks above the recent range high on strong upward candles. The higher-low formation developing on the chart suggests momentum is catching fire, though watching the fifteen-minute volume staying subdued could weaken this.
Worth tracking from here, or does the range still need more time?
Execution plan (EVAAUSDT — LONG)
Entry: 4.9560 - 5.0280 | SL: 4.8173
Take profit: 5.1667 → 5.3065 → 5.4813
#TradingSignal
{future}(EVAAUSDT)
$EVAA still offers the cleaner bullish argument as the price breaks above the recent range high on strong upward candles. The higher-low formation developing on the chart suggests momentum is catching fire, though watching the fifteen-minute volume staying subdued could weaken this.
Worth tracking from here, or does the range still need more time?
Execution plan (EVAAUSDT — LONG)
Entry: 4.9560 - 5.0280 | SL: 4.8173
Take profit: 5.1667 → 5.3065 → 5.4813
#TradingSignal
Worth tracking from here, or does the range still need more time?
Execution plan (EVAAUSDT — LONG)
Entry: 4.9560 - 5.0280 | SL: 4.8173
Take profit: 5.1667 → 5.3065 → 5.4813
#TradingSignal
6
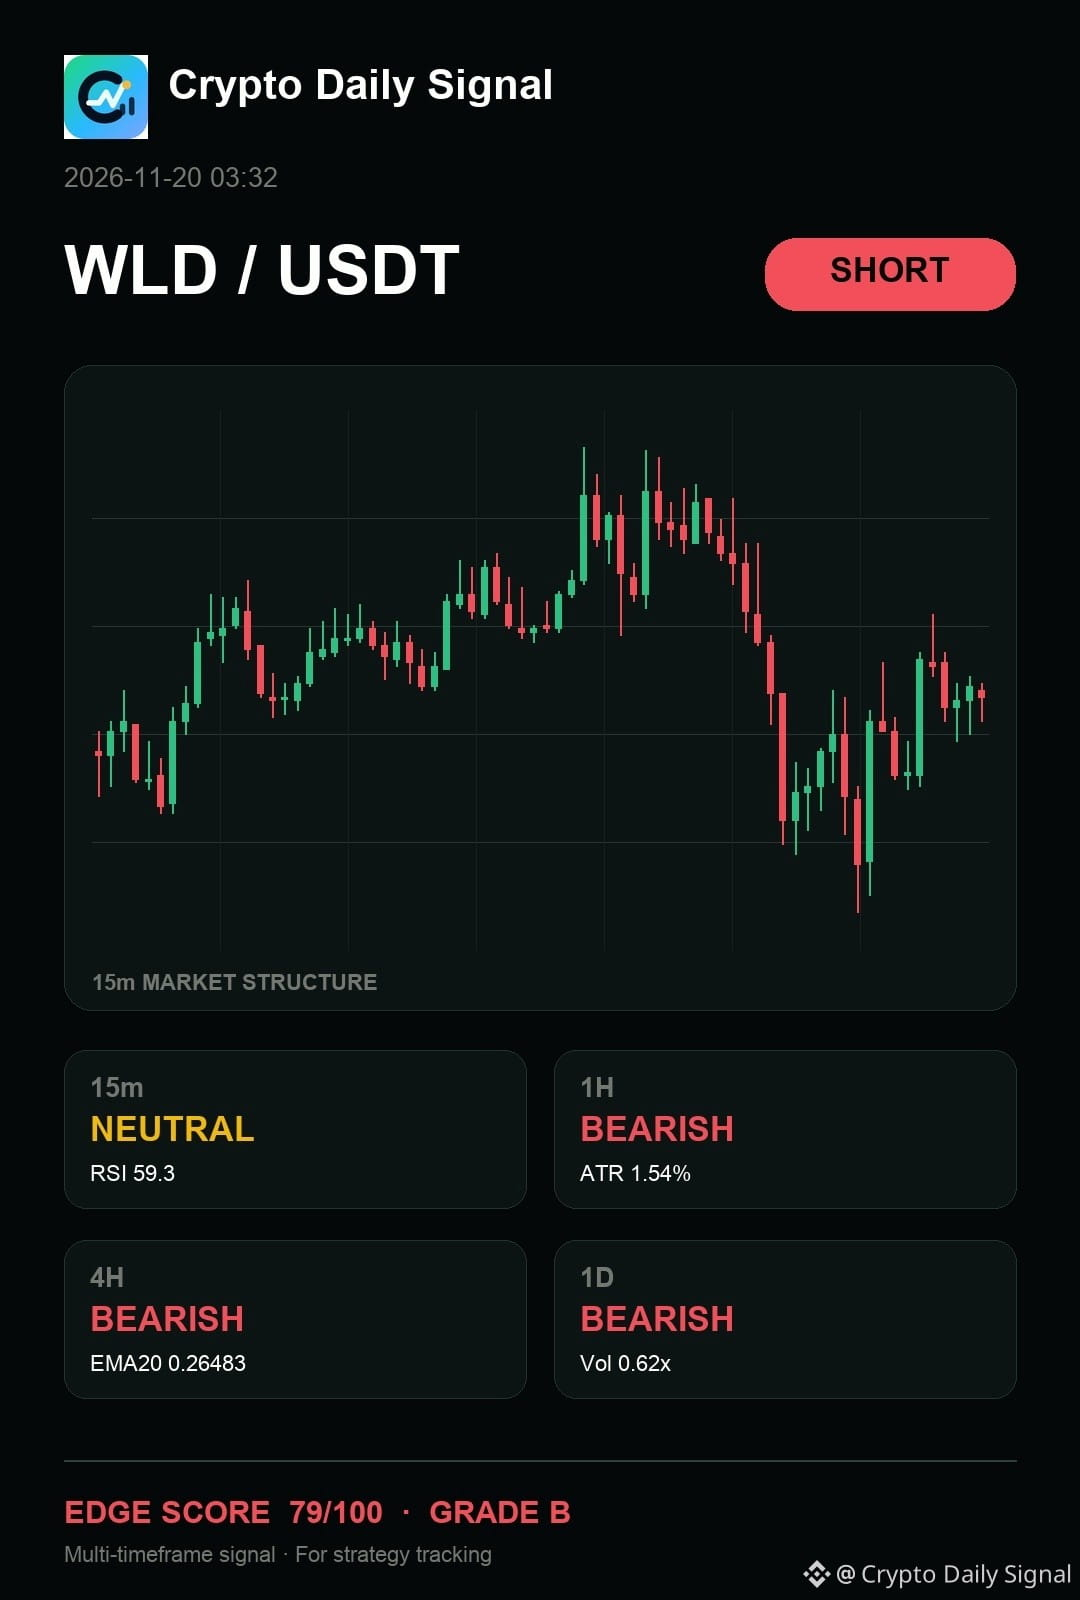
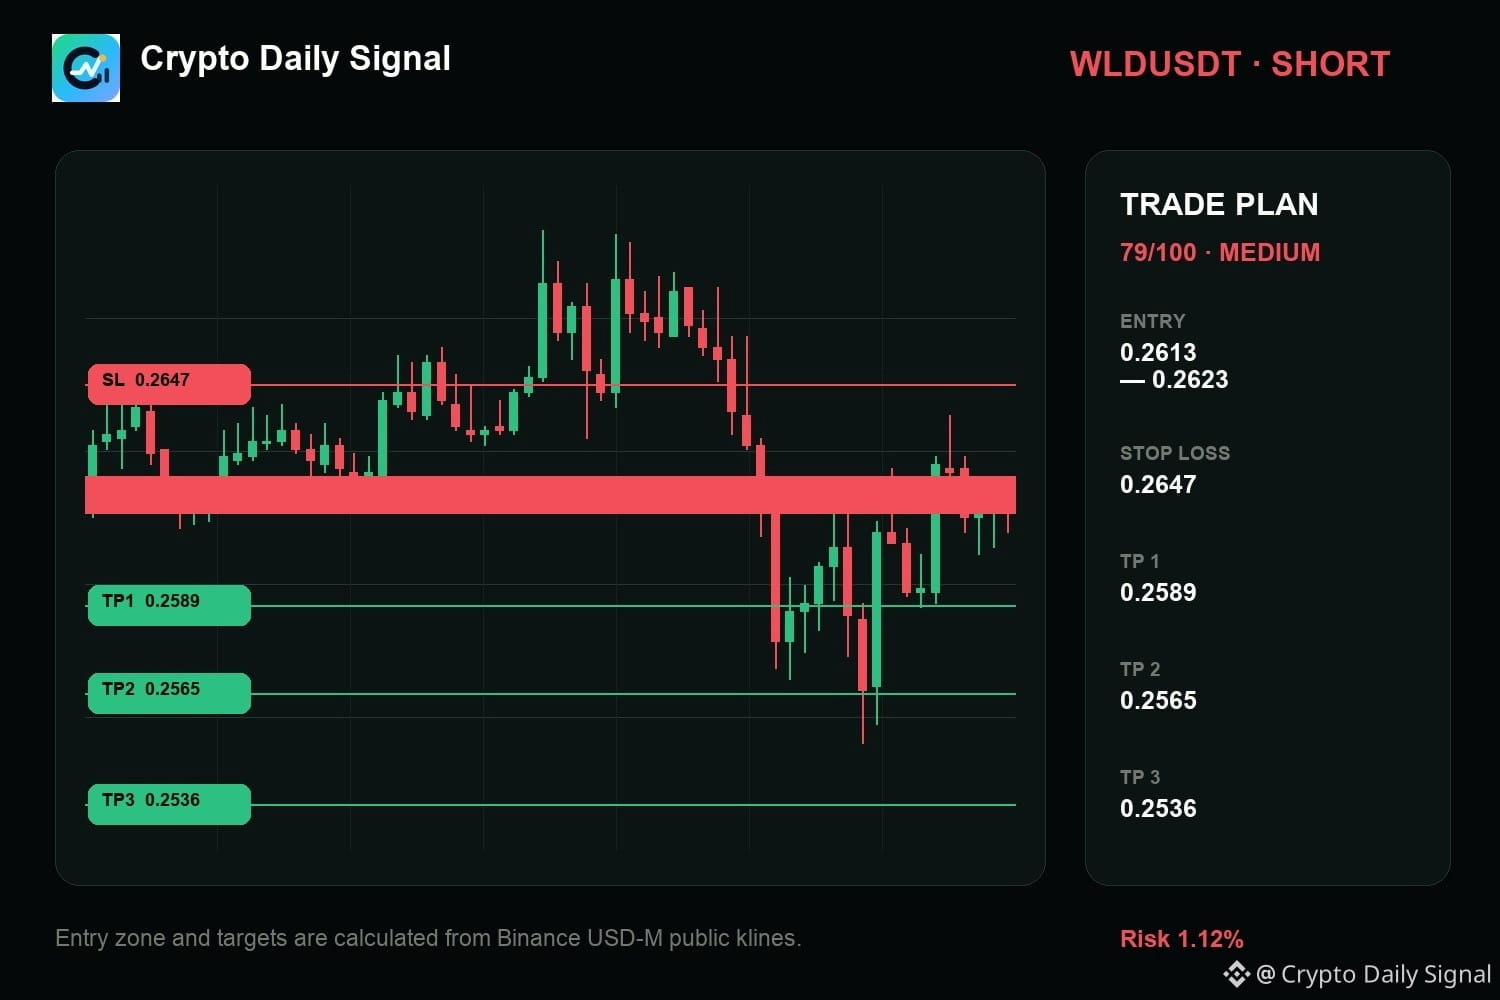
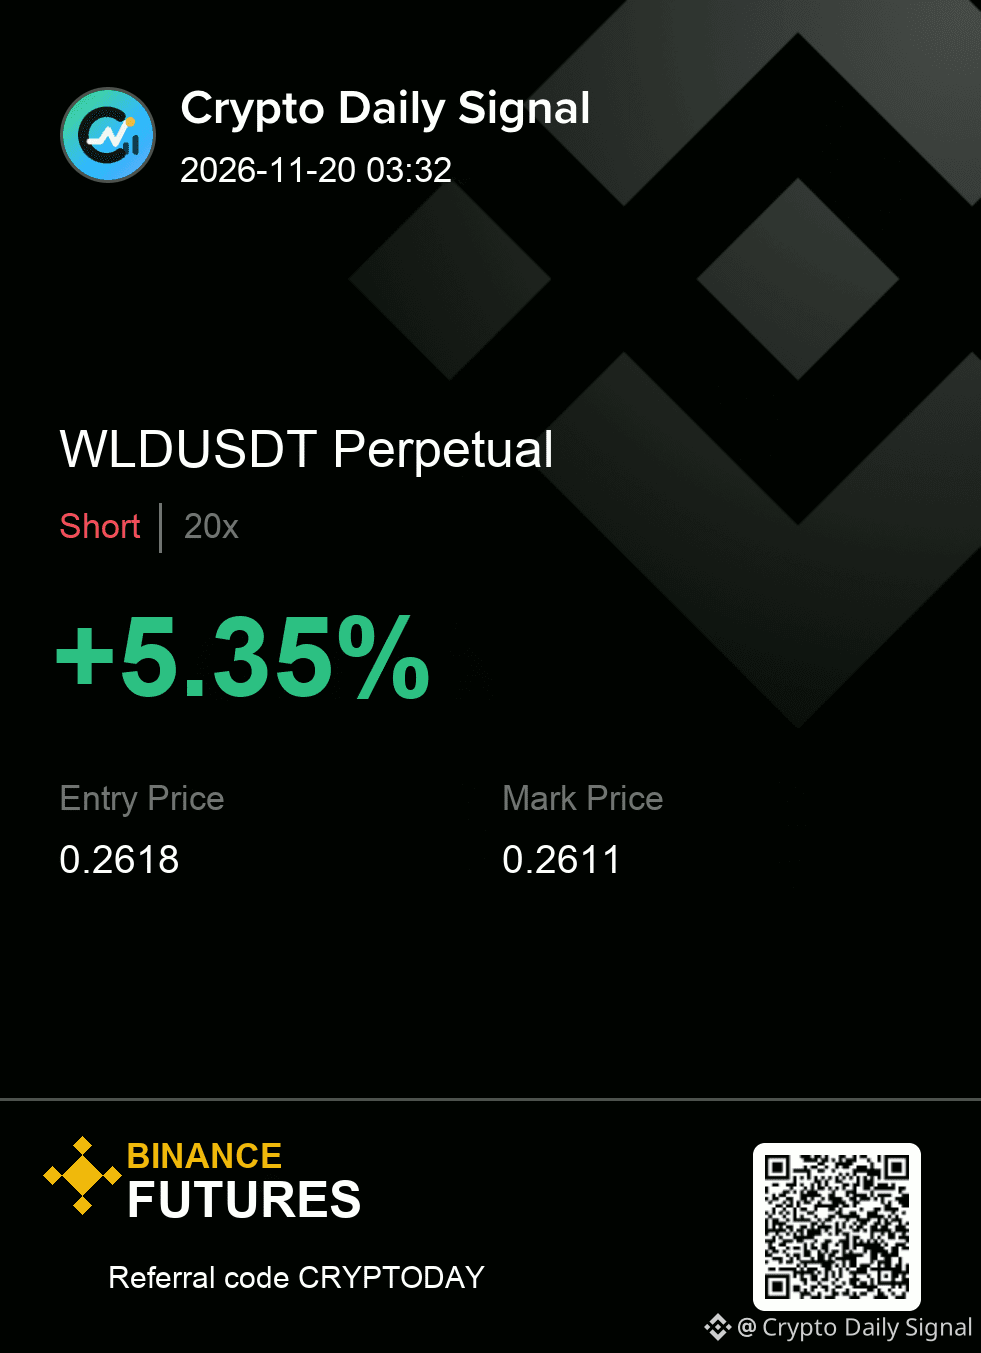
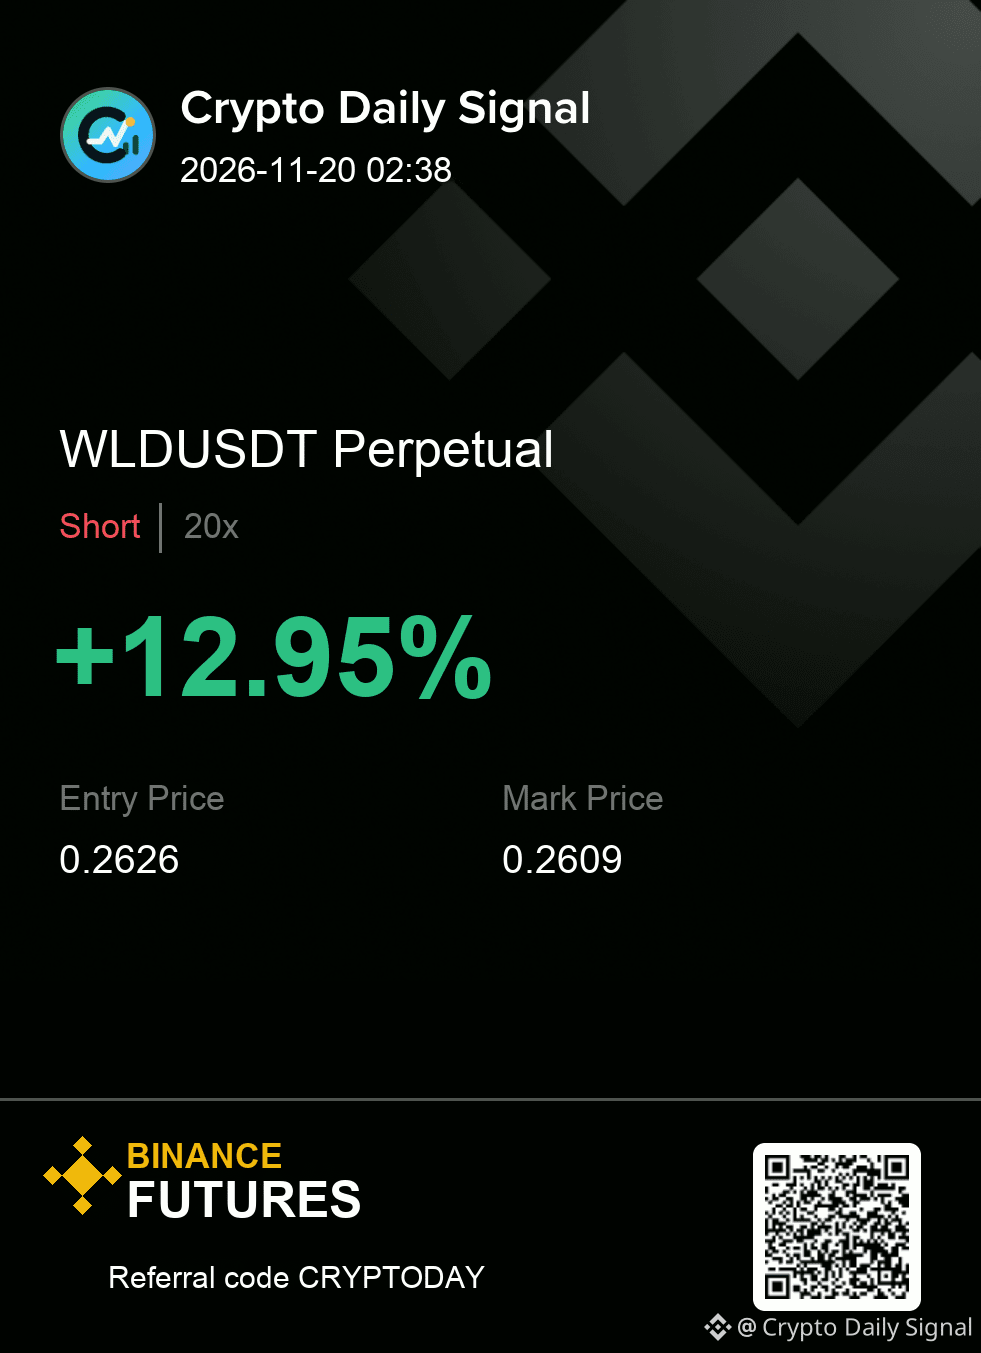
$WLD — one thing is clear to me: it is one rejection away from a cleaner short. The pattern of lower highs emerging across the recent peak suggests bearish pressure is taking hold. A move decisively below the latest low would confirm the downward tilt shown on the daily and four-hour views.
WLDUSDT SHORT
IN 0.2613 - 0.2623
OUT 0.2647
TP 0.2589 · 0.2565 · 0.2536
Execution is simple here: respect the zone and respect the cut.
#TradingSignal
{future}(WLDUSDT)
$WLD — one thing is clear to me: it is one rejection away from a cleaner short. The pattern of lower highs emerging across the recent peak suggests bearish pressure is taking hold. A move decisively below the latest low would confirm the downward tilt shown on the daily and four-hour views.
WLDUSDT SHORT
IN 0.2613 - 0.2623
OUT 0.2647
TP 0.2589 · 0.2565 · 0.2536
Execution is simple here: respect the zone and respect the cut.
#TradingSignal
WLDUSDT SHORT
IN 0.2613 - 0.2623
OUT 0.2647
TP 0.2589 · 0.2565 · 0.2536
Execution is simple here: respect the zone and respect the cut.
#TradingSignal
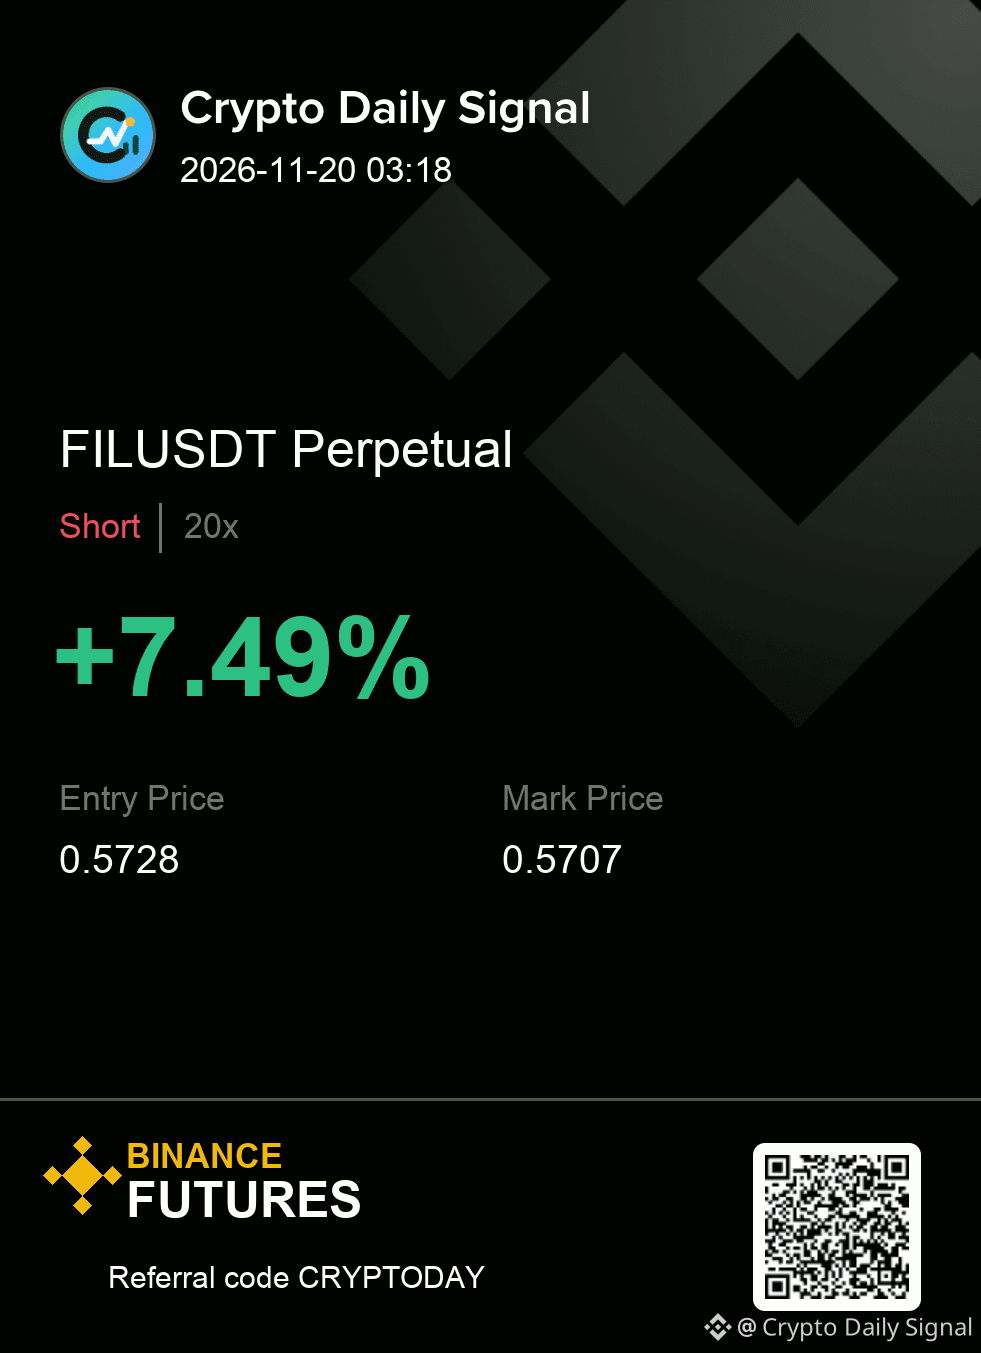
22
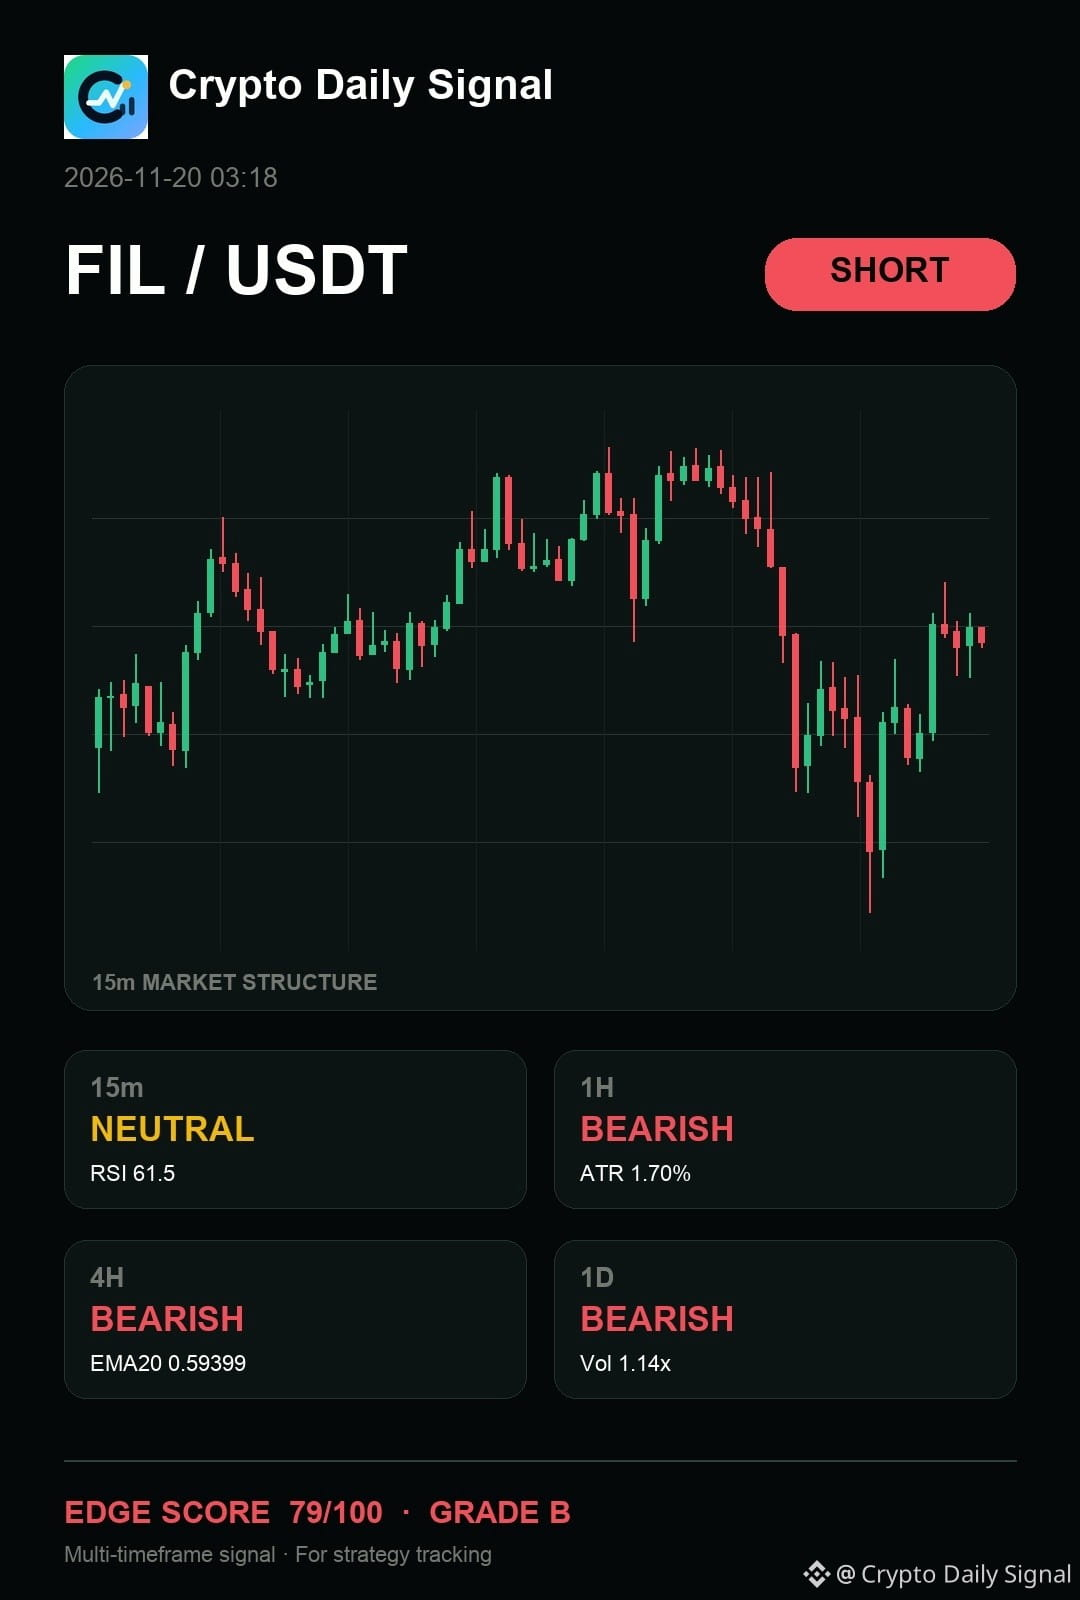
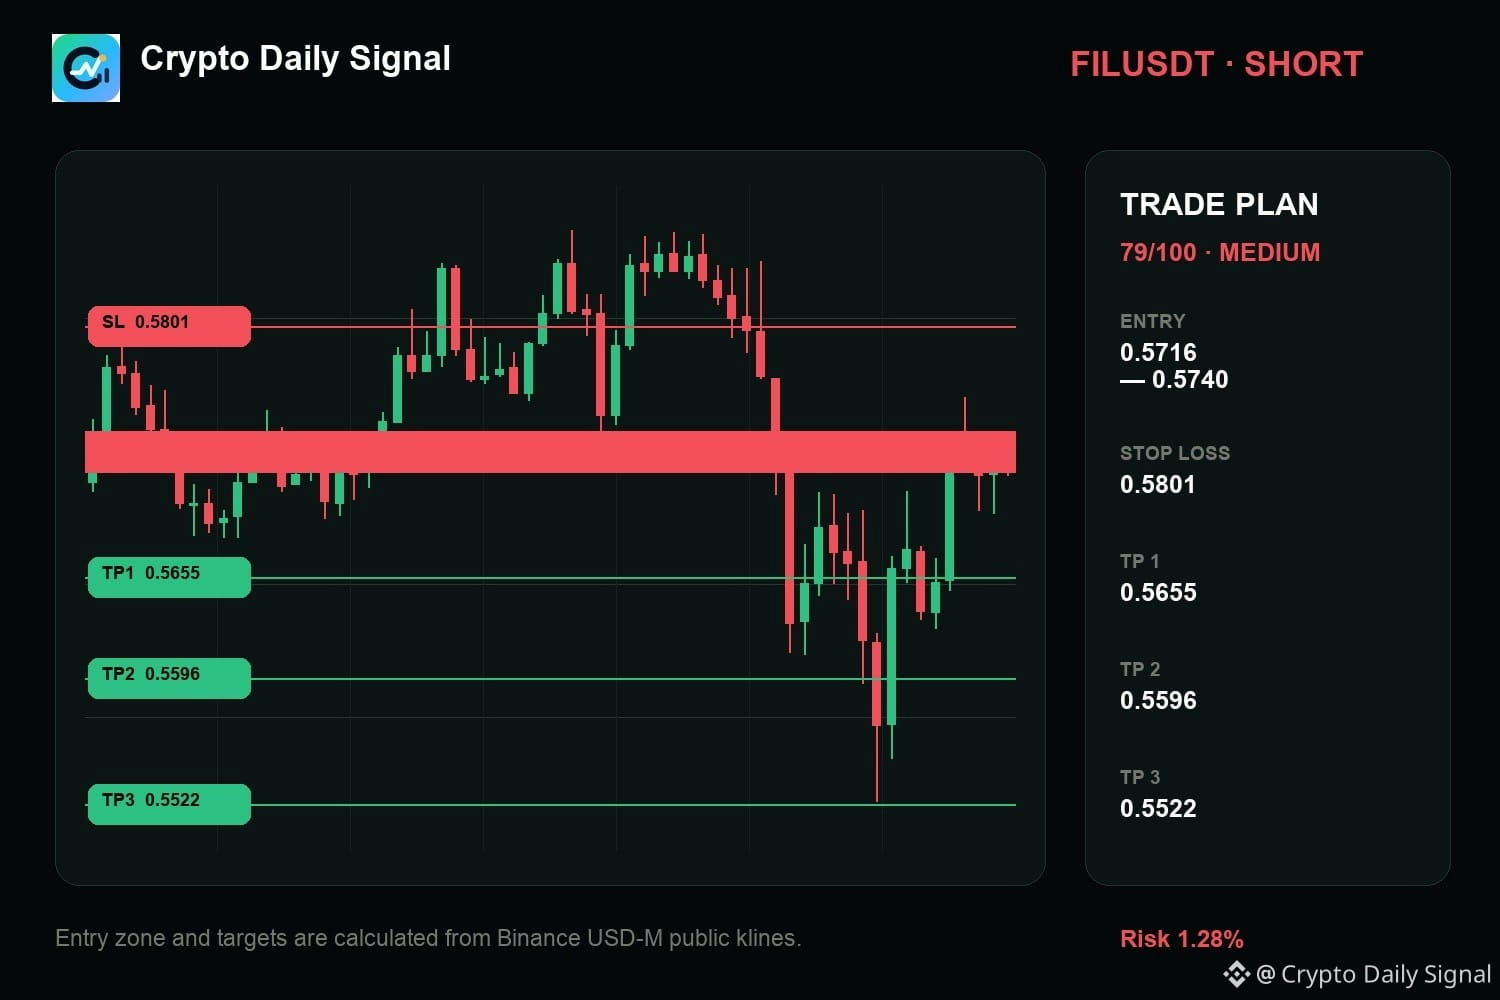
$FIL keeps me focused on the downside response after its recent push encountered resistance. The price is staying confined inside a relatively tight trading box, and the action on the shorter timeframes is showing weakness as higher swings fail. For this short setup to play out cleanly, we need to see a drop below the base of that recent congestion, otherwise, the selling pressure remains unsubstantiated.
The map is useful only while the invalidation remains intact.
Levels — FILUSDT
Zone: 0.5716 - 0.5740
Cut: 0.5801
Scale: 0.5655 | 0.5596 | 0.5522
#TradingSignal
{future}(FILUSDT)
$FIL keeps me focused on the downside response after its recent push encountered resistance. The price is staying confined inside a relatively tight trading box, and the action on the shorter timeframes is showing weakness as higher swings fail. For this short setup to play out cleanly, we need to see a drop below the base of that recent congestion, otherwise, the selling pressure remains unsubstantiated.
The map is useful only while the invalidation remains intact.
Levels — FILUSDT
Zone: 0.5716 - 0.5740
Cut: 0.5801
Scale: 0.5655 | 0.5596 | 0.5522
#TradingSignal
The map is useful only while the invalidation remains intact.
Levels — FILUSDT
Zone: 0.5716 - 0.5740
Cut: 0.5801
Scale: 0.5655 | 0.5596 | 0.5522
#TradingSignal
10
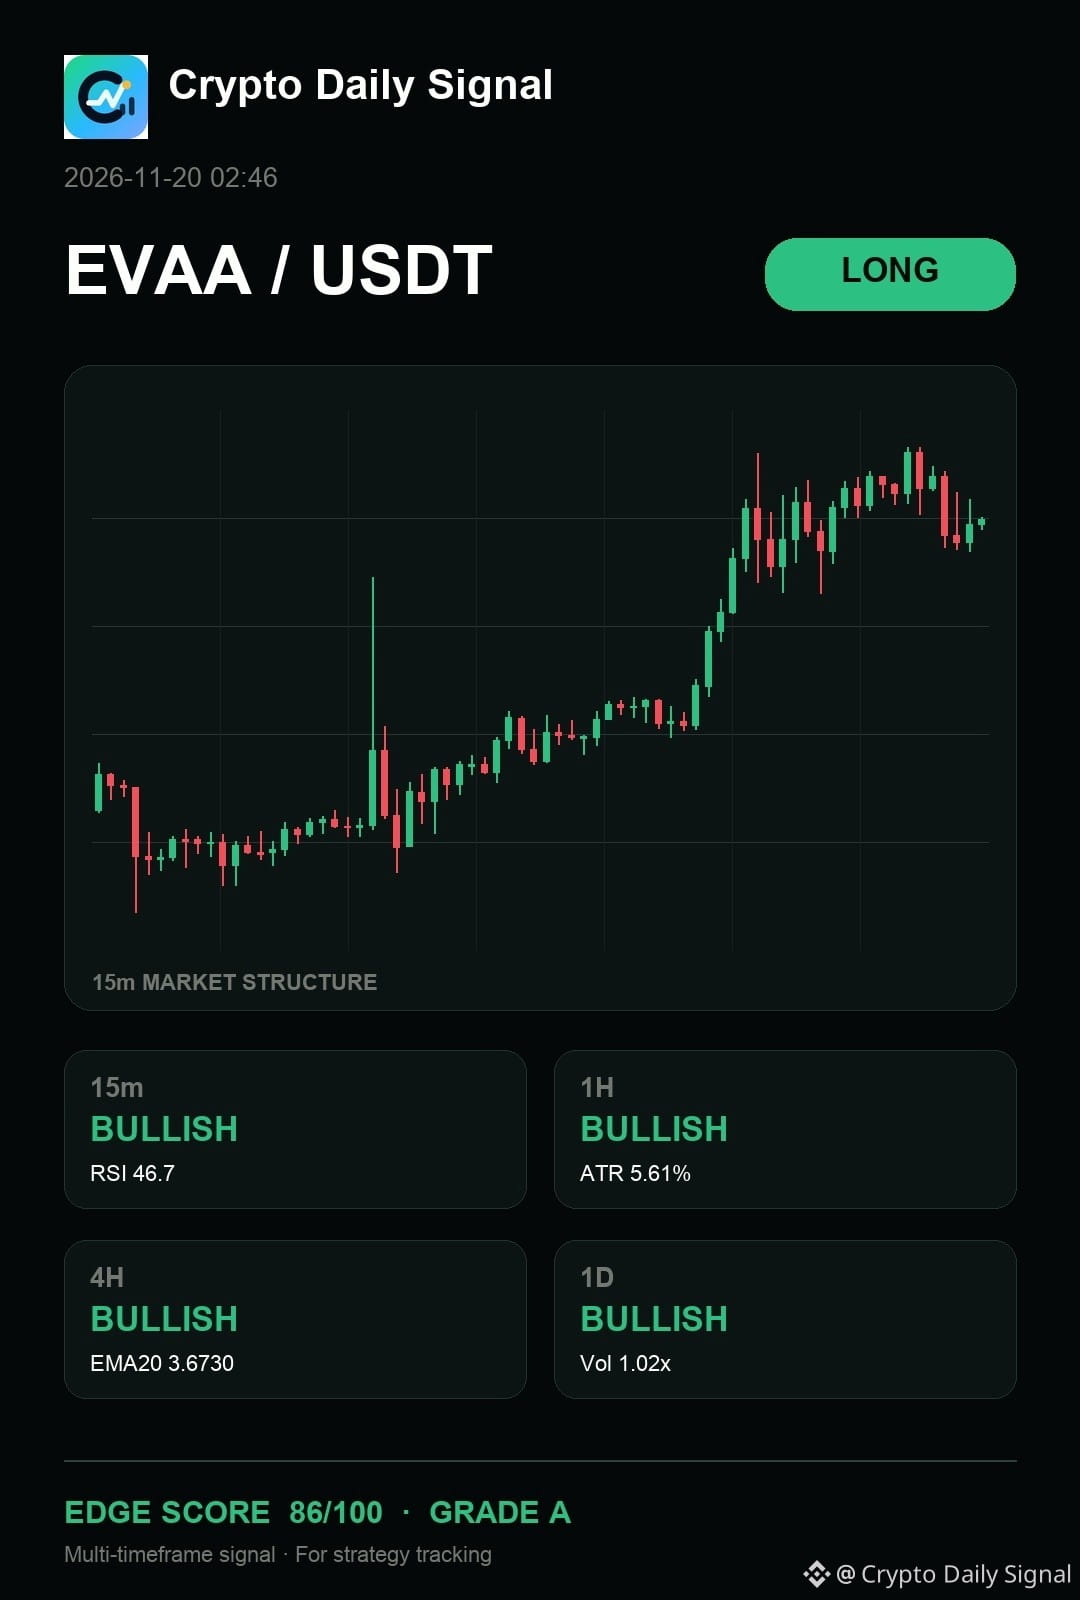
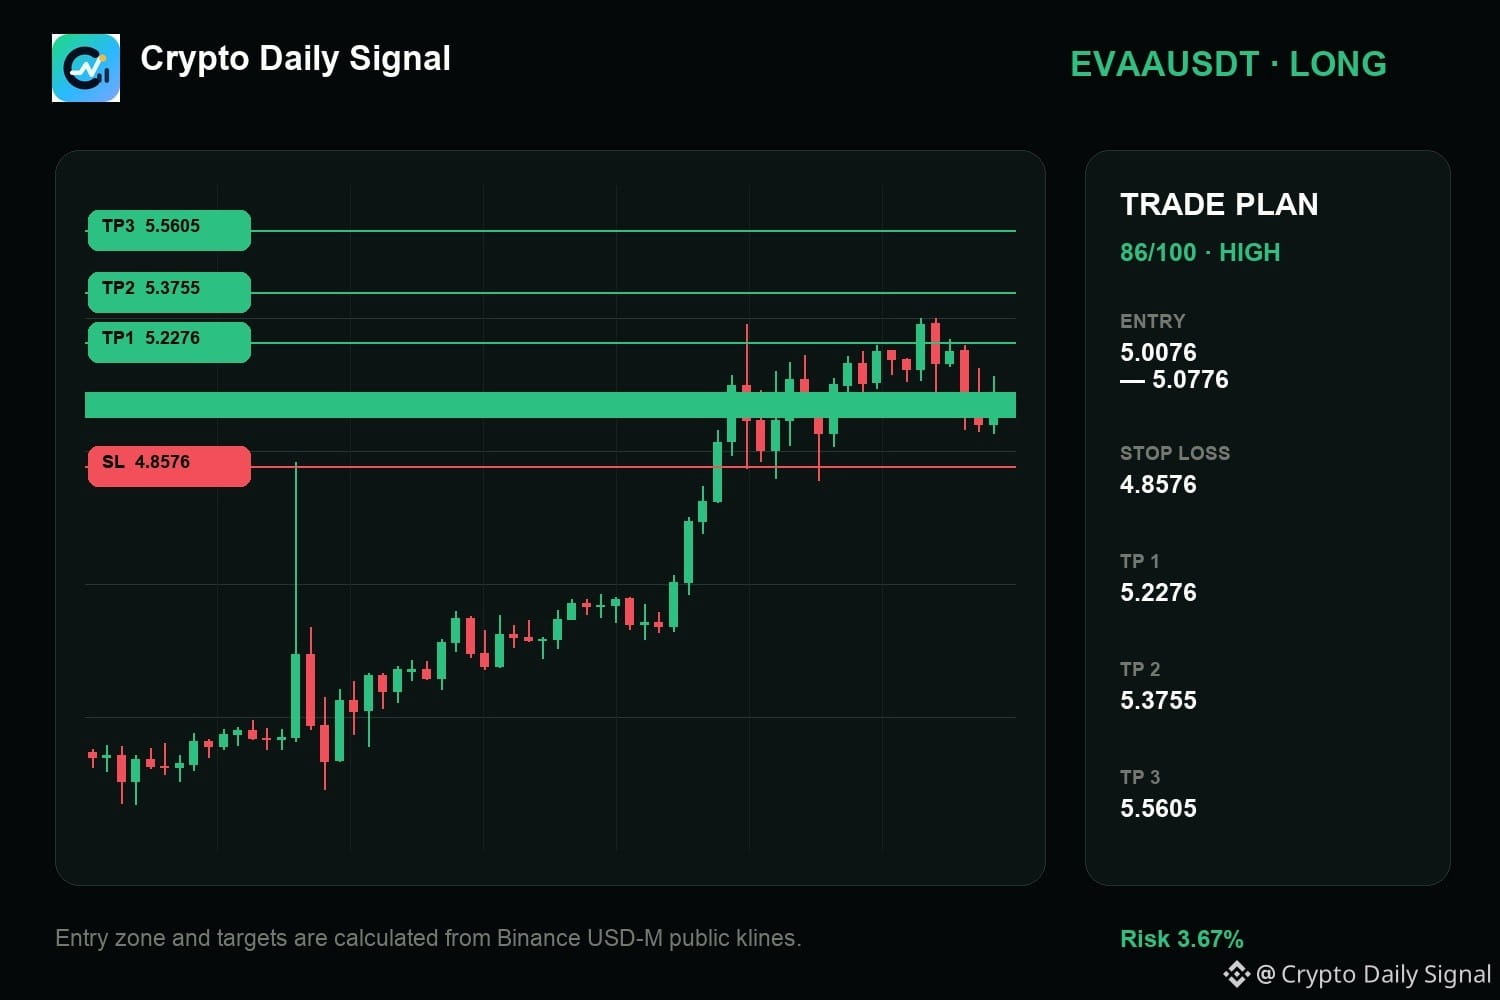
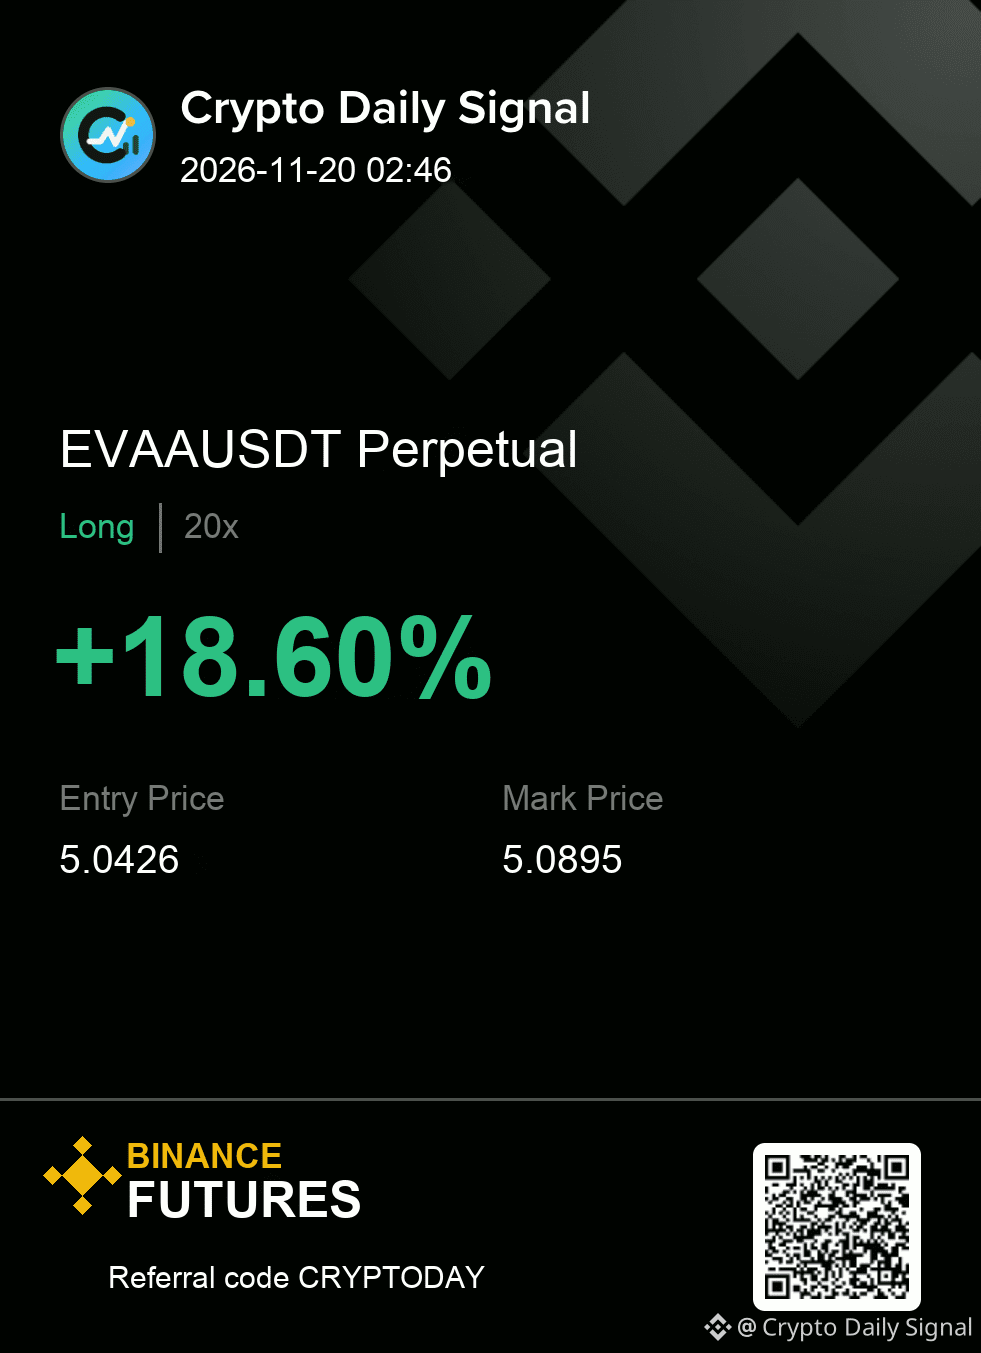
$EVAA — quick take, I still think it keeps the long case alive. The daily read is bullish, with the four-hour view still bullish. I care more about the reaction at the planned zone than the first burst away from it. Break the invalidation and there is nothing left to defend.
I am tracking the reaction inside the entry zone. What would make you pass on it?
EVAAUSDT LONG
IN 5.0076 - 5.0776
OUT 4.8576
TP 5.2276 · 5.3755 · 5.5605
#TradingSignal
{future}(EVAAUSDT)
$EVAA — quick take, I still think it keeps the long case alive. The daily read is bullish, with the four-hour view still bullish. I care more about the reaction at the planned zone than the first burst away from it. Break the invalidation and there is nothing left to defend.
I am tracking the reaction inside the entry zone. What would make you pass on it?
EVAAUSDT LONG
IN 5.0076 - 5.0776
OUT 4.8576
TP 5.2276 · 5.3755 · 5.5605
#TradingSignal
I am tracking the reaction inside the entry zone. What would make you pass on it?
EVAAUSDT LONG
IN 5.0076 - 5.0776
OUT 4.8576
TP 5.2276 · 5.3755 · 5.5605
#TradingSignal
11
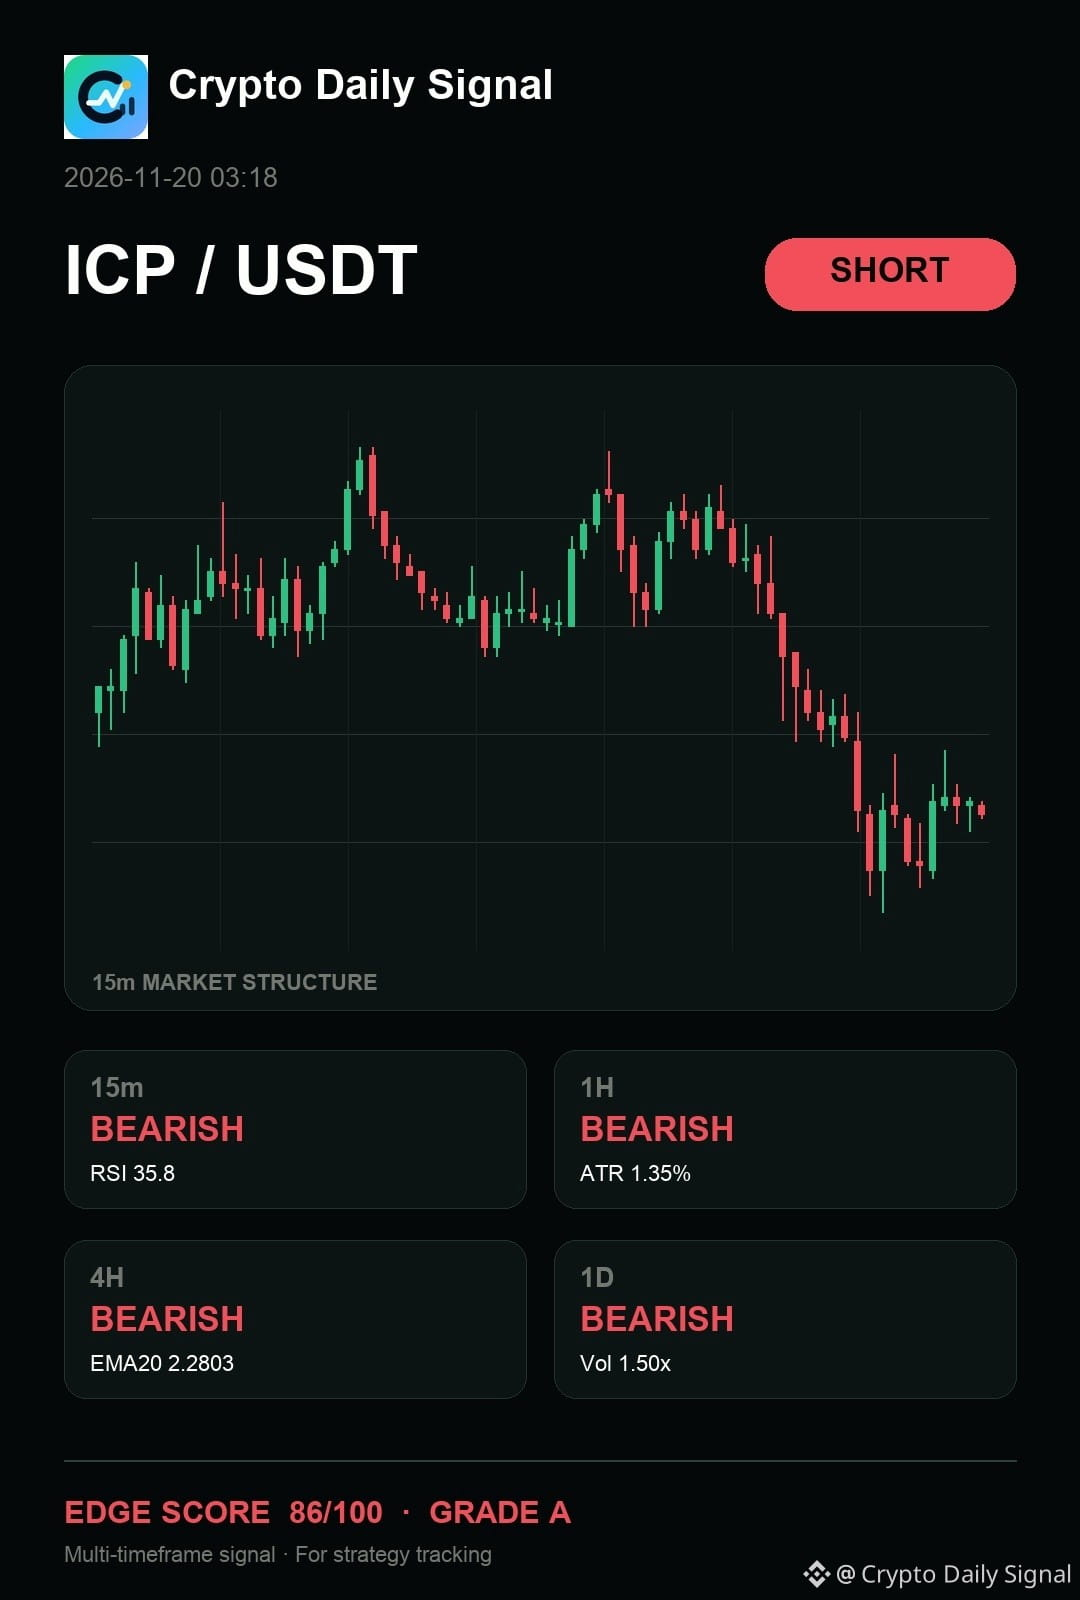
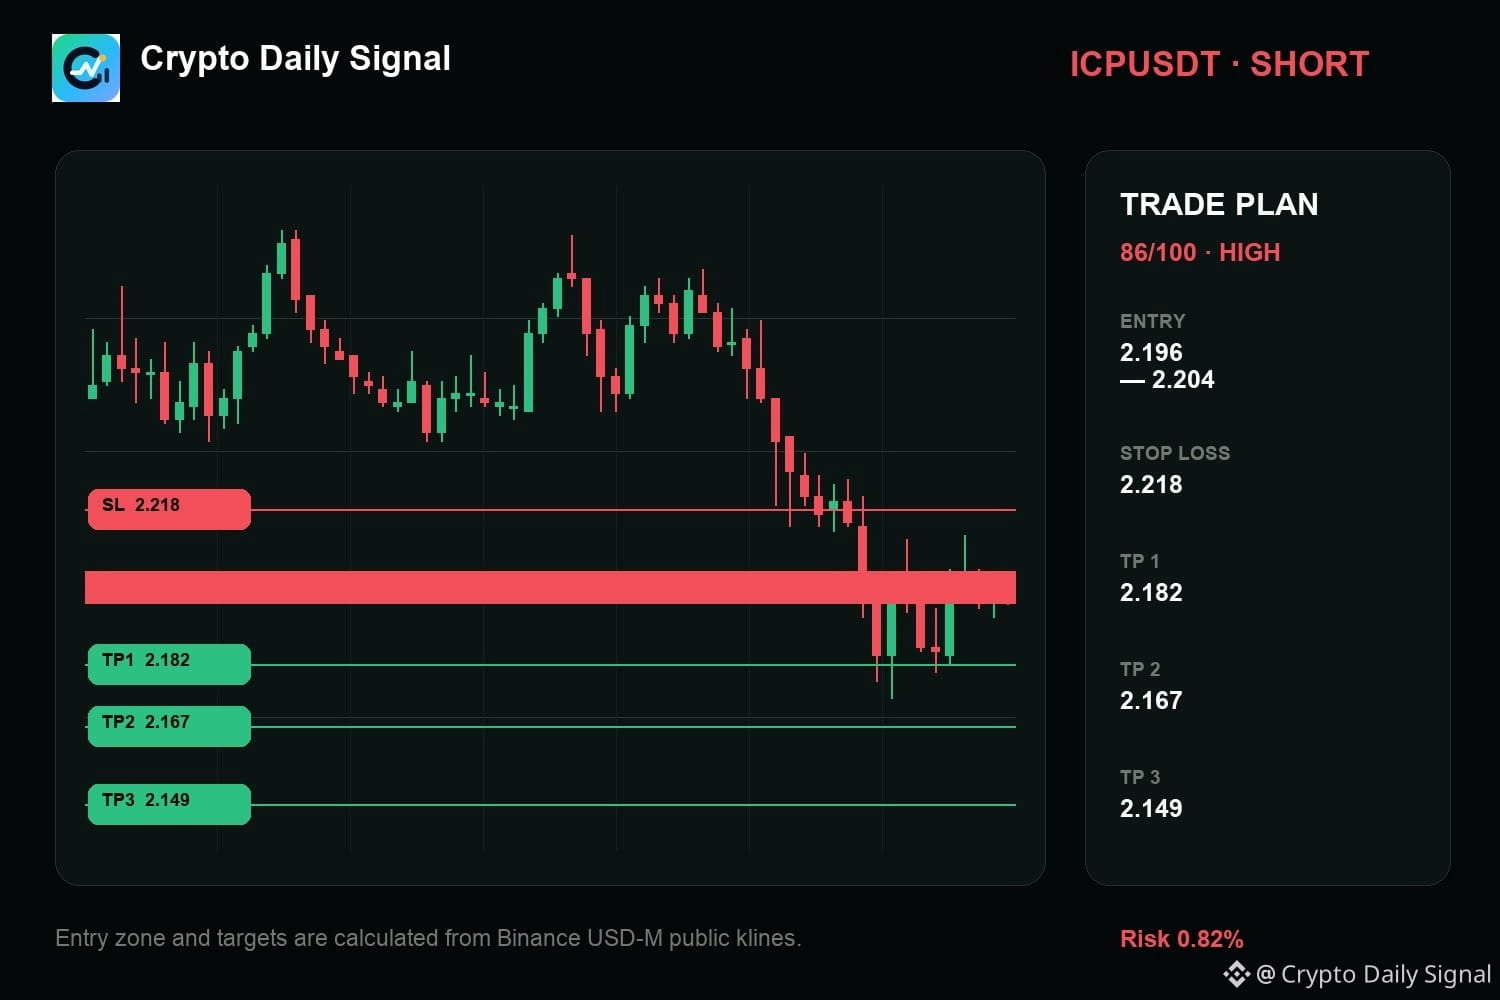
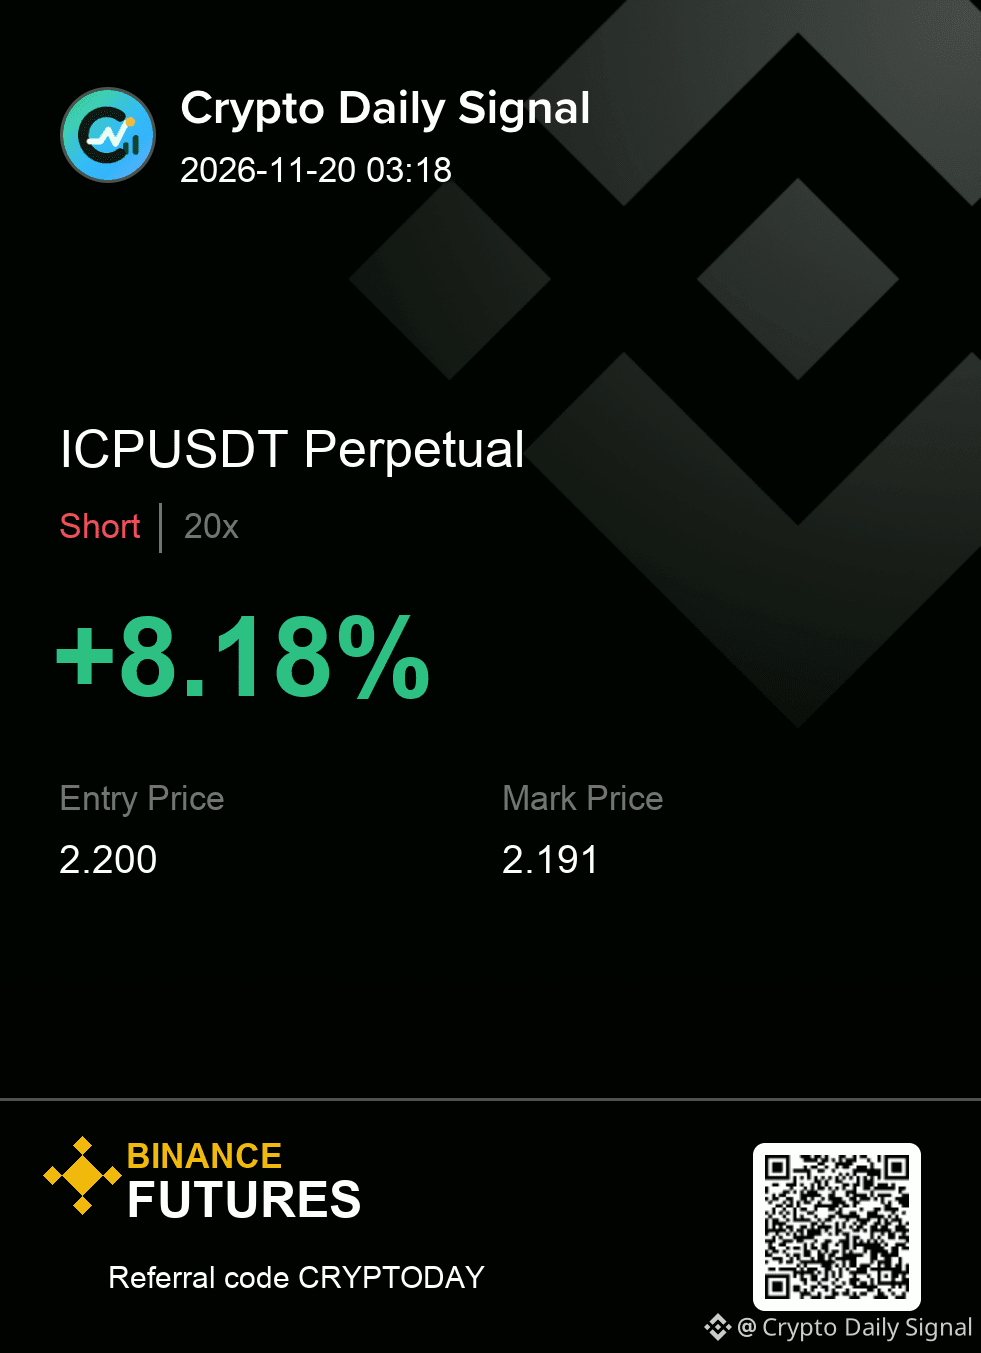
$ICP requires patience before the short is actionable because while the current trading band suggests potential upside could still be found, the developing sequence of lower highs on the shorter timeframe leans bearish. The bearish consensus across the larger timeframes gives the short thesis support, but a strong close above the recent range high would invalidate the setup immediately.
The map is useful only while the invalidation remains intact.
ICPUSDT SHORT map
Entry → 2.196 - 2.204
SL → 2.218
TP → 2.182 · 2.167 · 2.149
#TradingSignal
{future}(ICPUSDT)
$ICP requires patience before the short is actionable because while the current trading band suggests potential upside could still be found, the developing sequence of lower highs on the shorter timeframe leans bearish. The bearish consensus across the larger timeframes gives the short thesis support, but a strong close above the recent range high would invalidate the setup immediately.
The map is useful only while the invalidation remains intact.
ICPUSDT SHORT map
Entry → 2.196 - 2.204
SL → 2.218
TP → 2.182 · 2.167 · 2.149
#TradingSignal
The map is useful only while the invalidation remains intact.
ICPUSDT SHORT map
Entry → 2.196 - 2.204
SL → 2.218
TP → 2.182 · 2.167 · 2.149
#TradingSignal
5
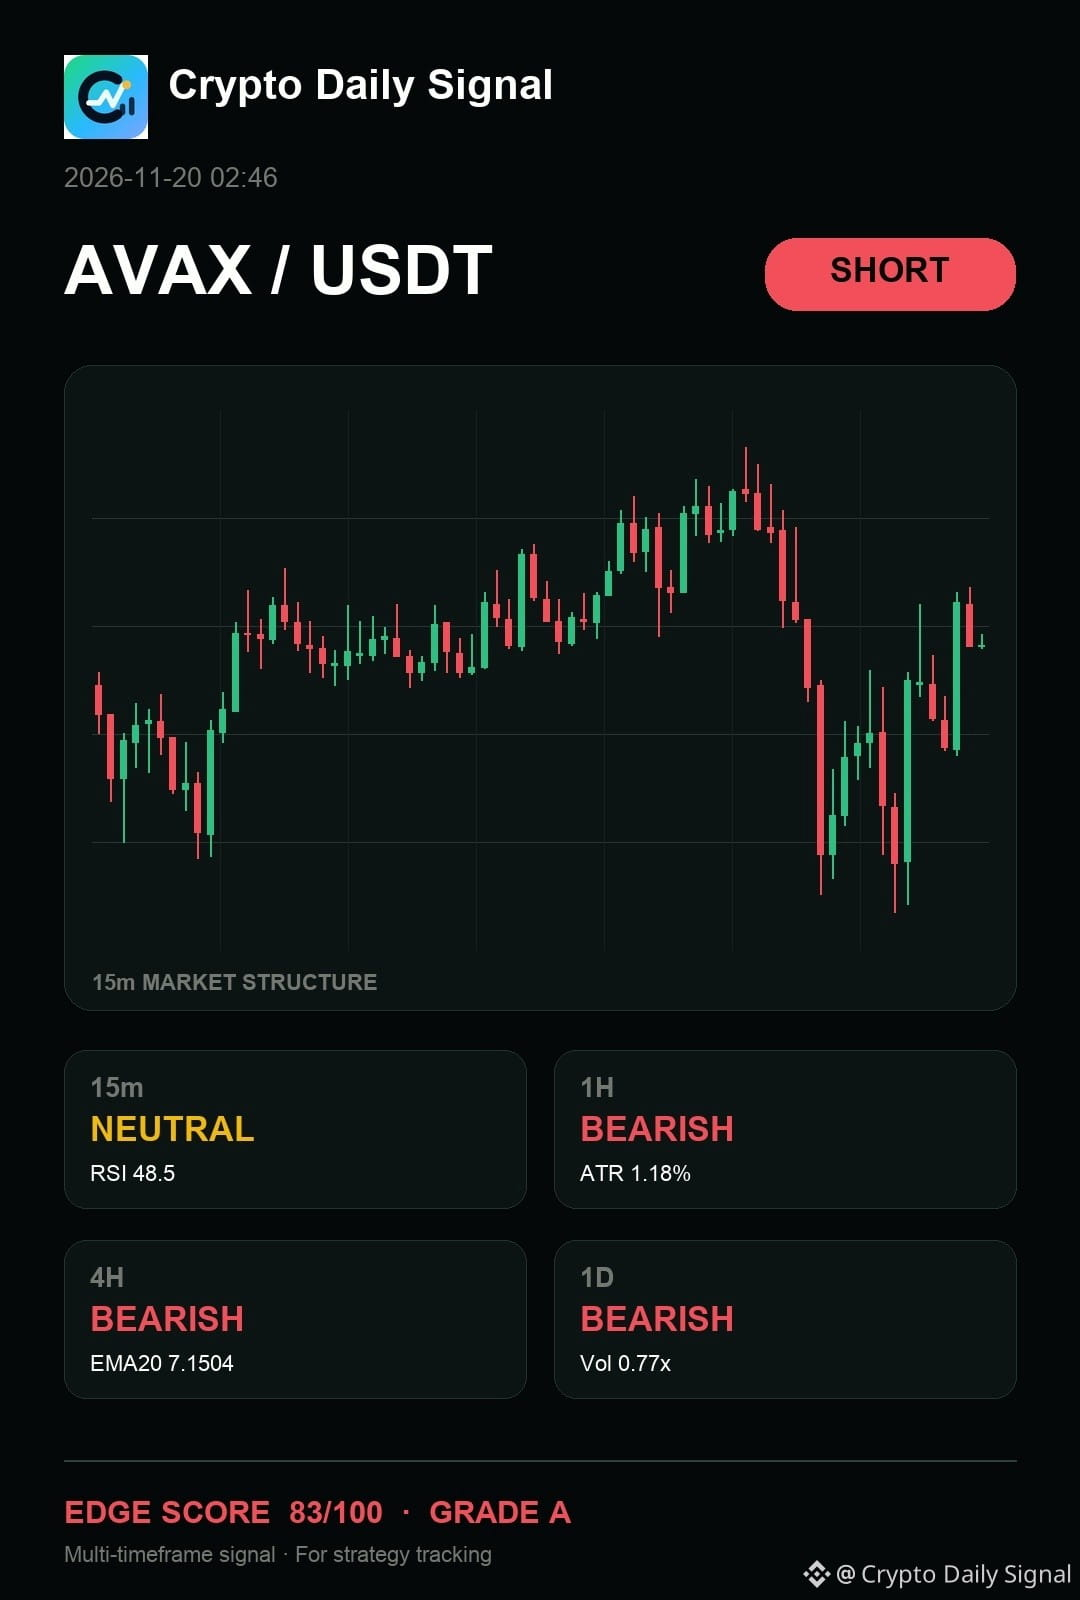
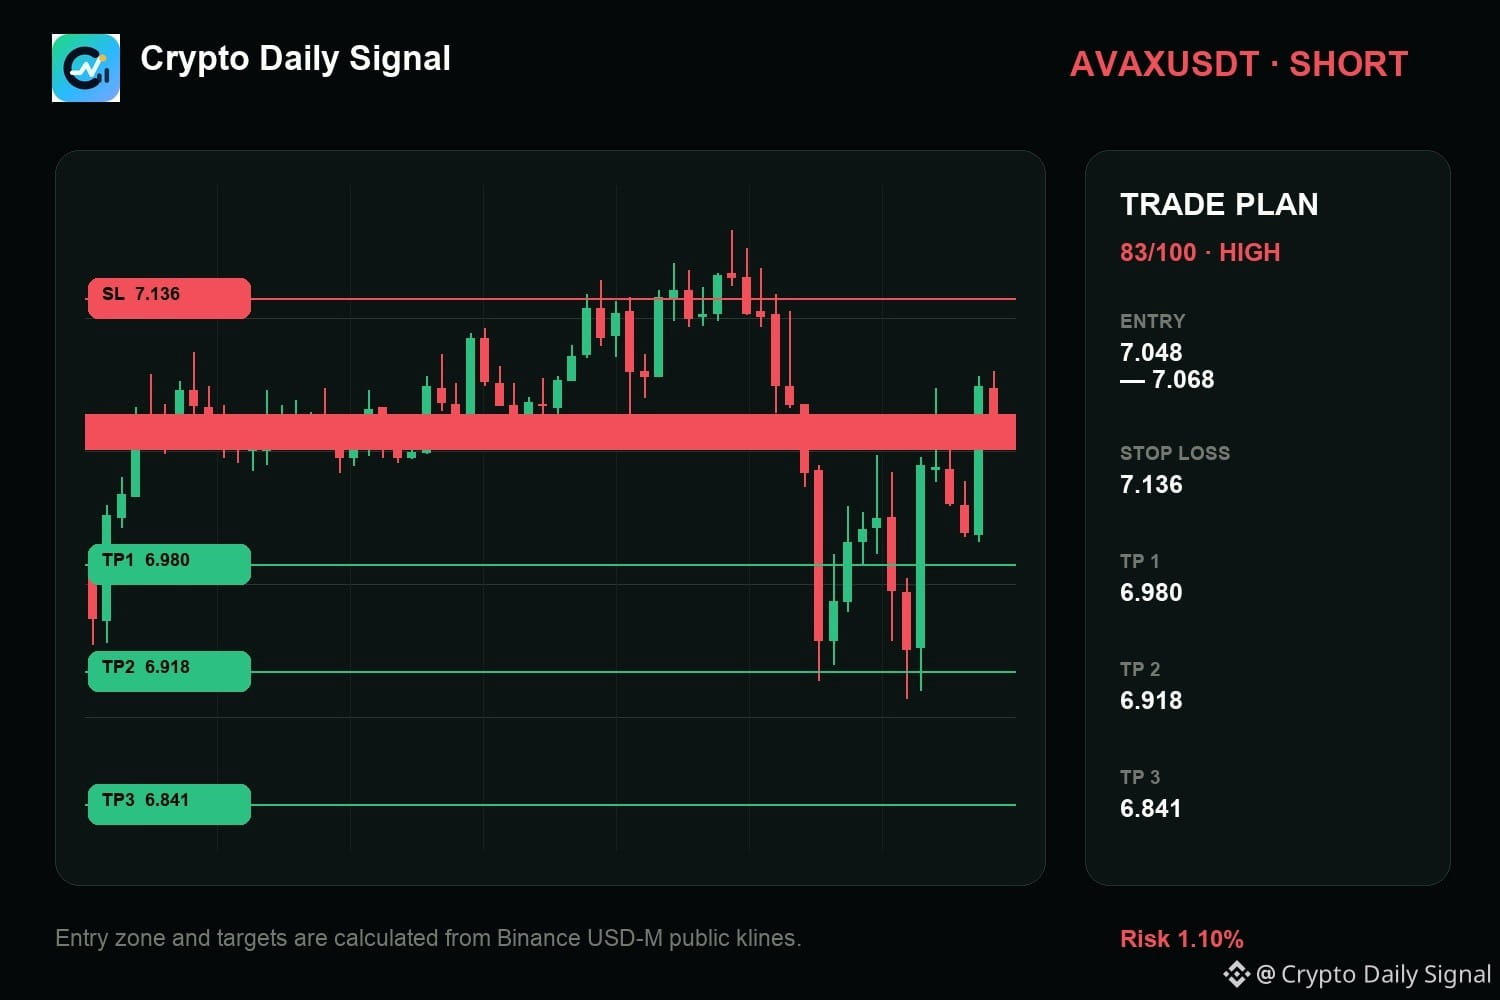
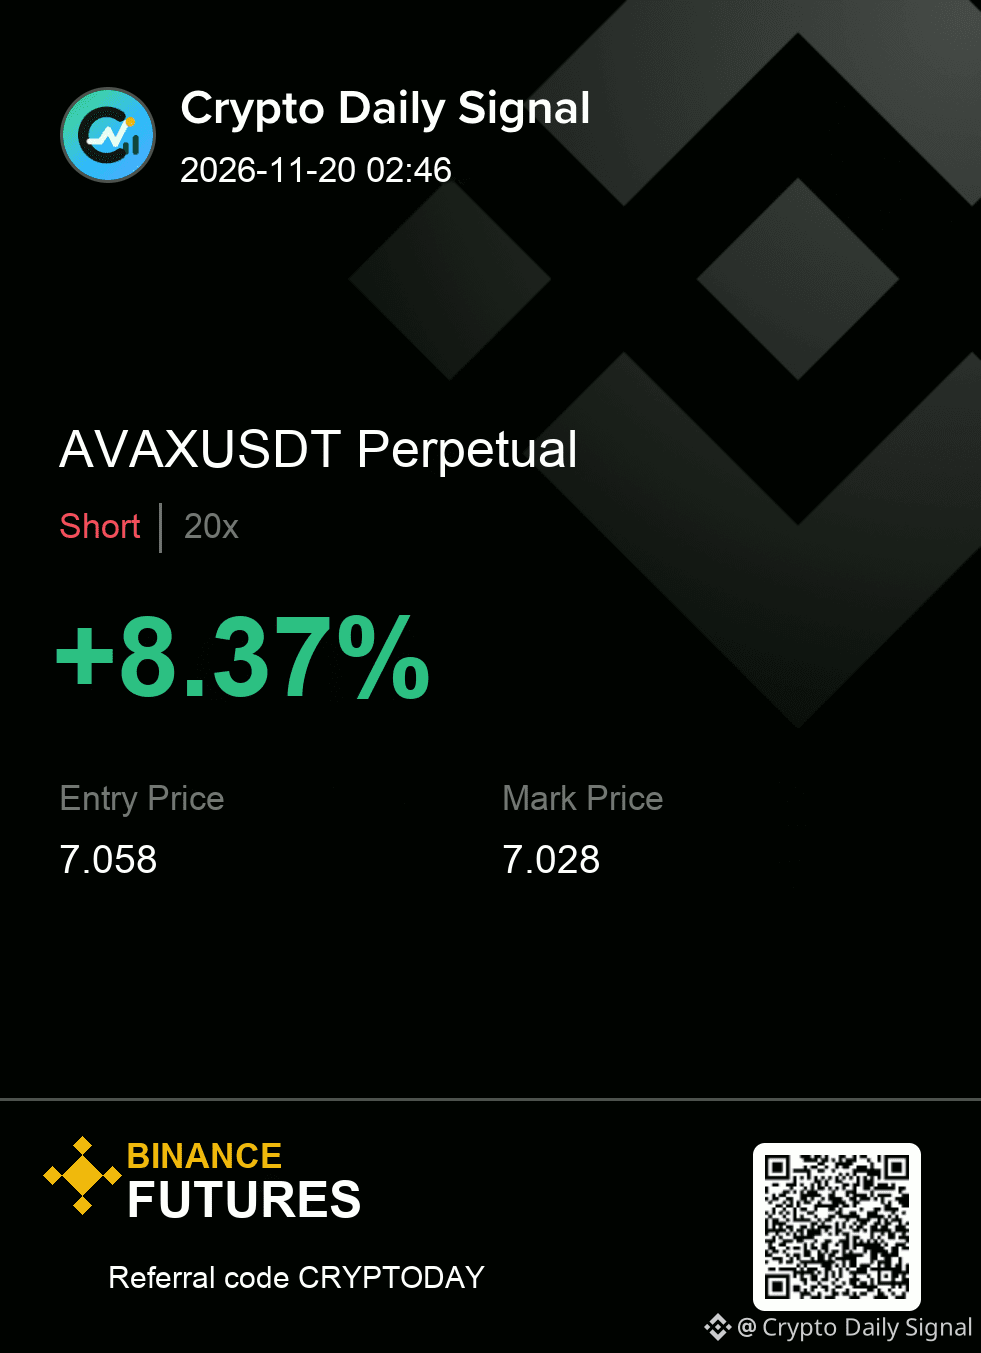
$AVAX — the way I see this move, it sits on my short-side watchlist because the underlying bias remains bearish across the major timeframes. The recent pattern shows lower highs developing while it hovers at the top of a tight recent range. A decisive close below that immediate minor swing low would confirm continuation, but a strong break above that range ceiling would immediately weaken the thesis.
AVAXUSDT SHORT map
Entry → 7.048 - 7.068
SL → 7.136
TP → 6.980 · 6.918 · 6.841
I only want the planned reaction; anything else is a pass.
#TradingSignal
{future}(AVAXUSDT)
$AVAX — the way I see this move, it sits on my short-side watchlist because the underlying bias remains bearish across the major timeframes. The recent pattern shows lower highs developing while it hovers at the top of a tight recent range. A decisive close below that immediate minor swing low would confirm continuation, but a strong break above that range ceiling would immediately weaken the thesis.
AVAXUSDT SHORT map
Entry → 7.048 - 7.068
SL → 7.136
TP → 6.980 · 6.918 · 6.841
I only want the planned reaction; anything else is a pass.
#TradingSignal
AVAXUSDT SHORT map
Entry → 7.048 - 7.068
SL → 7.136
TP → 6.980 · 6.918 · 6.841
I only want the planned reaction; anything else is a pass.
#TradingSignal
4
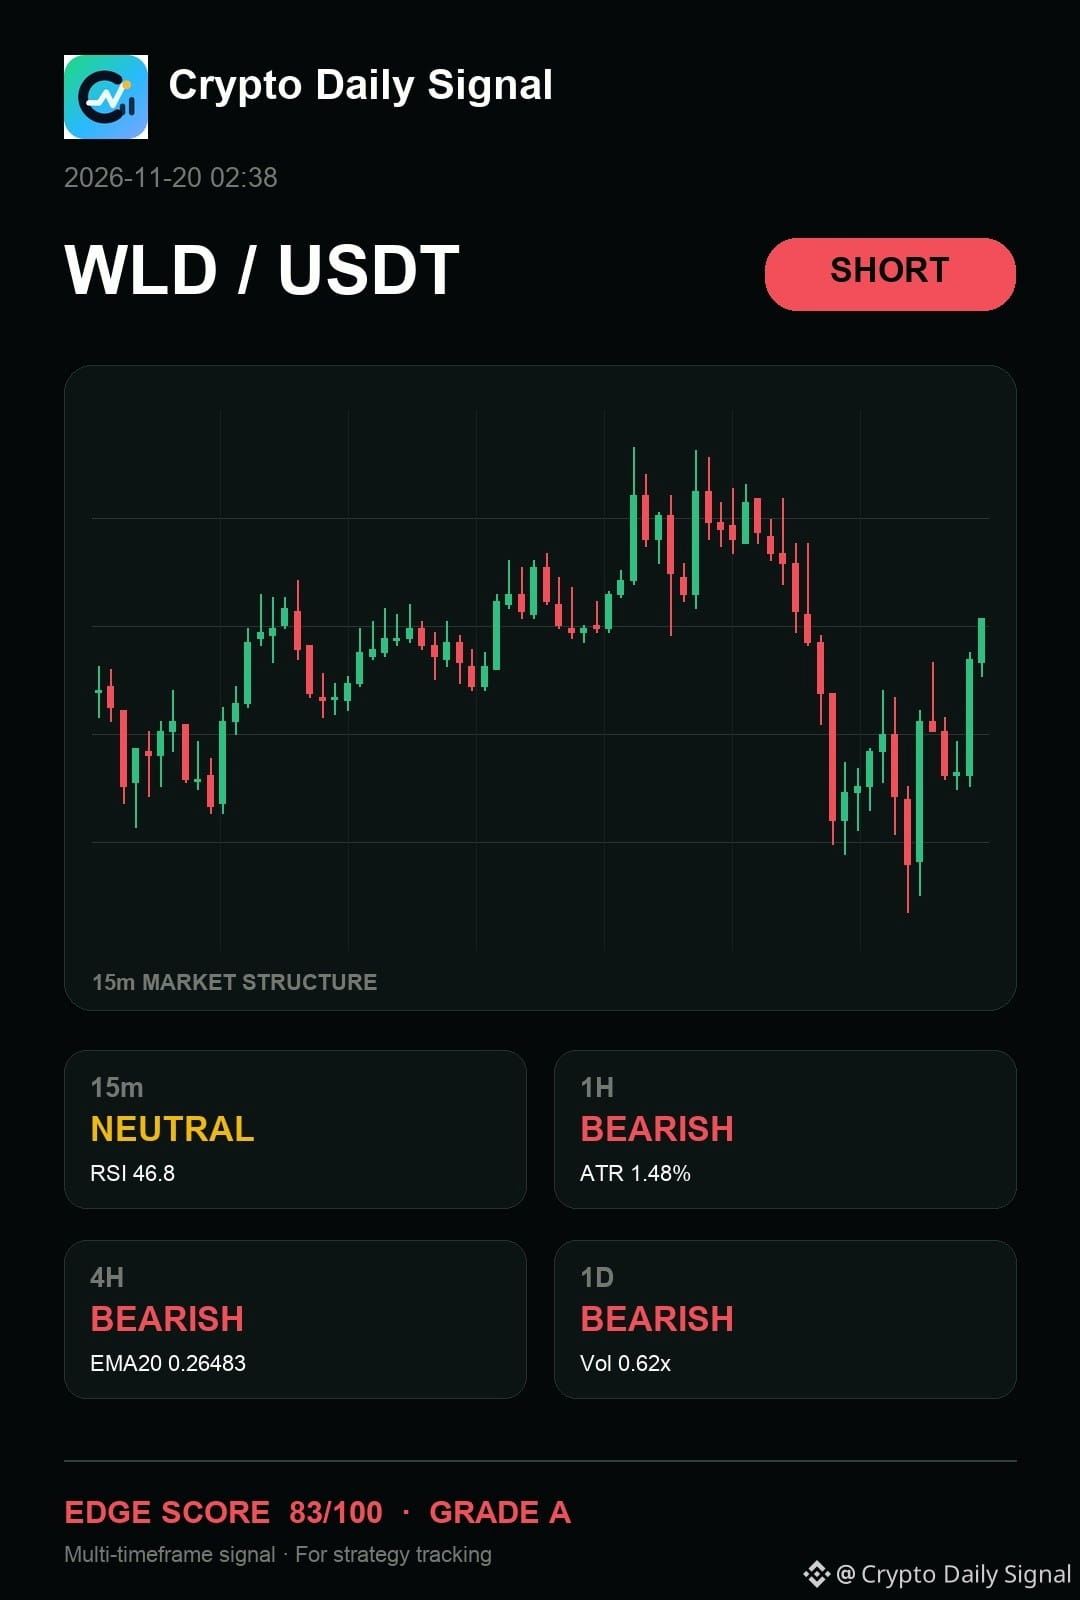
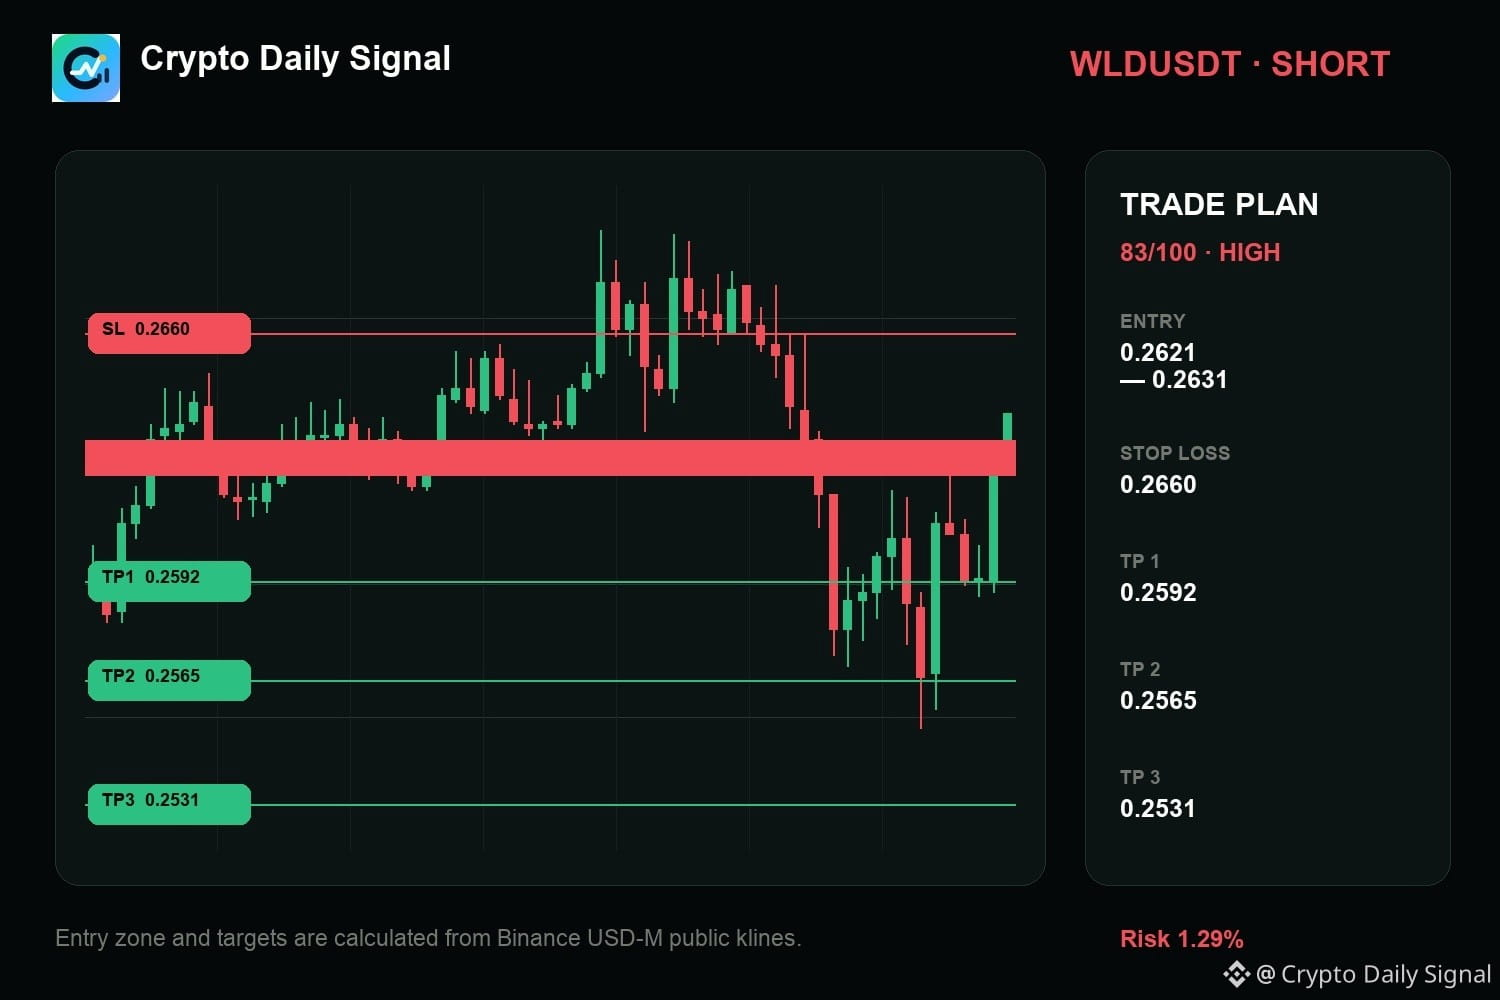
$WLD — my two cents, I am reading it like it keeps the bearish thesis active as it remains tucked inside a tight trading band. The daily and four-hour charts both show down bias, and the newest candle rejected the top boundary. A decisive move under that short-term floor would be the trigger for the downside.
My levels for WLDUSDT — SHORT
Entry zone 0.2621 - 0.2631
Risk line 0.2660
Targets 0.2592 / 0.2565 / 0.2531
The map is useful only while the invalidation remains intact.
#TradingSignal
{future}(WLDUSDT)
$WLD — my two cents, I am reading it like it keeps the bearish thesis active as it remains tucked inside a tight trading band. The daily and four-hour charts both show down bias, and the newest candle rejected the top boundary. A decisive move under that short-term floor would be the trigger for the downside.
My levels for WLDUSDT — SHORT
Entry zone 0.2621 - 0.2631
Risk line 0.2660
Targets 0.2592 / 0.2565 / 0.2531
The map is useful only while the invalidation remains intact.
#TradingSignal
My levels for WLDUSDT — SHORT
Entry zone 0.2621 - 0.2631
Risk line 0.2660
Targets 0.2592 / 0.2565 / 0.2531
The map is useful only while the invalidation remains intact.
#TradingSignal
6
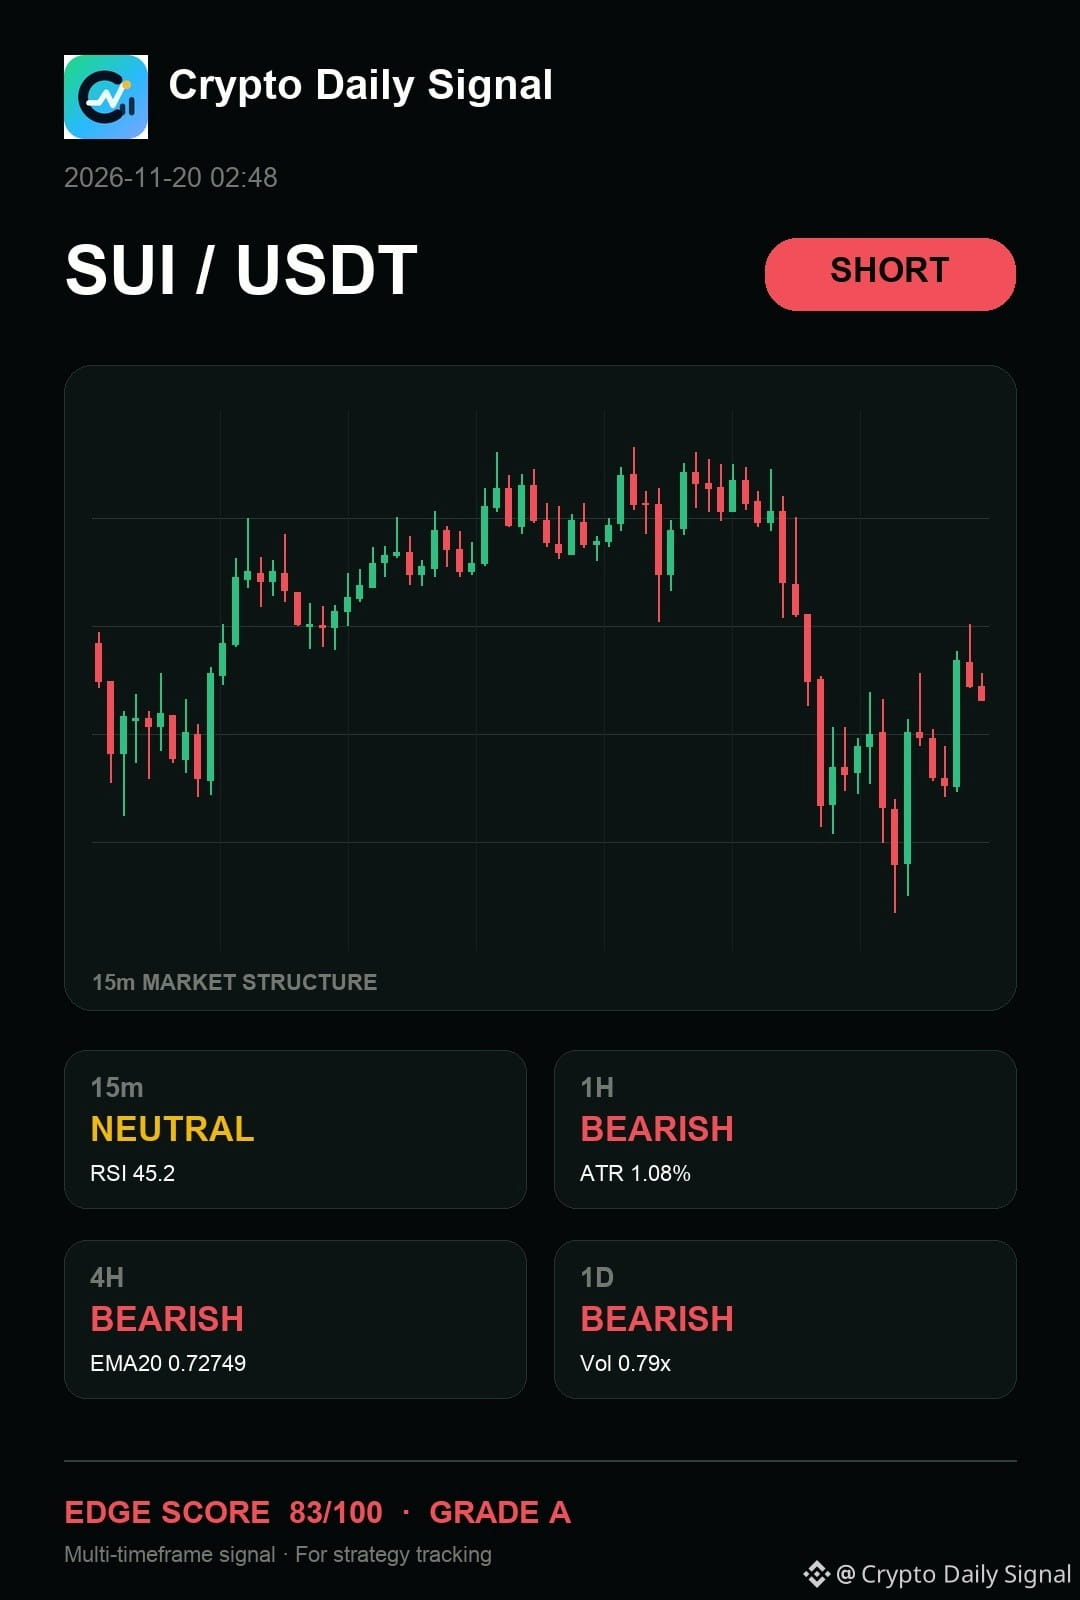
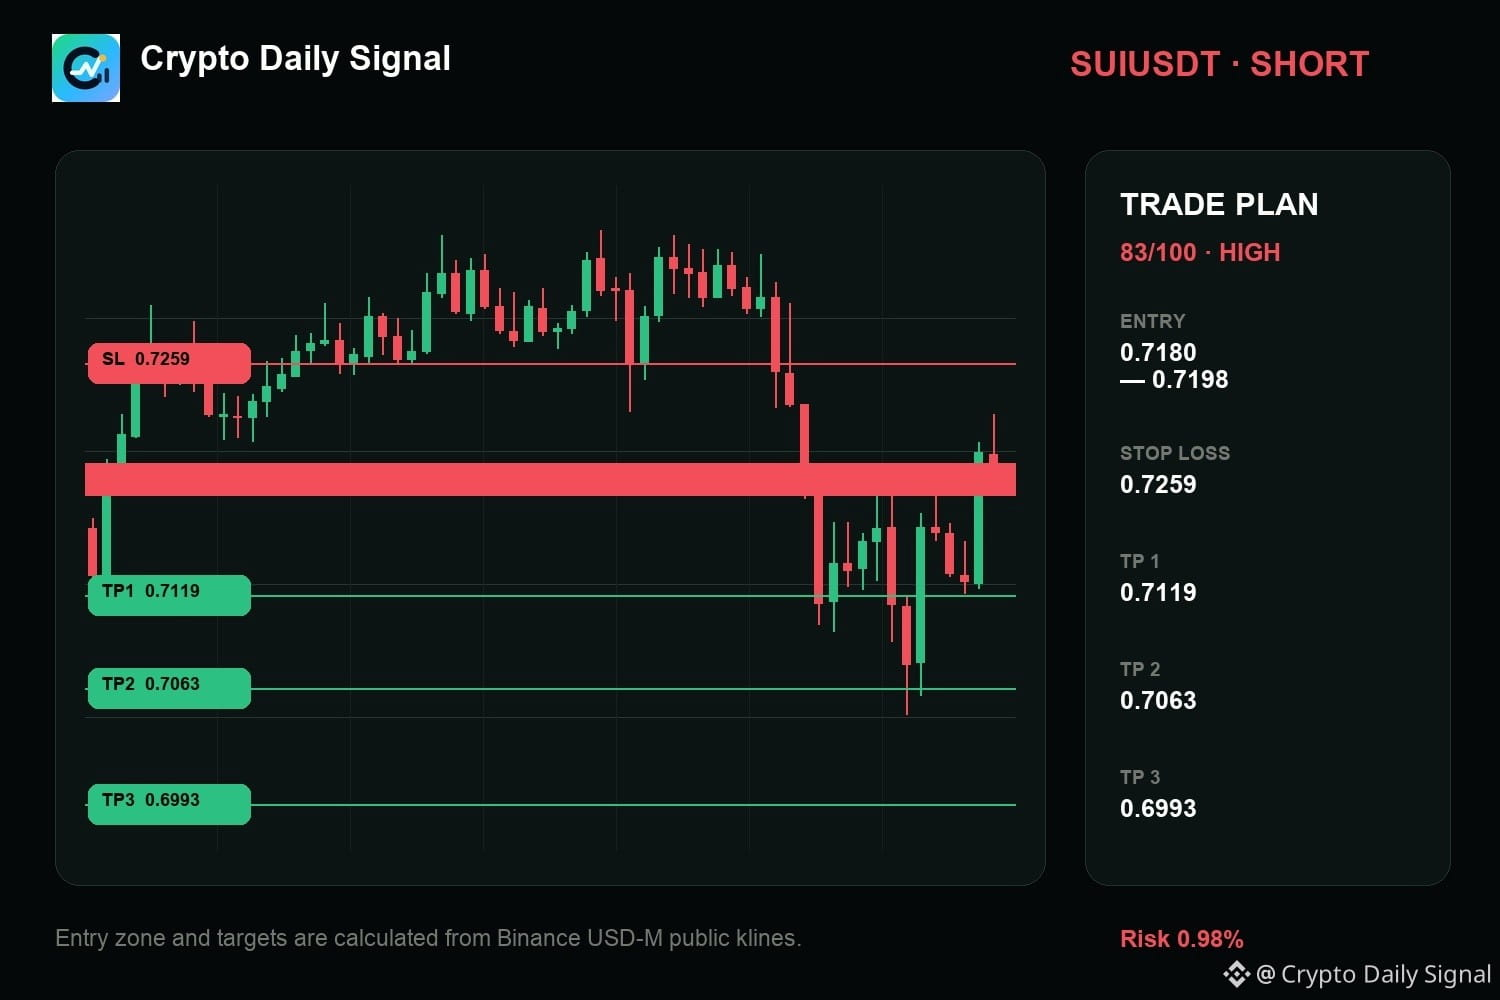
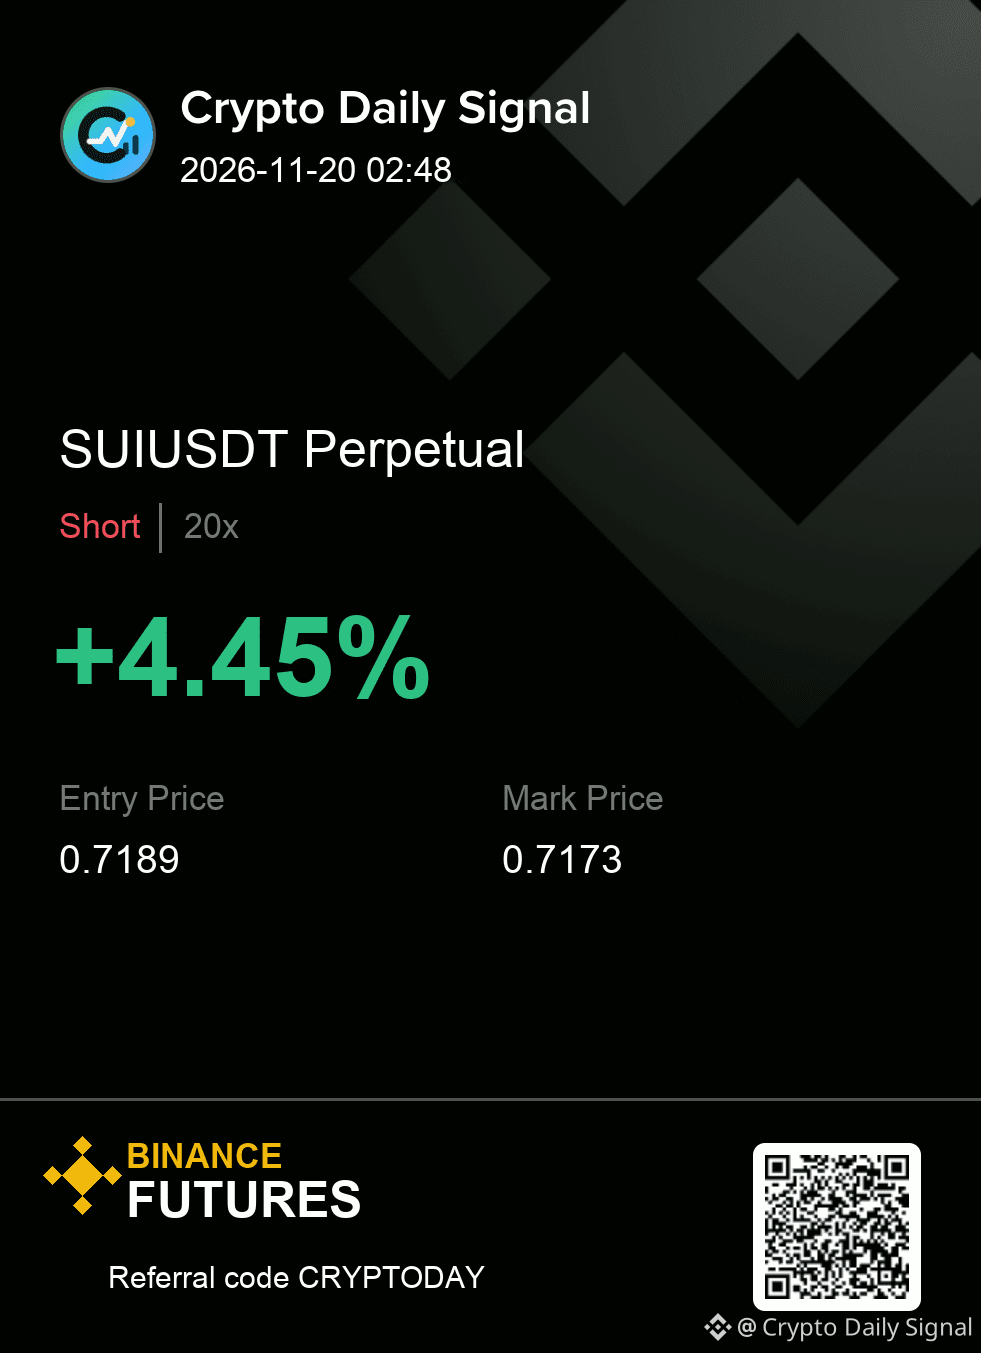
$SUI — right now, I would say it still gives sellers the cleaner argument as price respects the upper line of its recent box. The sequence of candles recently failed to build a higher low, and the trend across the hourly and four-hour views remains downward. A break below the bottom of that box would make the short conviction much stronger.
SHORT plan for SUIUSDT
0.7180 - 0.7198 entry | 0.7259 stop
0.7119 → 0.7063 → 0.6993
#TradingSignal
{future}(SUIUSDT)
$SUI — right now, I would say it still gives sellers the cleaner argument as price respects the upper line of its recent box. The sequence of candles recently failed to build a higher low, and the trend across the hourly and four-hour views remains downward. A break below the bottom of that box would make the short conviction much stronger.
SHORT plan for SUIUSDT
0.7180 - 0.7198 entry | 0.7259 stop
0.7119 → 0.7063 → 0.6993
#TradingSignal
SHORT plan for SUIUSDT
0.7180 - 0.7198 entry | 0.7259 stop
0.7119 → 0.7063 → 0.6993
#TradingSignal
8
Log in to explore more content
Join global crypto users on Binance Square
⚡️ Get latest and useful information about crypto.
💬 Trusted by the world’s largest crypto exchange.
👍 Discover real insights from verified creators.
Email / Phone number
Trending Topics
1
#IsAnthropic’s$1.5TMarketCapJustified?
10,013 views
81 Discussing
2
#BTCRemainsUnderPressureAfterHawkishFOMCMinutes
235,075 views
2,063 Discussing
3
#NvidiaBoardReportedlySplitOverHuang’sReturn
114,315 views
1,111 Discussing
4
#StrategySTRCPreferredSlips3.65%Below$100Par
6,998 views
70 Discussing
5
#MASToUpgradeSGDTestnetToSGDigitalLedger
20,228 views
250 Discussing
6
#CanGTA6'sLaunchLiftTTWOShares?
82,129 views
805 Discussing
7
#Solana2027RoadmapTargetsDoubleComputeCapacity
8,389 views
130 Discussing
8
#InjectiveTokenizedRealEstateMortgagesTop$1.5B
1,114 views
28 Discussing
9
#TetherMakesStrategicInvestmentInSCRYPT
6,134 views
104 Discussing
10
#CapitalGroupAdds1264500StrategyShares
28,793 views
233 Discussing