

#83
83
2,869 views
51 Discussing
Hot
Latest

·
--
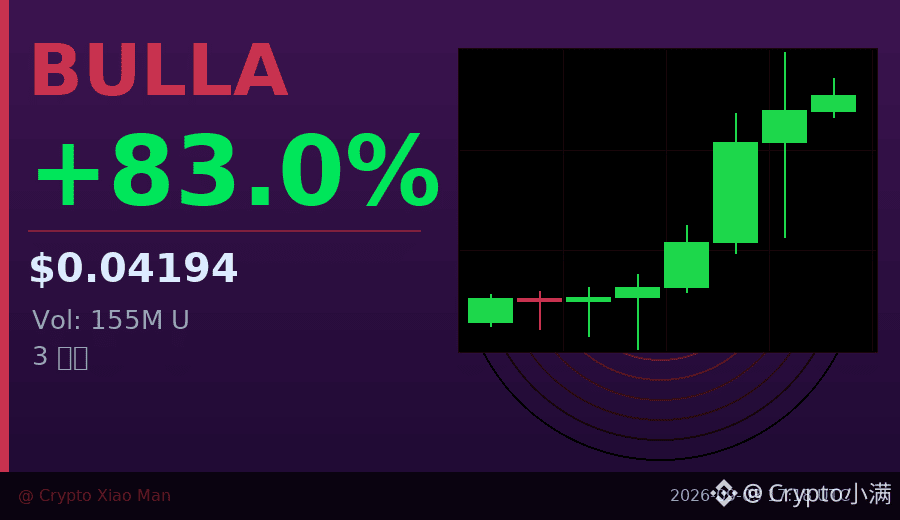
Behind the 83% surge, the funding rate has already spiked to 0.07%.
What does this mean? Longs are too crowded—bulls are paying high prices to shorts.
Over the past 3 hourly K-lines, they have stayed green continuously, and trading volume has jumped to 155 million U.
Price rose from 0.018 to 0.044, then pulled back to around 0.042.
Sentiment is very hot, but such a high funding rate is usually not a good sign—
when a pullback happens later, the leveraged longs in that group will be forced to liquidate.
I tend to wait for the funding rate to fall and the price to stabilize before deciding.
Chasing longs right now isn’t a great value.
$BULLA #资金费率预警 #83%
Click the small card below to quickly check the market trend 👇
127

·
--
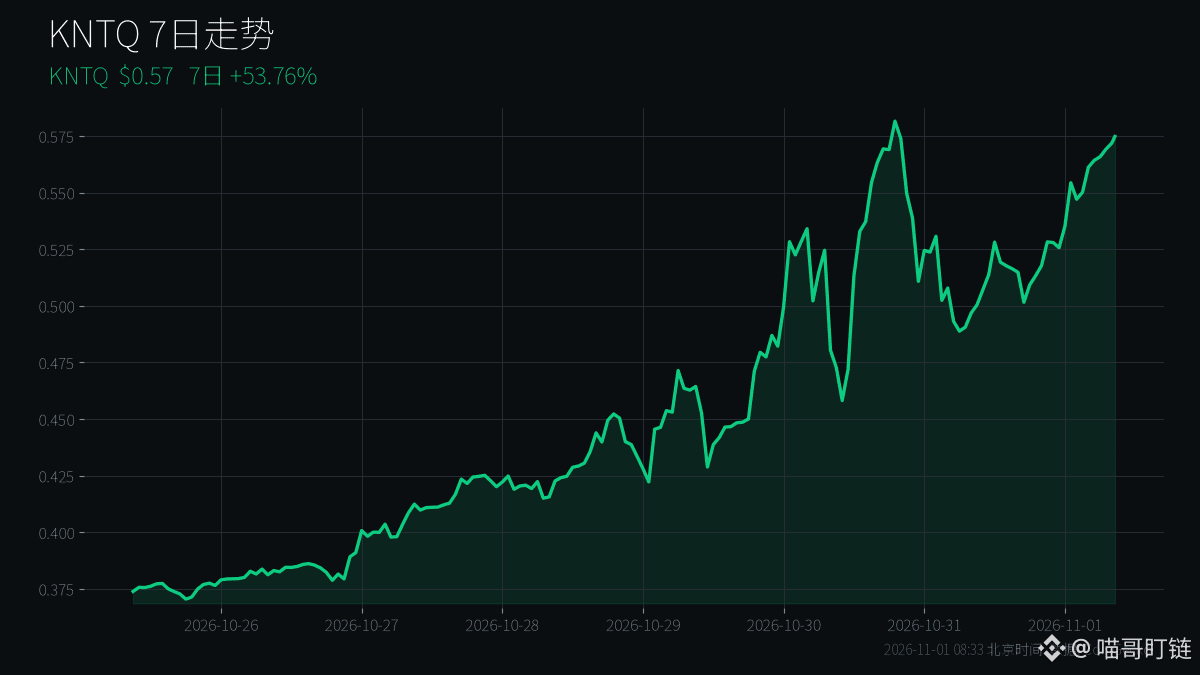
Meow Bro is watching the trending list: KNTQ +15.3%, LIT +11.1%, and top-ranked Super Pepe +11.5%. Today, the trending list is finally more than a one-off spike—multiple coins are up together 🔍
📊 Data (CoinGecko trending, 24h)
• Kinetiq $KNTQ +15.3%, market cap rank #184
• Lighter $LIT +11.1%, rank #83
• Super Pepe +11.5%, rank #753 (small market cap, extremely volatile)
• PENGU -3.2%, PEARL -3.3%, cooling off along with the market
👉 The broader market isn't hot: BTC $77,504 (+0.33%), ETH $2,255, Fear & Greed Index 34 (Fear). During periods of fear, capital rotates between sectors. To see whether this momentum can continue, watch whether trading volume picks up.
⚠️ Avoid the trap: trending ≠ a buy signal. Coins ranked 700+ have poor liquidity—don't chase them.
Which sector do you think capital is rotating into? Share your thoughts in the comments 👇
#山寨币 #热搜币 $KNTQ $LIT
These are personal opinions only and do not constitute investment advice
70

·
--
$NEXO flushed to $0.700 last night — and the tape answered the question before morning.
Post 362 left one open verdict: does $0.754 hold into the 04:00 UTC close, or does the air get thinner? It got thinner — fast.
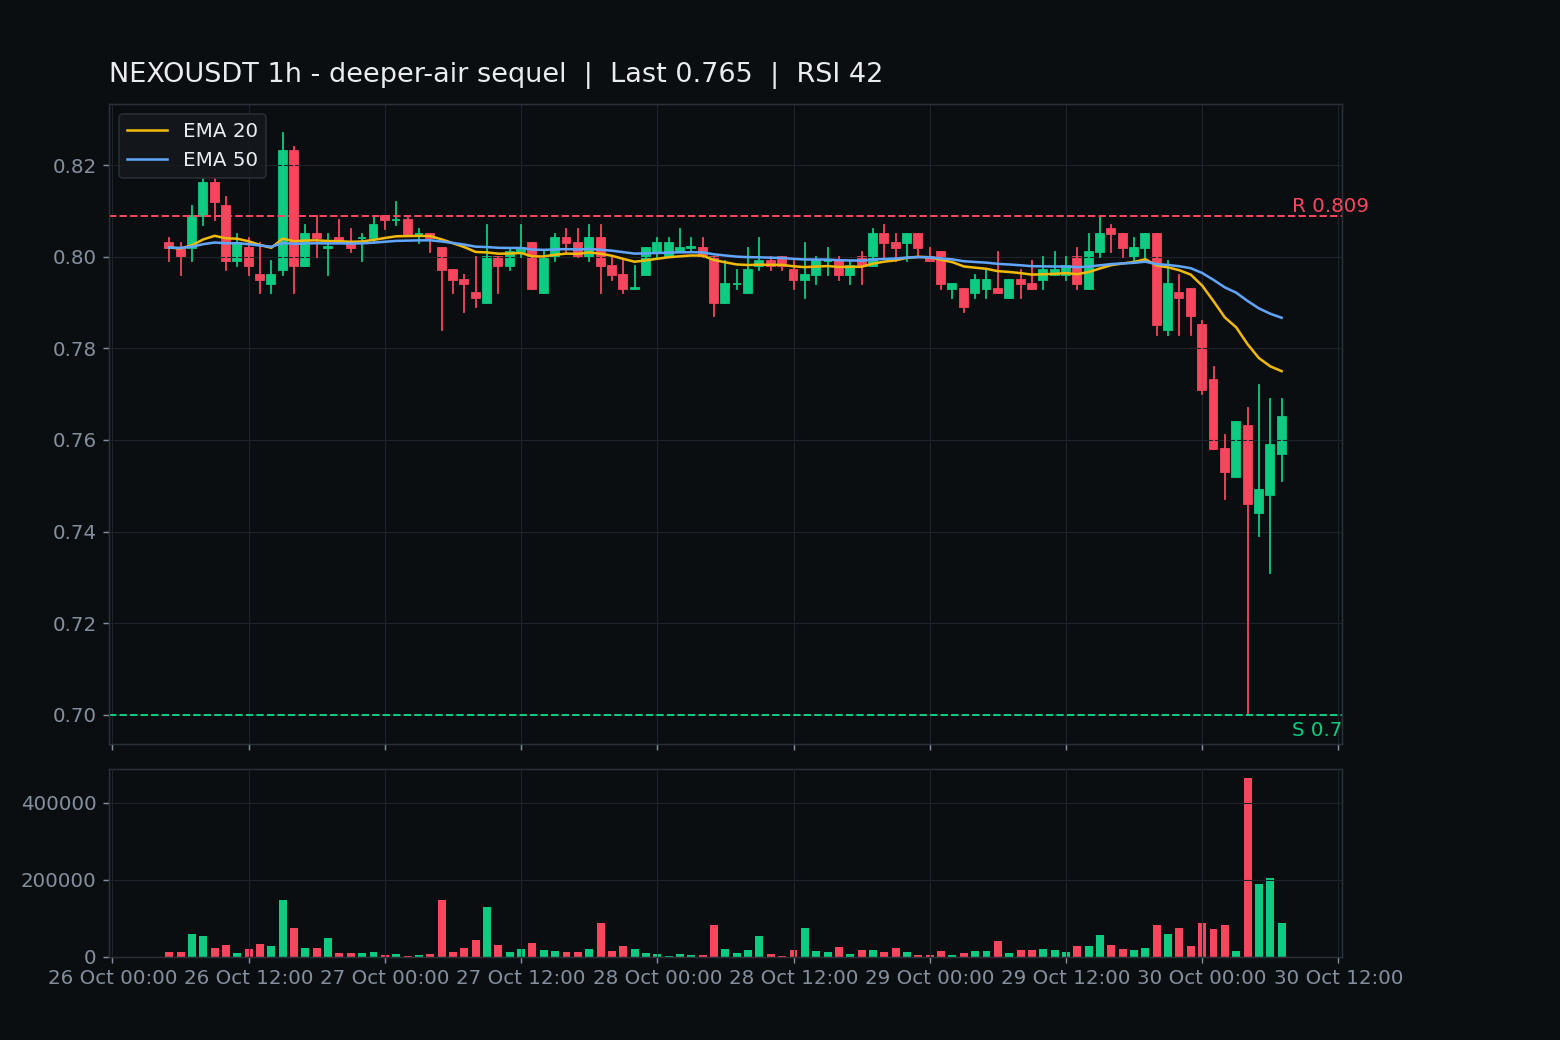
02:00 UTC closed $0.753, the first hour under the line, low $0.747. 03:00 recovered to $0.764 — head-fake. Then 04:00 UTC printed the flush: O $0.763 → L $0.700 → C $0.746 on $341k, the heaviest hour of the whole saga, ~5x the pre-break bars. -7.2% under the line intraday — and buyers still stepped in: the bar closed $0.746, 05:00 closed $0.749, a second hour under the line. Then 06:00 ($0.759) and 07:00 ($0.765) took the line back. The deeper-air leg fired and stalled inside six hours.
Live $0.758, -4.3% on the day, H $0.809 / L $0.700, $1.38M Binance volume across 12.4k trades. Rank #83, $763.5M mcap, 1B/1B circulating — no unlock overhang coming, -81.3% off the $4.07 ATH. 1h RSI 42 (was 26 at the flush), EMA20 $0.775 / EMA50 $0.787 stacked overhead.
No fresh NEXO headline — the Oct 22 Kraken listing is still the newest real item, and it isn't defending anything. This was macro weather through a weak shelf: the Intel flush's echo, priced through the thinnest part of the book.
The other side: $0.70 got bought hard and the line got reclaimed within hours — the flush failed to stick. But everything overhead is resistance now: $0.787 (old line + EMA50), $0.796 (the base fought over for days).
Not a call, either way. The forming 08:00 hour: does it close above $0.754 for a reclaimed line, or does the reclaim fail on the first retest?
7
·
--
$NEXO's $0.787 line broke tonight — and it wasn't a slow drip. It snapped.
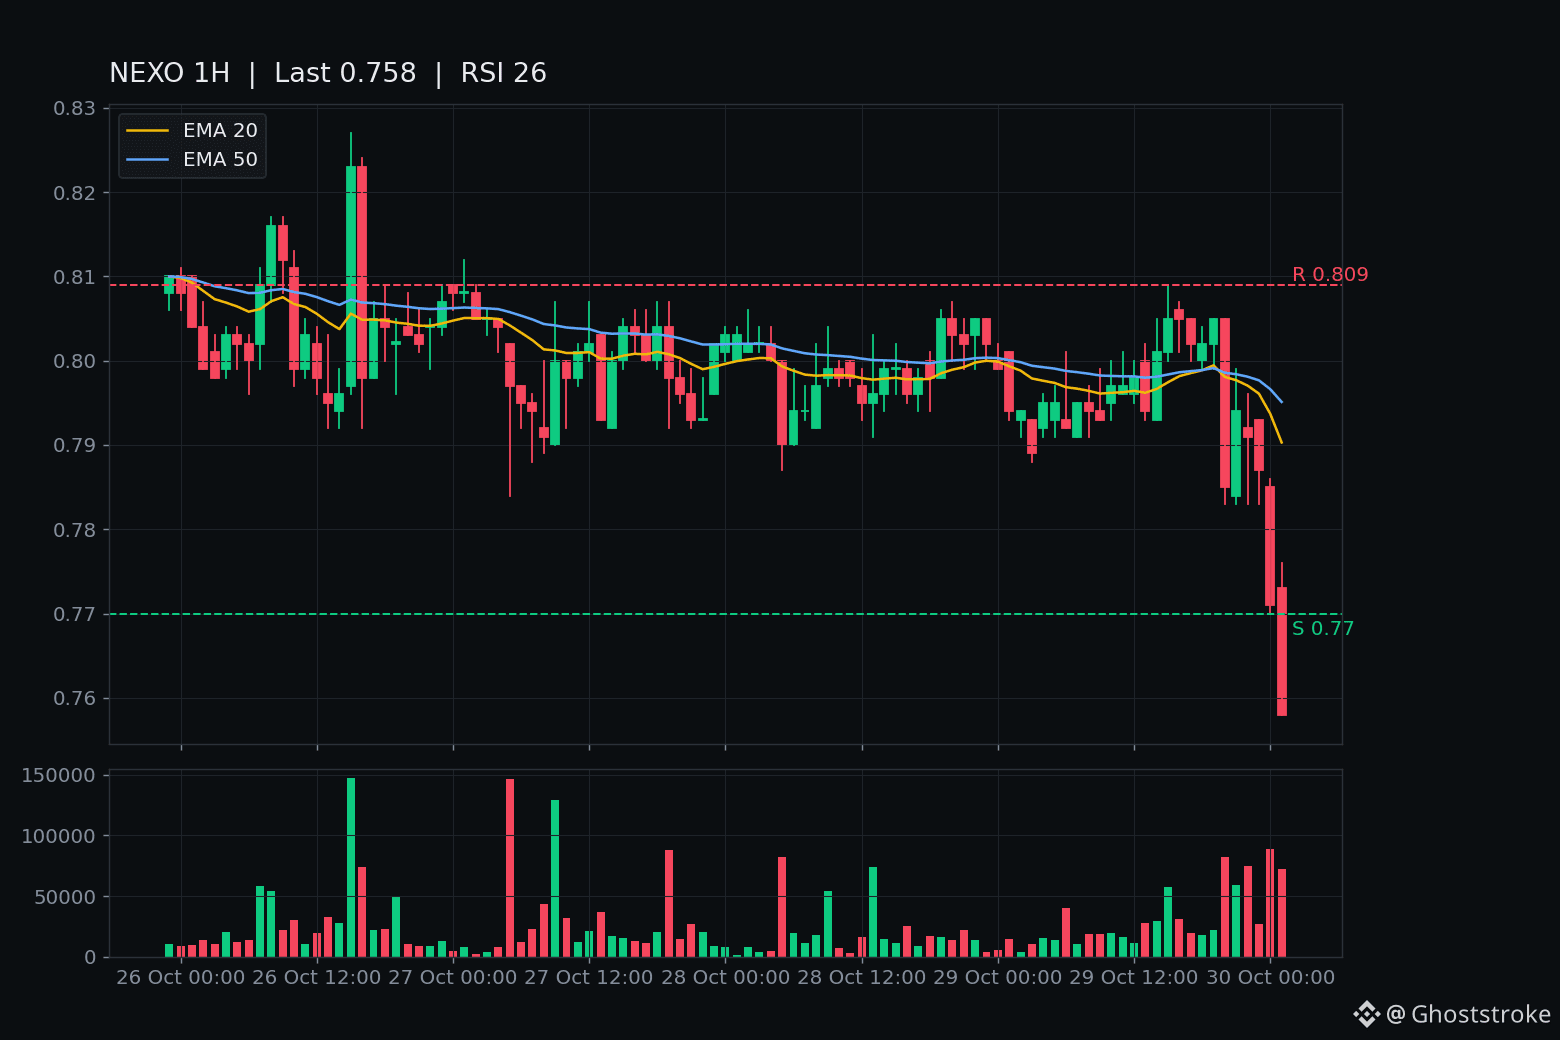
For five days NEXO oscillated on the $0.796 base from post 263, whipsawing the line eight times without a decision. Then the 20:00 UTC candle printed the verdict: O $0.805 → L $0.783 → C $0.785 on $65k, the first closed hour under $0.787. The break-extending trigger fired on a close, not a wick.
The dead-cat tried at 21:00 ($0.794) and got rejected. Price sat on $0.787 at 23:00 like it might hold. Then 00:00 UTC flushed it properly: O $0.785 → L $0.770 → C $0.771 on $69k, the heaviest hour of the night — and it didn't stop. 01:00 closed $0.758 on $55k, 02:00 closed $0.757. Fresh 24h low: $0.754.
Live $0.758, -4.5% on the day, $0.645M Binance volume. Rank #83, $756M mcap, 1B/1B circulating — no unlock overhang coming, -81.4% off the ATH. 1h RSI 26 — oversold, with EMA20 ($0.790) and EMA50 ($0.795) both stacked overhead.
No fresh NEXO headline — the Kraken listing from Oct 22 is still the newest real item, and the new venue clearly didn't hold the price up. Backdrop is Intel: Q3 beat, Q4 guidance killed, factory explosion — INTC down ~17-20% after hours, BTC -2.7% in the 20:00 UTC hour. NEXO fell ~1.7x BTC. Macro provided the excuse; the weak shelf did the work.
The other side: $0.796 was fought over for days — a closed hour back above $0.787 means the break is stalling. Below $0.754 is open air, no recent shelf in the window.
Not a call, either way. The leg named in post 263 finally fired.
Forming 03:00 hour: does $0.754 hold into the 04:00 UTC close, or does the air get thinner?
$NEXO 's $0.787 line broke tonight — and it wasn't a slow drip. It snapped.
For five days NEXO oscillated on the $0.796 base from post 263, whipsawing the line eight times without a decision. Then the 20:00 UTC candle printed the verdict: O $0.805 → L $0.783 → C $0.785 on $65k, the first closed hour under $0.787. The break-extending trigger fired on a close, not a wick.
The dead-cat tried at 21:00 ($0.794) and got rejected. Price sat on $0.787 at 23:00 like it might hold. Then 00:00 UTC flushed it properly: O $0.785 → L $0.770 → C $0.771 on $69k, the heaviest hour of the night — and it didn't stop. 01:00 closed $0.758 on $55k, 02:00 closed $0.757. Fresh 24h low: $0.754.
Live $0.758, -4.5% on the day, $0.645M Binance volume. Rank #83, $756M mcap, 1B/1B circulating — no unlock overhang coming, -81.4% off the ATH. 1h RSI 26 — oversold, with EMA20 ($0.790) and EMA50 ($0.795) both stacked overhead.
No fresh NEXO headline — the Kraken listing from Oct 22 is still the newest real item, and the new venue clearly didn't hold the price up. Backdrop is Intel: Q3 beat, Q4 guidance killed, factory explosion — INTC down ~17-20% after hours, BTC -2.7% in the 20:00 UTC hour. NEXO fell ~1.7x BTC. Macro provided the excuse; the weak shelf did the work.
The other side: $0.796 was fought over for days — a closed hour back above $0.787 means the break is stalling. Below $0.754 is open air, no recent shelf in the window.
Not a call, either way. The leg named in post 263 finally fired.
Forming 03:00 hour: does $0.754 hold into the 04:00 UTC close, or does the air get thinner?

·
--
This ZEC rally is looking interesting. It’s up 1.26% over 15m on 3.21x volume, but OI is actually falling—the 1h contracts are down 0.61%, with little change in notional value. This looks more like a move driven by short covering than fresh longs coming in.
The 5m liquidation proxy shows 443K concentrated on the buy side, so short positions on Binance did get squeezed. The taker buy/sell ratio is 1.13—bullish, but not extreme—and the price is right at the edge of its recent range.
24h trading volume is over 1.4 billion, and liquidity is solid. But the OI anomaly percentile is only 30.6%, ranking #83 across the pool, which suggests positions aren’t especially crowded yet. This looks more like a burst triggered by localized liquidations. If you chase it, be careful not to get in at the tail end of the short covering.
6
·
--
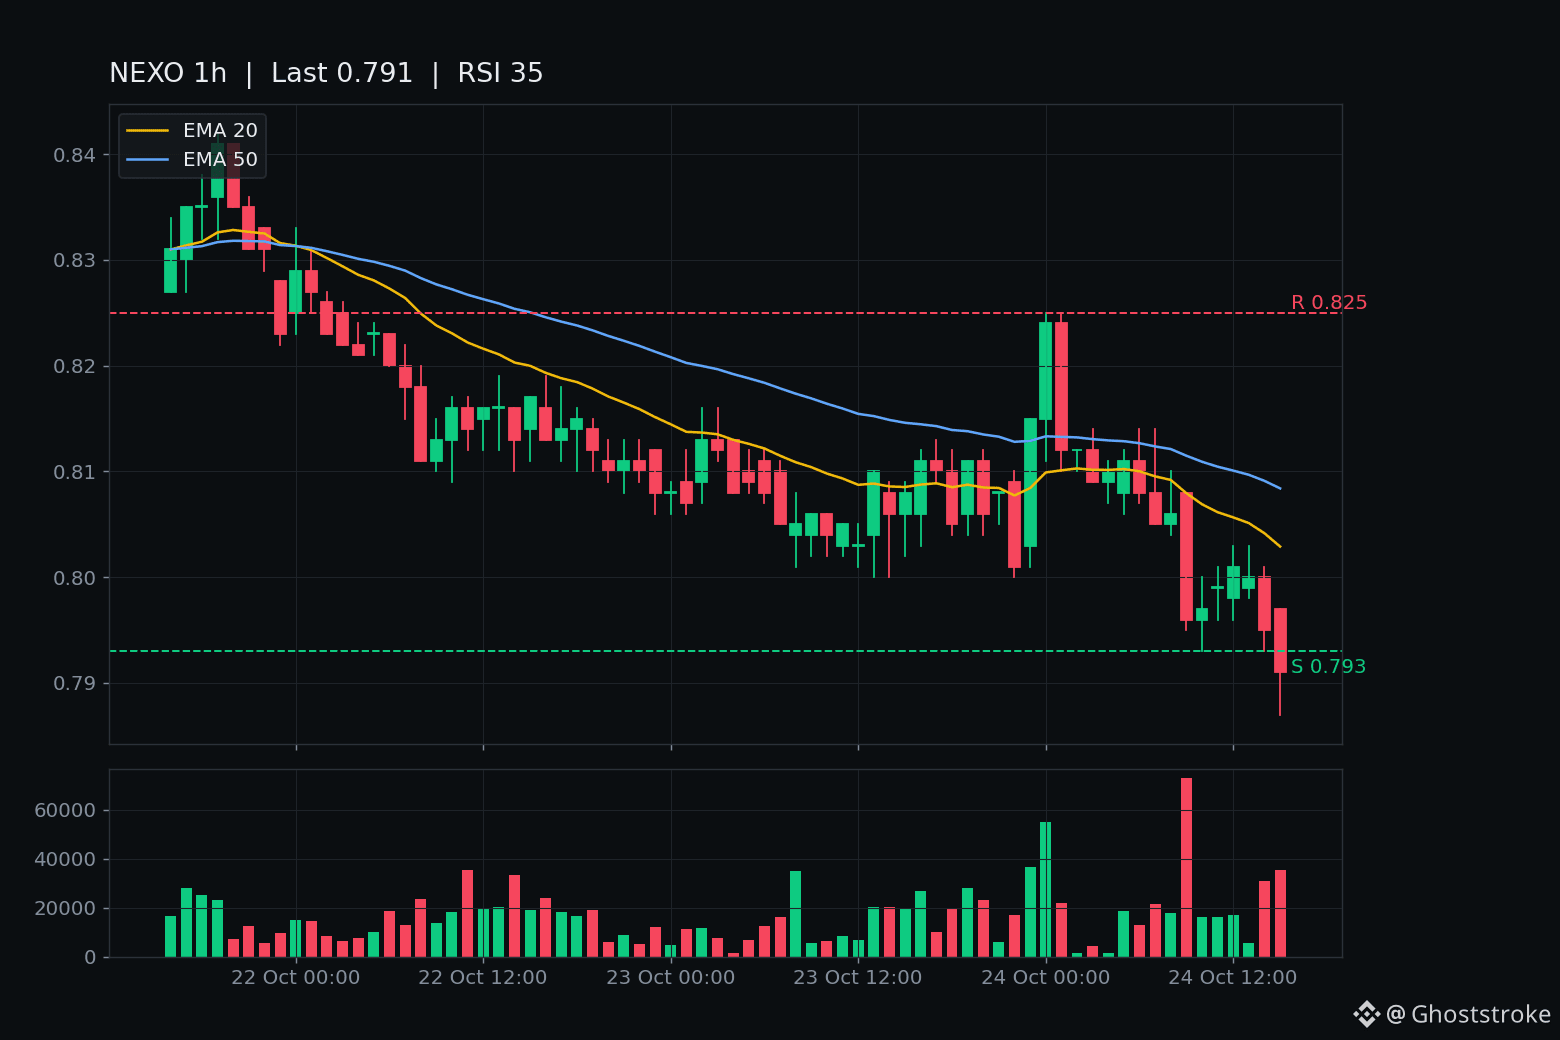
$NEXO just broke its base — $0.795 closed under $0.796, and the next hour printed a fresh low of $0.787.
This one was deferred, not missed. Earlier today price sat exactly ON the $0.796 line — a touch, not a break, so it stayed unposted. Now the trigger from that ruling has fired on a closed candle: the 14:00 UTC hour closed $0.795 under the line, and the forming hour has stayed under it, wicking to $0.787. Live around $0.79.
Be honest about the size of this: it's a grind breaking down, not a flush. -1.9% on the day, on just $418k of Binance volume. The 1h chart sits under EMA20 $0.803 and EMA50 $0.808, RSI 35 — weak, but not washed out. Thin volume cuts both ways: no conviction behind the break either.
Context matters here. Nexo is a real midcap — rank #83, ~$789M market cap, all 1B tokens circulating — not a microcap lottery ticket. It listed on Kraken two days ago, and it's breaking down anyway: the new venue didn't hold it up. And there's no fresh headline driving today's move — this is technical, not news.
Levels: $0.796 is resistance now — an hourly close back above it and this break is a fake-out. Above that, $0.825. Below, $0.787 is the line — a close under it and the break has room, with no recent shelf underneath in this window.
Not a call. A one-tick close under a line is the softest kind of break — it dies fast if $0.796 gets reclaimed.
$0.796 reclaimed and this is a fake-out, or $0.787 gives way and the base break has legs?
2

·
--
My gut tells me the strength of this rally in $INJ hasn’t been confirmed yet, but that’s purely a chart-reading instinct. Two data points could prove me right or wrong: whether it can hold $8 on a pullback, and whether volume picks up again. Over the past 30 days, it has climbed from $6.68 to $8.68, a gain of +51%, and ranks #83 by market cap. But what makes me cautious isn’t the size of the gain—it’s the pace. From October 16 to 17, the price surged from $8.53 to $8.72 as trading volume expanded from $219M to $294M—a clear sign of aggressive buying. The next day, the price was still around $8.68, but volume had fallen to $135M. The push had just ended, and the follow-through buying seemed to pause. What matters more to me is whether this drop in volume at elevated prices means weak hands are being shaken out, or buyers have temporarily run out of steam. $INJ is still -83.5% below its ATH, which really signals the weight of overhead supply: every leg up has to push through those holders. So here’s my take: if the price holds above $8 over the next few days, withstands a pullback, and volume returns to around $200M, then my gut feeling above is wrong. On the other hand, if it breaks below $8 while volume continues to shrink, this 30-day gain of +51% looks more like the tail end of a recovery than the start of a new cycle. Rather than taking sides now, I’d note these two conditions, watch how things play out for a couple of days, and then draw a conclusion.
My gut tells me the strength of this rally in $INJ hasn’t been confirmed yet, but that’s purely a chart-reading instinct. Two data points could prove me right or wrong: whether it can hold $8 on a pullback, and whether volume picks up again. Over the past 30 days, it has climbed from $6.68 to $8.68, a gain of +51%, and ranks #83 by market cap. But what makes me cautious isn’t the size of the gain—it’s the pace. From October 16 to 17, the price surged from $8.53 to $8.72 as trading volume expanded from $219M to $294M—a clear sign of aggressive buying. The next day, the price was still around $8.68, but volume had fallen to $135M. The push had just ended, and the follow-through buying seemed to pause. What matters more to me is whether this drop in volume at elevated prices means weak hands are being shaken out, or buyers have temporarily run out of steam. $INJ is still -83.5% below its ATH, which really signals the weight of overhead supply: every leg up has to push through those holders. So here’s my take: if the price holds above $8 over the next few days, withstands a pullback, and volume returns to around $200M, then my gut feeling above is wrong. On the other hand, if it breaks below $8 while volume continues to shrink, this 30-day gain of +51% looks more like the tail end of a recovery than the start of a new cycle. Rather than taking sides now, I’d note these two conditions, watch how things play out for a couple of days, and then draw a conclusion.
34
·
--
$PI is in an uncomfortable spot right now. Not for holders, but for those who’ve been watching around $0.08 for a long time and still haven’t made a move. Down 97% from its ATH, price stuck at $0.08, and virtually no change over the past 30 days—the picture looks neither like a bottom nor a crash. It’s more like a patch of ground nobody wants to be the first to step on.
I understand the dilemma: buy in now, and you worry it’ll keep sinking along with that $3.23M in daily volume; stay out, and you worry some news or a listing will send the price soaring while you’re left watching from the sidelines again. There’s nothing wrong with hesitating. The mistake is treating “cheap” as “safe.” It ranks #83 by market cap, but with only $3 million in daily trading volume, that ranking seems to be supported more by the existing narrative than by real money flowing in.
What I care about more is volume. Over the past 30 days, volume reached $12.66M on September 23, when the price was at $0.09. Since then, volume has steadily declined, reaching just $2–4M in recent days. The price hasn’t made a new low, but buyers haven’t shown any sign of aggression either. The narrow $0.078–0.080 range is still holding, but it’s only avoided a break for now—that doesn’t mean it will hold.
If one day volume climbs back above $10M and the price is still above $0.08, there’ll be time to consider getting in then. Until that happens, every bounce could just be a brief spike.
So the choice is yours: keep waiting for confirmation from higher volume, or pick up a little around $0.078 and bet that it won’t fall further? I lean toward the former, but think it through: waiting for confirmation often means giving up the chance to buy at the very bottom.

·
--
PYTH Surges 3.5% at a Key Time! What Happened? Key Levels HereAt 11:06 (4 minutes ago), PYTH surged 3.5% at a key time (5-minute window: 11:01→11:06). As of 11:10:35, the current price is 0.08263, down 1.4% over 24h. CTK and CAP also saw similar moves.
📅 Data as of 11:10:35 (event trigger times are noted in each item; prices are live snapshots at the time of writing)
📌 In a nutshell: Moves during key periods (such as candlestick closes and U.S. market opens/closes) often involve institutional participation, making these signals more reliable.
Market overview: BTC 83,669.60(+0.89%) · ETH 2,512.56(+0.79%); 24h market-wide: 325 gainers / 165 decliners; top 24h gainer: BTW +30.73%; top loser: APR -28.51%.
PYTH Surges 3.5% at a Key Time! What Happened? Key Levels Here
At 11:06 (4 minutes ago), PYTH surged 3.5% at a key time (5-minute window: 11:01→11:06). As of 11:10:35, the current price is 0.08263, down 1.4% over 24h. CTK and CAP also saw similar moves.
📅 Data as of 11:10:35 (event trigger times are noted in each item; prices are live snapshots at the time of writing)
📌 In a nutshell: Moves during key periods (such as candlestick closes and U.S. market opens/closes) often involve institutional participation, making these signals more reliable.
Market overview: BTC 83,669.60(+0.89%) · ETH 2,512.56(+0.79%); 24h market-wide: 325 gainers / 165 decliners; top 24h gainer: BTW +30.73%; top loser: APR -28.51%.
·
--
Heads up! PYTH surges 3.8% at a key time—where to buy the pullback?11:06 (just now) PYTH surged 3.8% at a key time (5-minute window 11:01→11:06). As of 11:07:26, the current price is 0.08279, down 0.8% over 24h. CTK and AVA also made similar moves.
📅 Data as of 11:07:26 (event trigger times are shown in each item; prices are real-time snapshots taken at the time of writing)
📌 In a nutshell: Unusual moves during key periods (K-line closes / U.S. stock market opens and closes) often involve institutional participation, making the signals more credible
Market overview: BTC 83,668.60(+0.98%) · ETH 2,513.56(+1.02%); across the market, 341 gainers / 150 losers in the past 24h; top gainer over 24h: BTW+31.61%, top loser: APR-27.91%.
Heads up! PYTH surges 3.8% at a key time—where to buy the pullback?
11:06 (just now) PYTH surged 3.8% at a key time (5-minute window 11:01→11:06). As of 11:07:26, the current price is 0.08279, down 0.8% over 24h. CTK and AVA also made similar moves.
📅 Data as of 11:07:26 (event trigger times are shown in each item; prices are real-time snapshots taken at the time of writing)
📌 In a nutshell: Unusual moves during key periods (K-line closes / U.S. stock market opens and closes) often involve institutional participation, making the signals more credible
Market overview: BTC 83,668.60(+0.98%) · ETH 2,513.56(+1.02%); across the market, 341 gainers / 150 losers in the past 24h; top gainer over 24h: BTW+31.61%, top loser: APR-27.91%.
24
·
--
ICP Surges 2.6% at a Key Time Point! What Happened? Key Levels Here14:55 (10 minutes ago): ICP surged 2.6% at a key time point (5-minute window 14:50→14:55). As of 15:05:25, the current price is 3.215, down 6.4% over 24h. Other assets showing unusual moves in the same batch include NAORIS and STRK.
📅 Data as of 15:05:25 (event trigger times are noted for each item; prices are real-time snapshots from when this was written)
📌 In a nutshell: Unusual moves during key periods (such as candlestick closes and U.S. market opens/closes) often involve institutional participation, making the signals more reliable.
Market overview: BTC 83,626.10(-0.70%) · ETH 2,528.17(-1.70%); across the market, 71 assets rose and 421 fell in 24h; 24h top gainer: GTC +45.17%, top loser: ARC -41.42%.
ICP Surges 2.6% at a Key Time Point! What Happened? Key Levels Here
14:55 (10 minutes ago): ICP surged 2.6% at a key time point (5-minute window 14:50→14:55). As of 15:05:25, the current price is 3.215, down 6.4% over 24h. Other assets showing unusual moves in the same batch include NAORIS and STRK.
📅 Data as of 15:05:25 (event trigger times are noted for each item; prices are real-time snapshots from when this was written)
📌 In a nutshell: Unusual moves during key periods (such as candlestick closes and U.S. market opens/closes) often involve institutional participation, making the signals more reliable.
Market overview: BTC 83,626.10(-0.70%) · ETH 2,528.17(-1.70%); across the market, 71 assets rose and 421 fell in 24h; 24h top gainer: GTC +45.17%, top loser: ARC -41.42%.
59
·
--
$AERO has climbed from $0.56 30 days ago to $0.93 now. You watched the whole move and never got in. I know this kind of dilemma all too well: buy now and worry you’re chasing a local high; sit it out and worry it’ll be like the last few Base ecosystem rallies, when it had already doubled by the time you made up your mind. You need to weigh both costs in advance—the cost of chasing is a possible pullback to the $0.79 area, where many holders have their cost basis; the emotional cost of missing out is that you’ll repeat the same cycle when the next big green candle appears.
What’s really worth paying attention to in the chart isn’t the +60% gain itself, but the volume. The bullish candle on September 26, which took the price from $0.69 to $0.85, came with 142M in trading volume. Volume has stayed above 50M since then, and surged again to 119M on October 9. That means tokens are changing hands—not that the price is rising on thin air. $AERO is still 59% below its ATH. Its 30-day gain is impressive, but it’s up just +18.5% over the past year. Essentially, it’s recovering from being oversold—not yet entering a euphoric bubble phase.
The dilemma at this level is that it has broken above a key range, but hasn’t yet made a convincing retest to confirm the breakout. And with a market-cap ranking of #83 and $100 million in daily trading volume, it has enough liquidity to absorb capital without being so large that the price action becomes sluggish. What I’m watching more closely is whether it pulls back on lower volume to $0.83–$0.85 over the next few days and holds. That would be a lower-cost entry for those who missed the move. But if volume keeps rising and the price breaks straight through $1, the pullback you’re waiting for may never come.
So here’s a choice for anyone who can’t decide: would you rather buy at the current price of $0.94 and set a clear stop-loss below $0.79, or wait for a retest of $0.85 and confirmation before entering, while accepting the risk that it may never happen? Both choices are reasonable. The key is to first figure out which outcome you’d find harder to live with.
7
·
--
STRK Surges 2.1% at a Key Time! What Happened? Key Levels Here23:50 (just now): STRK surged 2.1% at a key time (5-minute window 23:45→23:50). As of 23:51:46, the current price is 0.09092, up 20.7% in 24h. NEO and MAGIC also saw unusual moves during the same period.
📅 Data as of 23:51:46 (event trigger times are noted for each item; prices are real-time snapshots taken when this was written)
📌 Key takeaway: Unusual moves during key periods (candle closes / U.S. market open and close) often involve institutional participation, making them more significant signals.
Market overview: BTC 83,014.40(+0.09%) · ETH 2,509.99(+0.82%); across the market, 308 assets rose and 48 fell in 24h; top gainer over 24h: LUMIA +38.90%, top loser: PYTH -9.83%.
STRK Surges 2.1% at a Key Time! What Happened? Key Levels Here
23:50 (just now): STRK surged 2.1% at a key time (5-minute window 23:45→23:50). As of 23:51:46, the current price is 0.09092, up 20.7% in 24h. NEO and MAGIC also saw unusual moves during the same period.
📅 Data as of 23:51:46 (event trigger times are noted for each item; prices are real-time snapshots taken when this was written)
📌 Key takeaway: Unusual moves during key periods (candle closes / U.S. market open and close) often involve institutional participation, making them more significant signals.
Market overview: BTC 83,014.40(+0.09%) · ETH 2,509.99(+0.82%); across the market, 308 assets rose and 48 fell in 24h; top gainer over 24h: LUMIA +38.90%, top loser: PYTH -9.83%.
3
·
--
STRK surges 4.6% in 5 minutes! What happened? Key levels here23:00 (21 minutes ago): STRK surged 4.6% within 5 minutes (5-minute window 22:55→23:00). As of 23:21:26, the price is 0.08792, up 20.0% over 24h. Other assets with notable moves in the same batch included MAGIC and CKB.
📅 Data as of 23:21:26 (event trigger times are noted in each item; prices are real-time snapshots taken at the time of writing)
📌 In a nutshell: Short-term momentum is concentrated, and pullbacks can come quickly—placing staggered limit orders is steadier than chasing a rally
Market overview: BTC 82,931.20(+0.07%) · ETH 2,507.28(+0.83%); across the market, 326 assets rose and 31 fell over 24h; top 24h gainer: LUMIA+40.23%, top loser: SENT-8.81%.
STRK surges 4.6% in 5 minutes! What happened? Key levels here
23:00 (21 minutes ago): STRK surged 4.6% within 5 minutes (5-minute window 22:55→23:00). As of 23:21:26, the price is 0.08792, up 20.0% over 24h. Other assets with notable moves in the same batch included MAGIC and CKB.
📅 Data as of 23:21:26 (event trigger times are noted in each item; prices are real-time snapshots taken at the time of writing)
📌 In a nutshell: Short-term momentum is concentrated, and pullbacks can come quickly—placing staggered limit orders is steadier than chasing a rally
Market overview: BTC 82,931.20(+0.07%) · ETH 2,507.28(+0.83%); across the market, 326 assets rose and 31 fell over 24h; top 24h gainer: LUMIA+40.23%, top loser: SENT-8.81%.

·
--
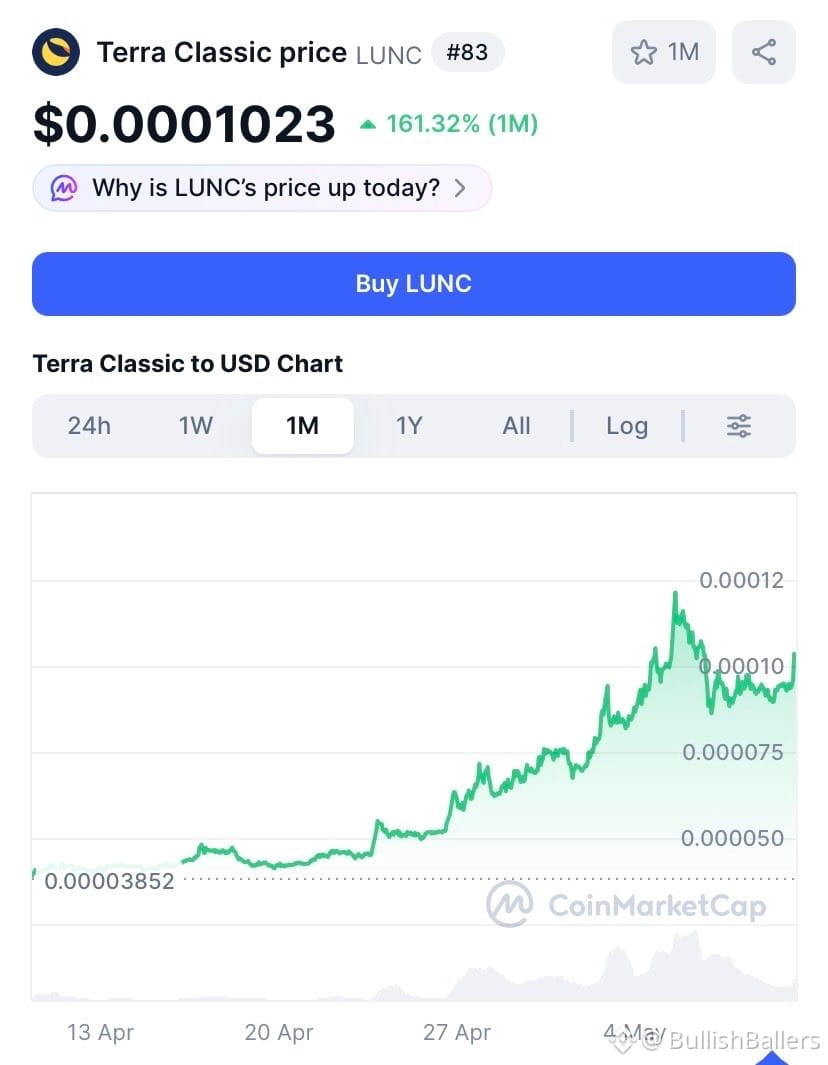
Terra-luna:native is making noise once more up 12.75%, trading 95.74 million in 24 hour volume, and ranked #83 in the world.
Terra Luna Classic is THE crypto to watch in 2026, top 50 is next! 💎$LUNC
{spot}(LUNCUSDT)
Terra-luna:native is making noise once more up 12.75%, trading 95.74 million in 24 hour volume, and ranked #83 in the world.
Terra Luna Classic is THE crypto to watch in 2026, top 50 is next! 💎$LUNC
Terra Luna Classic is THE crypto to watch in 2026, top 50 is next! 💎$LUNC
1
147

·
--
🔥 Trending Today
Top searched coins on CoinGecko right now:
$KAS (Kaspa) — rank #78.
$PUMP (Pump.fun) — rank #83.
$BTC (Bitcoin) — rank #1.
Trending ≠ recommendation. Always DYOR.
🔥 Trending Today
Top searched coins on CoinGecko right now:
$KAS (Kaspa) — rank #78.
$PUMP (Pump.fun) — rank #83.
$BTC (Bitcoin) — rank #1.
Trending ≠ recommendation. Always DYOR.
Top searched coins on CoinGecko right now:
$KAS (Kaspa) — rank #78.
$PUMP (Pump.fun) — rank #83.
$BTC (Bitcoin) — rank #1.
Trending ≠ recommendation. Always DYOR.
89


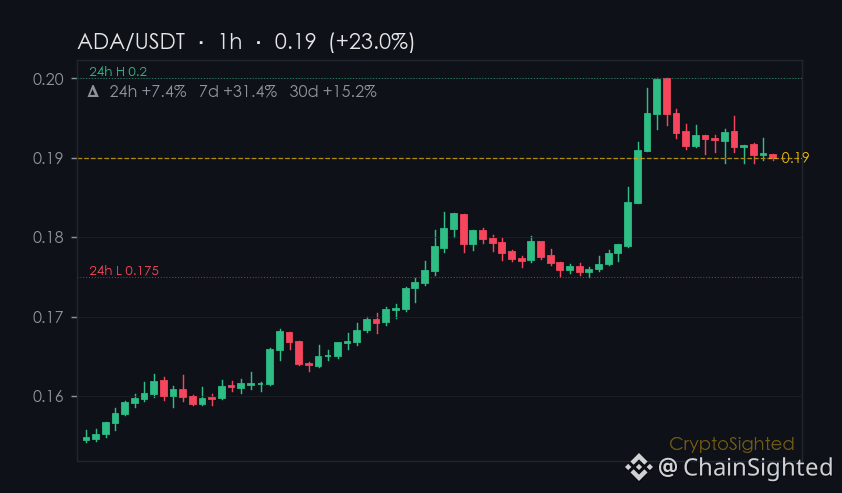
$ADA’s 24-hour gain of ↑6.53% stands out against the backdrop of PHB’s 70% plunge in the same period.
ADA’s 7-day gain of ↑32.4% dwarfs its 30-day gain of ↑21.3%,
creating a divergence that stands out against $BTC’s more modest ↑4.6% over the same period.
The numbers don’t lie - short-term momentum is building fast,
but it’s not yet reflected in the longer view. That kind of gap between the weekly and monthly trends doesn’t happen by accident. It suggests something is shifting
whether it’s a shift in sentiment, a new catalyst, or just a phase in the broader cycle.
The data is clear. The coin has been moving. The question remains: is this the beginning
or just a passing surge?
The rest, you decide.
Not financial advice. DYOR.
📌 Hotspot Watch · #83 · #CryptoTrends #CryptoSighted $BTC
$ADA ’s 24-hour gain of ↑6.53% stands out against the backdrop of PHB’s 70% plunge in the same period.
ADA’s 7-day gain of ↑32.4% dwarfs its 30-day gain of ↑21.3%,
creating a divergence that stands out against $BTC ’s more modest ↑4.6% over the same period.
The numbers don’t lie - short-term momentum is building fast,
but it’s not yet reflected in the longer view. That kind of gap between the weekly and monthly trends doesn’t happen by accident. It suggests something is shifting
whether it’s a shift in sentiment, a new catalyst, or just a phase in the broader cycle.
The data is clear. The coin has been moving. The question remains: is this the beginning
or just a passing surge?
The rest, you decide.
Not financial advice. DYOR.
📌 Hotspot Watch · #83 · #CryptoTrends #CryptoSighted $BTC
40
Partly True
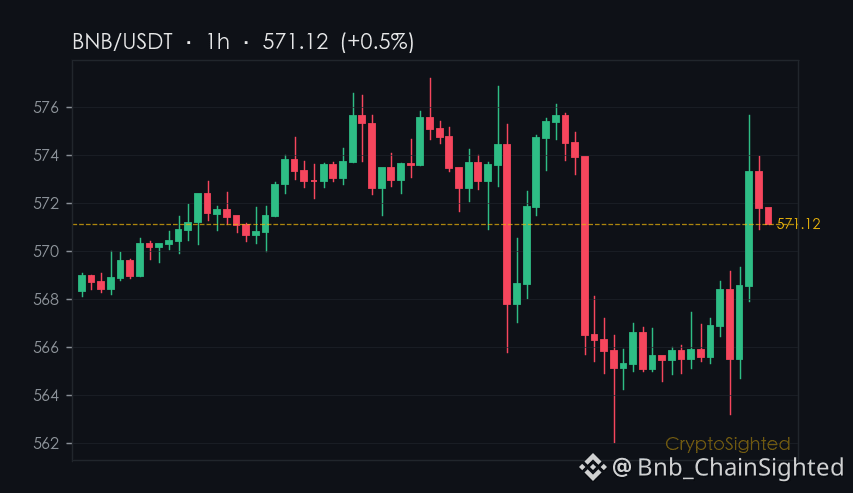
13 announcements in 10 days. $BNB’s July 2026 expansion is accelerating.
Binance has rolled out a series of new trading pairs, futures contracts, and collateral assets under the BNB ecosystem in just over a week.
$AERO, on the other hand, has had two announcements on Binance, both related to Earn and Buy Crypto features.
Could this suggest different priorities or timelines for the two projects? It’s worth watching how AERO’s role on Binance develops over time.
—
Not financial advice. DYOR.
📌 Announcements · #83 · #CryptoNews #CryptoSighted $BNB
13 announcements in 10 days. $BNB ’s July 2026 expansion is accelerating.
Binance has rolled out a series of new trading pairs, futures contracts, and collateral assets under the BNB ecosystem in just over a week.
$AERO , on the other hand, has had two announcements on Binance, both related to Earn and Buy Crypto features.
Could this suggest different priorities or timelines for the two projects? It’s worth watching how AERO’s role on Binance develops over time.
—
Not financial advice. DYOR.
📌 Announcements · #83 · #CryptoNews #CryptoSighted $BNB
1
286
·
--
If you feel that in this round of fund rotation it seems like no one is mentioning $ATOM anymore—your hunch is basically correct. Even though it’s up 6.5% today, based on the market-cap ranking (#83) and trading volume (34M), it’s merely short-term short-covering after an oversold pullback, not incremental funds setting up a systemic position.
Over the past 30 days it fell nearly 16%. The rebound happened after the decline accelerated and after the bottom area saw increased trading volume—this is a classic technical buy signal, not a narrative refresh. More directly: it’s still 97% away from its all-time high (ATH), which indicates the market has long since lost its pricing power/“beta” over it.
The real value of this bullish candle lies in this: it bounced from a low of $1.225 back to $1.35. Volume is slightly above the monthly average, but it’s still nowhere near enough to confirm a trend reversal. What I see more is that the shorts are choosing to stop actively within the next 48 hours—not that the longs are rushing in to accumulate.
What’s truly worth watching is this: if over the next few days the volume can’t hold up and the price slips back below $1.3, then this rebound is just pattern repair, not a trend reversal. But if it consolidates on lighter volume between $1.3 and $1.36 and then breaks out with volume, that’s when the signal to seriously consider adding positions emerges.
In the current valuation structure of $ATOM, there’s almost no alpha. So what’s the rationale for this capital to enter—do they think it’s cheap enough, or has a Cosmos ecosystem “new catalyst” appeared that you’re more sensitive to than I am? There are clues you can link in the comments—I’m looking for them.
If you feel that in this round of fund rotation it seems like no one is mentioning $ATOM anymore—your hunch is basically correct. Even though it’s up 6.5% today, based on the market-cap ranking (#83) and trading volume (34M), it’s merely short-term short-covering after an oversold pullback, not incremental funds setting up a systemic position.
Over the past 30 days it fell nearly 16%. The rebound happened after the decline accelerated and after the bottom area saw increased trading volume—this is a classic technical buy signal, not a narrative refresh. More directly: it’s still 97% away from its all-time high (ATH), which indicates the market has long since lost its pricing power/“beta” over it.
The real value of this bullish candle lies in this: it bounced from a low of $1.225 back to $1.35. Volume is slightly above the monthly average, but it’s still nowhere near enough to confirm a trend reversal. What I see more is that the shorts are choosing to stop actively within the next 48 hours—not that the longs are rushing in to accumulate.
What’s truly worth watching is this: if over the next few days the volume can’t hold up and the price slips back below $1.3, then this rebound is just pattern repair, not a trend reversal. But if it consolidates on lighter volume between $1.3 and $1.36 and then breaks out with volume, that’s when the signal to seriously consider adding positions emerges.
In the current valuation structure of $ATOM , there’s almost no alpha. So what’s the rationale for this capital to enter—do they think it’s cheap enough, or has a Cosmos ecosystem “new catalyst” appeared that you’re more sensitive to than I am? There are clues you can link in the comments—I’m looking for them.
56
·
--
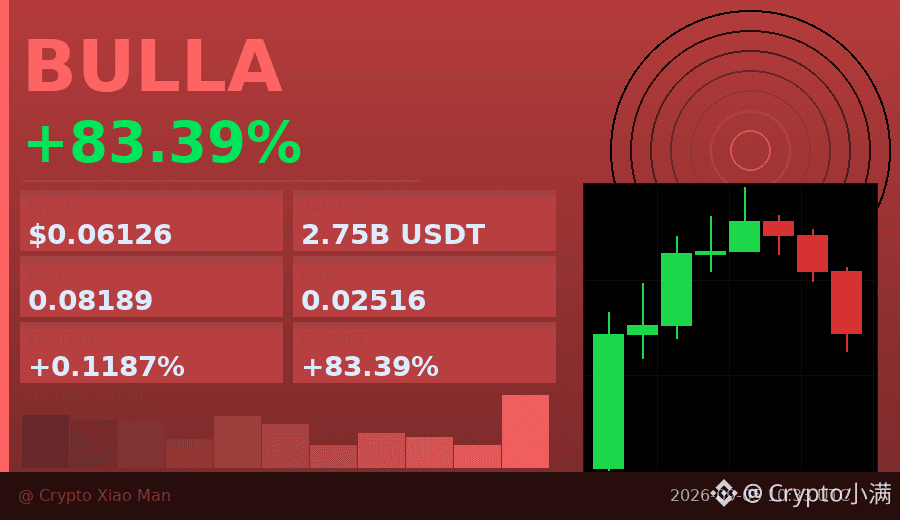
83% single-day gain, but the funding rate has already surged to 0.12%—what does that mean?
BULLA moved from 0.025 to 0.082 today, with trading volume reaching 275 million USDT, which looks like a typical sentiment-driven breakout. But look closer: the hourly chart has closed red for three straight candles, and the last one came with increased volume.
Longs account for 35%, shorts 65%, and most people are already trying to call the top. This kind of extreme disagreement plus a high funding rate is often a sign of a short-term pullback.
I'm not saying the rally is over, but a reminder: before chasing the move, ask yourself—are you trading the trend, or are you the one holding the bag?
$BULLA #资金费率预警 #83%
Click the card below to quickly check the market 👇
11
Log in to explore more content
Join global crypto users on Binance Square
⚡️ Get latest and useful information about crypto.
💬 Trusted by the world’s largest crypto exchange.
👍 Discover real insights from verified creators.
Email / Phone number
Trending Topics
1
#BinanceProcesses$4.65BWithdrawals
10,386 views
79 Discussing
2
#WithdrawalsBack: 15 networks live
5,604 views
112 Discussing
3
#BinanceUpdatesProofofReservesAddresses
97,128 views
1,379 Discussing
4
#BinanceToResumePhaseOneOfWithdrawals
136,496 views
1,502 Discussing
5
#BinanceHadAlreadyCovered$6BofHackLoss
9,228 views
132 Discussing
6
#FBIConfirmsNorthKoreaIsResponsibleForBinanceCryptoHack
45,884 views
144 Discussing
7
#CZDismissesClaimsBinanceHackWasPredicted
67,546 views
683 Discussing
8
#B14gReportsUnauthorizedTransferOfAbout97MCORE
22,513 views
332 Discussing
9
#USSpotETHETFsPost23StraightDaysOfNetOutflows
26,123 views
311 Discussing
10
#IntelHasItsWorstDaySince1974
117,719 views
925 Discussing