
#76
76
133,822 views
52 Discussing
Hot
Latest

·
--
76% of people are shorting… and then they got stomped.
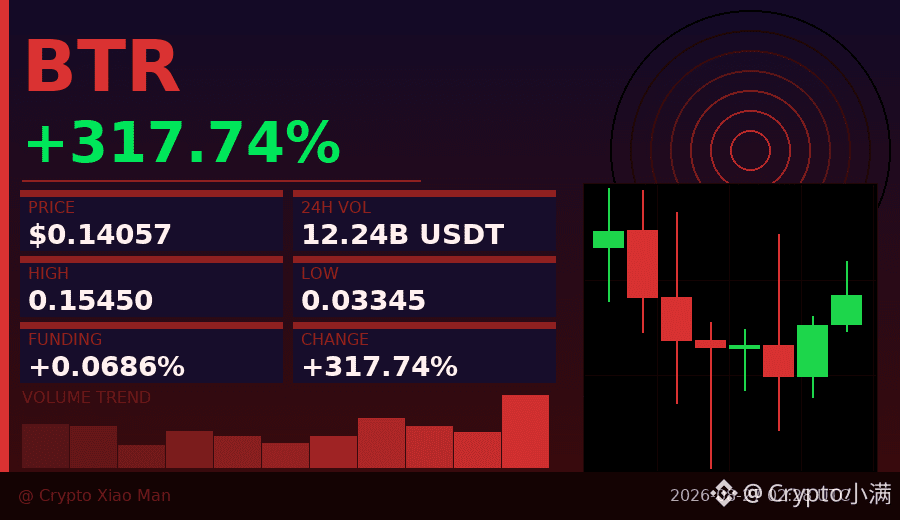
Today, BTR is up more than 316%—rising from the low of 0.033 all the way to 0.154, nearly a 5x increase.
But what’s more interesting isn’t the gain—it’s the positioning structure.
On the right, 76.4% of contract positions are short orders, with only under 24% long positions.
This means most people didn’t believe in this move at the start—they bet it would fall.
As more people short, the force of liquidation squeezes becomes stronger; instead, it turns into fuel for the rally.
This is called a short squeeze: price rises → shorts lose money → forced to close positions by buying → price rises again → more shorts get liquidated.
It’s a self-reinforcing dead loop, kicking bearish players out one by one.
The funding rate is currently positive (0.069%), indicating longs have started to dominate and are continuing to pay fees to maintain their positions.
Three consecutive hourly bullish candles suggest short-term momentum is still there.
Of course, after a 5x surge, any reversal can be extremely violent.
The remaining 24% longs should be careful—if you chase higher, you fall faster.
If the shorts haven’t exited yet, next it’ll be either more squeezing or waiting for a brutal pullback.
In this kind of extreme long/short ratio market, it’s not really about whether your direction is right—it’s about who can’t hold out first.
$BTR #空头挤压 #76% short positions
Click the small card below to quickly view the行情👇
76% of people are shorting… and then they got stomped.
Today, BTR is up more than 316%—rising from the low of 0.033 all the way to 0.154, nearly a 5x increase.
But what’s more interesting isn’t the gain—it’s the positioning structure.
On the right, 76.4% of contract positions are short orders, with only under 24% long positions.
This means most people didn’t believe in this move at the start—they bet it would fall.
As more people short, the force of liquidation squeezes becomes stronger; instead, it turns into fuel for the rally.
This is called a short squeeze: price rises → shorts lose money → forced to close positions by buying → price rises again → more shorts get liquidated.
It’s a self-reinforcing dead loop, kicking bearish players out one by one.
The funding rate is currently positive (0.069%), indicating longs have started to dominate and are continuing to pay fees to maintain their positions.
Three consecutive hourly bullish candles suggest short-term momentum is still there.
Of course, after a 5x surge, any reversal can be extremely violent.
The remaining 24% longs should be careful—if you chase higher, you fall faster.
If the shorts haven’t exited yet, next it’ll be either more squeezing or waiting for a brutal pullback.
In this kind of extreme long/short ratio market, it’s not really about whether your direction is right—it’s about who can’t hold out first.
$BTR #空头挤压 #76% short positions
Click the small card below to quickly view the行情👇
Today, BTR is up more than 316%—rising from the low of 0.033 all the way to 0.154, nearly a 5x increase.
But what’s more interesting isn’t the gain—it’s the positioning structure.
On the right, 76.4% of contract positions are short orders, with only under 24% long positions.
This means most people didn’t believe in this move at the start—they bet it would fall.
As more people short, the force of liquidation squeezes becomes stronger; instead, it turns into fuel for the rally.
This is called a short squeeze: price rises → shorts lose money → forced to close positions by buying → price rises again → more shorts get liquidated.
It’s a self-reinforcing dead loop, kicking bearish players out one by one.
The funding rate is currently positive (0.069%), indicating longs have started to dominate and are continuing to pay fees to maintain their positions.
Three consecutive hourly bullish candles suggest short-term momentum is still there.
Of course, after a 5x surge, any reversal can be extremely violent.
The remaining 24% longs should be careful—if you chase higher, you fall faster.
If the shorts haven’t exited yet, next it’ll be either more squeezing or waiting for a brutal pullback.
In this kind of extreme long/short ratio market, it’s not really about whether your direction is right—it’s about who can’t hold out first.
$BTR #空头挤压 #76% short positions
Click the small card below to quickly view the行情👇
1
1
502

POL spot check 📉
Polygon's POL is trading around $0.086, down ~1.5-2% in the last 24h. The slide continues — down ~10% this week and ~12% over the last month, with a market cap near $928M (rank #76).
Key levels to watch:
• Support: $0.0859 (today's low), then $0.085
• Resistance: $0.0902 (today's high), then $0.092
Polygon still powers one of the biggest L2 ecosystems (TVL ~$630M), but POL is stuck under $0.09 while the wider market bleeds. A daily close back above $0.09 would be the first sign buyers are stepping in. Until then, the trend stays weak.
$BTC is holding ~$73.5K with spot ETF outflows now 5 days straight — risk-off mood across the board.
Not financial advice. DYOR.
#Polygon #Crypto #Altcoins
POL spot check 📉
Polygon's POL is trading around $0.086, down ~1.5-2% in the last 24h. The slide continues — down ~10% this week and ~12% over the last month, with a market cap near $928M (rank #76).
Key levels to watch:
• Support: $0.0859 (today's low), then $0.085
• Resistance: $0.0902 (today's high), then $0.092
Polygon still powers one of the biggest L2 ecosystems (TVL ~$630M), but POL is stuck under $0.09 while the wider market bleeds. A daily close back above $0.09 would be the first sign buyers are stepping in. Until then, the trend stays weak.
$BTC is holding ~$73.5K with spot ETF outflows now 5 days straight — risk-off mood across the board.
Not financial advice. DYOR.
#Polygon #Crypto #Altcoins
Polygon's POL is trading around $0.086, down ~1.5-2% in the last 24h. The slide continues — down ~10% this week and ~12% over the last month, with a market cap near $928M (rank #76).
Key levels to watch:
• Support: $0.0859 (today's low), then $0.085
• Resistance: $0.0902 (today's high), then $0.092
Polygon still powers one of the biggest L2 ecosystems (TVL ~$630M), but POL is stuck under $0.09 while the wider market bleeds. A daily close back above $0.09 would be the first sign buyers are stepping in. Until then, the trend stays weak.
$BTC is holding ~$73.5K with spot ETF outflows now 5 days straight — risk-off mood across the board.
Not financial advice. DYOR.
#Polygon #Crypto #Altcoins
65

·
--
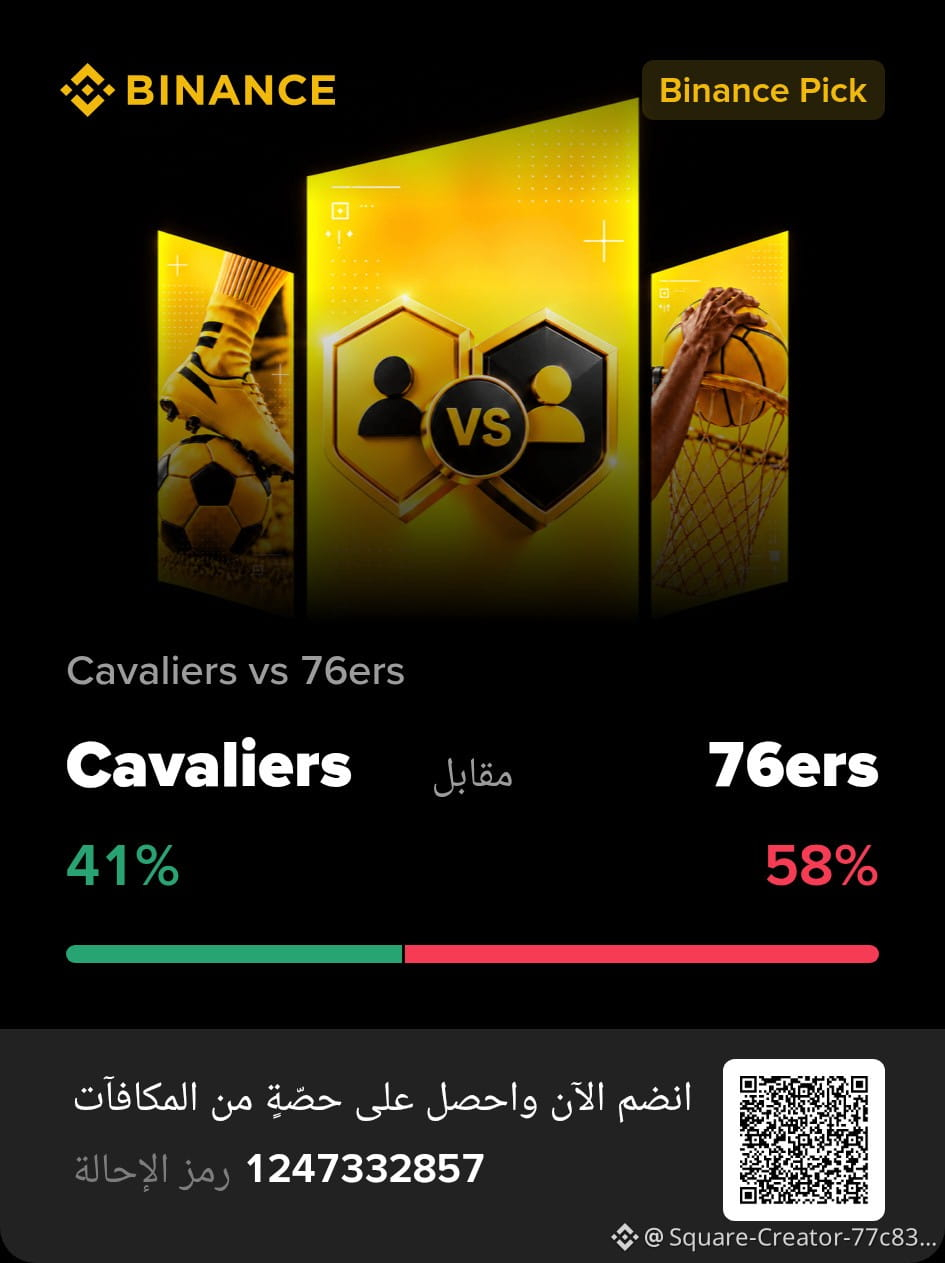
#BinancePick You can participate in trading predictions and take part in predictions and odds on #BinanceSquareFamily , and I think team #76 ers has a chance of winning.
#BinancePick You can participate in trading predictions and take part in predictions and odds on #BinanceSquareFamily , and I think team #76 ers has a chance of winning.
79

Article
They Didn't Hack BONK. They Voted to Steal $20M.No code was broken. No wallet was hacked.
Someone simply voted $20M out of BonkDAO's treasury — and under the rules as written, the vote was legal.
Here's the twist before you share the post going around this week: it didn't happen this week. The heist happened on 6 July 2026. The version blowing up again in the last few days is a repost — and one widely shared copy even priced BONK at $0.05, roughly 16,000 times today's price. If a screenshot has no date, don't trust it.
The heist itself is still crypto's wildest governance story this year. The attacker spent about $4.4M buying roughly 882 billion BONK — just over 1% of supply — across 4–5 July. That was enough to clear BonkDAO's quorum, which was set at just 1%. The proposal, BIP #76, had a zero-second timelock: no waiting period, no veto. When the vote closed on 6 July, only 7 wallets had voted, and the attacker's wallet held 99.87% of the yes votes. In the same block, 4.426 trillion BONK — about $20M — left the treasury. BonkDAO called it a malicious governance proposal, said it had identified the exchange wallets, and notified law enforcement. No recovery of the funds has been publicly confirmed.
So why does a July heist matter today? Because the trust discount never left. South Korea's Upbit delisted BONK on 7 September, saying the security concerns were unresolved; Bithumb, by contrast, lifted its caution warning. A governance fix still has no confirmed public timeline. And BONK's supply story leaves no excuses: it is now fully unlocked — all 87.99 trillion tokens — so there is no unlock cliff coming. The risk is who already holds it: the top 10 wallets hold about 38.6% of supply, though the biggest is a Binance hot wallet holding tokens for customers, not one whale.
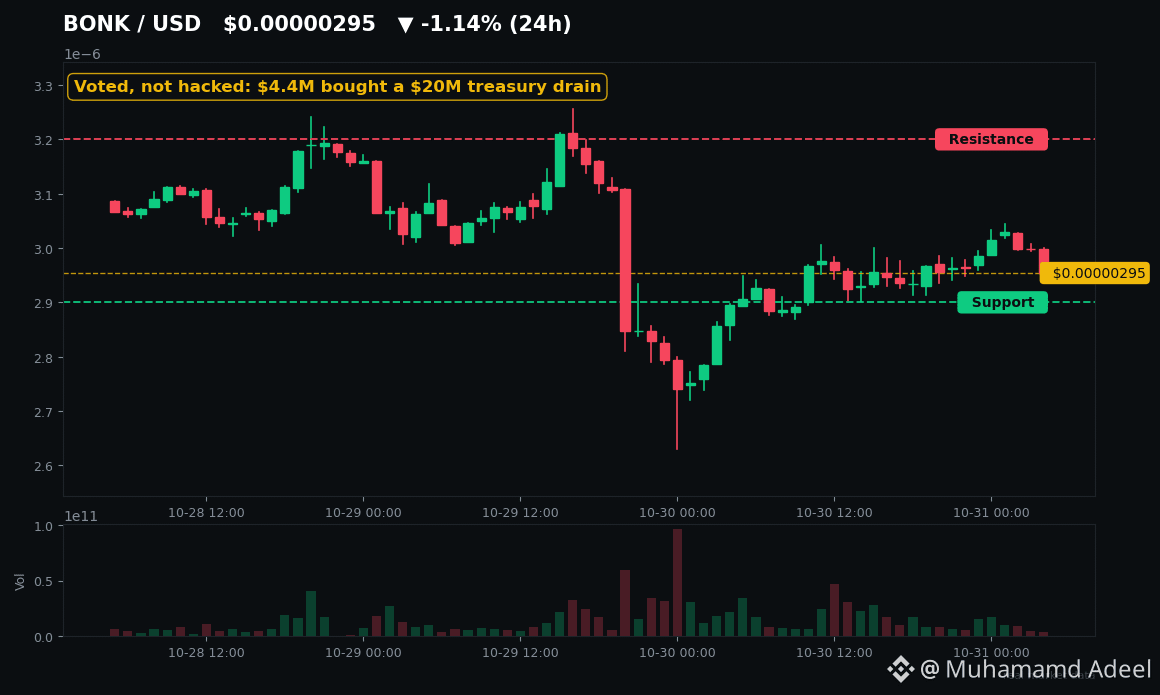
Where does that leave the trade? $BONK is changing hands near $0.000003 this morning after a weak month — down roughly 22% over 30 days and about 95% below its November 2024 peak near $0.000059. Daily RSI sits near 45, neutral. The levels traders are watching are tight: support at $0.0000028–$0.0000029, resistance at $0.0000030–$0.0000032. A daily close above $0.0000032 would open room toward the $0.0000035 area flagged in recent analyses; losing $0.0000028 puts the recent lows back in play. Check the $BONK chart — the levels are close together, so a break either way moves fast.
The wider Solana meme crowd is stirring again — LunarCrush ranked BONK #3 for social momentum this morning — and traders rotating between Solana memes are watching $SOL and $WIF alongside it. But rotation is not redemption: BONK's pumps were built on listings and Solana moments, never on burns — a 1.69 trillion BONK burn in December 2024 was followed by a 7% fall.
So here's the real question: is DAO voting broken, or was this a treasury with a 1% quorum and no timelock asking to be robbed? Until BonkDAO proves the fix, every BONK bounce trades under that shadow.
Not financial advice. DYOR.
They Didn't Hack BONK. They Voted to Steal $20M.
No code was broken. No wallet was hacked.
Someone simply voted $20M out of BonkDAO's treasury — and under the rules as written, the vote was legal.
Here's the twist before you share the post going around this week: it didn't happen this week. The heist happened on 6 July 2026. The version blowing up again in the last few days is a repost — and one widely shared copy even priced BONK at $0.05, roughly 16,000 times today's price. If a screenshot has no date, don't trust it.
The heist itself is still crypto's wildest governance story this year. The attacker spent about $4.4M buying roughly 882 billion BONK — just over 1% of supply — across 4–5 July. That was enough to clear BonkDAO's quorum, which was set at just 1%. The proposal, BIP #76, had a zero-second timelock: no waiting period, no veto. When the vote closed on 6 July, only 7 wallets had voted, and the attacker's wallet held 99.87% of the yes votes. In the same block, 4.426 trillion BONK — about $20M — left the treasury. BonkDAO called it a malicious governance proposal, said it had identified the exchange wallets, and notified law enforcement. No recovery of the funds has been publicly confirmed.
So why does a July heist matter today? Because the trust discount never left. South Korea's Upbit delisted BONK on 7 September, saying the security concerns were unresolved; Bithumb, by contrast, lifted its caution warning. A governance fix still has no confirmed public timeline. And BONK's supply story leaves no excuses: it is now fully unlocked — all 87.99 trillion tokens — so there is no unlock cliff coming. The risk is who already holds it: the top 10 wallets hold about 38.6% of supply, though the biggest is a Binance hot wallet holding tokens for customers, not one whale.
Where does that leave the trade? $BONK is changing hands near $0.000003 this morning after a weak month — down roughly 22% over 30 days and about 95% below its November 2024 peak near $0.000059. Daily RSI sits near 45, neutral. The levels traders are watching are tight: support at $0.0000028–$0.0000029, resistance at $0.0000030–$0.0000032. A daily close above $0.0000032 would open room toward the $0.0000035 area flagged in recent analyses; losing $0.0000028 puts the recent lows back in play. Check the $BONK chart — the levels are close together, so a break either way moves fast.
The wider Solana meme crowd is stirring again — LunarCrush ranked BONK #3 for social momentum this morning — and traders rotating between Solana memes are watching $SOL and $WIF alongside it. But rotation is not redemption: BONK's pumps were built on listings and Solana moments, never on burns — a 1.69 trillion BONK burn in December 2024 was followed by a 7% fall.
So here's the real question: is DAO voting broken, or was this a treasury with a 1% quorum and no timelock asking to be robbed? Until BonkDAO proves the fix, every BONK bounce trades under that shadow.
Not financial advice. DYOR.
Someone simply voted $20M out of BonkDAO's treasury — and under the rules as written, the vote was legal.
Here's the twist before you share the post going around this week: it didn't happen this week. The heist happened on 6 July 2026. The version blowing up again in the last few days is a repost — and one widely shared copy even priced BONK at $0.05, roughly 16,000 times today's price. If a screenshot has no date, don't trust it.
The heist itself is still crypto's wildest governance story this year. The attacker spent about $4.4M buying roughly 882 billion BONK — just over 1% of supply — across 4–5 July. That was enough to clear BonkDAO's quorum, which was set at just 1%. The proposal, BIP #76, had a zero-second timelock: no waiting period, no veto. When the vote closed on 6 July, only 7 wallets had voted, and the attacker's wallet held 99.87% of the yes votes. In the same block, 4.426 trillion BONK — about $20M — left the treasury. BonkDAO called it a malicious governance proposal, said it had identified the exchange wallets, and notified law enforcement. No recovery of the funds has been publicly confirmed.
So why does a July heist matter today? Because the trust discount never left. South Korea's Upbit delisted BONK on 7 September, saying the security concerns were unresolved; Bithumb, by contrast, lifted its caution warning. A governance fix still has no confirmed public timeline. And BONK's supply story leaves no excuses: it is now fully unlocked — all 87.99 trillion tokens — so there is no unlock cliff coming. The risk is who already holds it: the top 10 wallets hold about 38.6% of supply, though the biggest is a Binance hot wallet holding tokens for customers, not one whale.
Where does that leave the trade? $BONK is changing hands near $0.000003 this morning after a weak month — down roughly 22% over 30 days and about 95% below its November 2024 peak near $0.000059. Daily RSI sits near 45, neutral. The levels traders are watching are tight: support at $0.0000028–$0.0000029, resistance at $0.0000030–$0.0000032. A daily close above $0.0000032 would open room toward the $0.0000035 area flagged in recent analyses; losing $0.0000028 puts the recent lows back in play. Check the $BONK chart — the levels are close together, so a break either way moves fast.
The wider Solana meme crowd is stirring again — LunarCrush ranked BONK #3 for social momentum this morning — and traders rotating between Solana memes are watching $SOL and $WIF alongside it. But rotation is not redemption: BONK's pumps were built on listings and Solana moments, never on burns — a 1.69 trillion BONK burn in December 2024 was followed by a 7% fall.
So here's the real question: is DAO voting broken, or was this a treasury with a 1% quorum and no timelock asking to be robbed? Until BonkDAO proves the fix, every BONK bounce trades under that shadow.
Not financial advice. DYOR.
74
Article
BONK Is Flat, Quiet — and Coiled Right Before the Fed DecidesBONK is the quietest memecoin on my screen this morning — and with the Fed's decision landing Wednesday, quiet is exactly when these charts move.
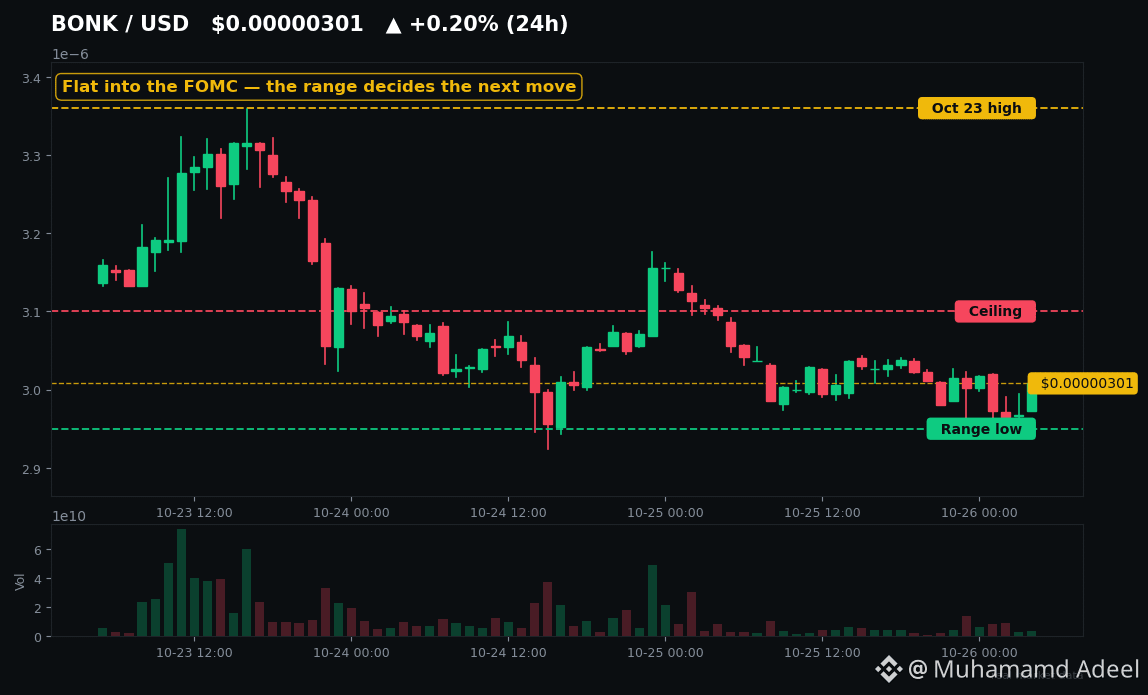
$BONK is sitting at about $0.00000300, essentially flat over 24 hours, squeezed into a $0.00000295–$0.00000310 range. No catalyst. No panic. Just a coiled spring with a timer on it.
First, a warning before you scroll any further. Your feed may be showing a "$20M BONK treasury drained" headline this morning. That story is real — but it is from 6 July, not today. The live tape shows no crash: Kraken has BONK up about 0.1% over 24 hours, not down 7%. If someone is selling you panic about it today, they are selling you old news with a fresh timestamp.
So what is actually happening? A slow bleed of attention. BONK's week has been choppy, not trending: up to $0.00000336 on 23 October, then a 4.9% drop on Sunday, leaving the week roughly 2% net positive. CoinMarketCap's 25 October read put volume down about 36% to roughly $33M, with price below its 7-day and 30-day averages and RSI near 42. Traders are not piling in. They are waiting.
Here is the setup that matters. Support sits at $0.00000295 — today's low, defended so far — with $0.000002885 below it. Resistance is $0.00000310, the ceiling capping the last two days, then $0.00000316 and the 23 October high at $0.00000336. A break above $0.00000310 would be the first sign of stabilization. A break below $0.00000295 opens the lower end of the range.
And here is why this range deserves respect, not boredom. BONK still carries the heaviest governance scar of any major memecoin. On 6 July, an attacker spent about $4.4M buying just over 1% of supply, cleared a 1% quorum, and passed proposal BIP #76 — moving roughly 4.426 trillion BONK, about $20M at the time, out of the BonkDAO treasury. Seven wallets voted. There was no timelock, no veto, no bug. As Rekt put it: BonkDAO did not get robbed, it got outvoted. The attacker has never been identified, no recovery has been confirmed, Upbit delisted BONK in September, and as of mid-October analysts were still calling for governance reforms that have not been publicly confirmed. That overhang is why BONK rallies keep fading.
The macro backdrop does the rest. Bitcoin is under $80,000, more than $810M in crypto positions were liquidated in a day, and the Federal Open Market Committee decides on Wednesday, with September PCE data the day after. Memecoins are high-beta to that tape — when traders de-risk, memes fall first and fastest. And because BONK lives on Solana, $SOL sentiment is the weather vane: if Solana rotation stays risk-off into Wednesday, BONK's range breaks down, not up.
What I am watching: whether $0.00000295 holds into Wednesday, whether $0.00000310 gets reclaimed on real volume, and whether anyone in the BonkDAO conversation finally shows a governance fix rather than another retrospective. Check $BONK's chart to see how the market is pricing that gap between a quiet tape and an unresolved past.
Not financial advice. DYOR.
BONK Is Flat, Quiet — and Coiled Right Before the Fed Decides
BONK is the quietest memecoin on my screen this morning — and with the Fed's decision landing Wednesday, quiet is exactly when these charts move.
$BONK is sitting at about $0.00000300, essentially flat over 24 hours, squeezed into a $0.00000295–$0.00000310 range. No catalyst. No panic. Just a coiled spring with a timer on it.
First, a warning before you scroll any further. Your feed may be showing a "$20M BONK treasury drained" headline this morning. That story is real — but it is from 6 July, not today. The live tape shows no crash: Kraken has BONK up about 0.1% over 24 hours, not down 7%. If someone is selling you panic about it today, they are selling you old news with a fresh timestamp.
So what is actually happening? A slow bleed of attention. BONK's week has been choppy, not trending: up to $0.00000336 on 23 October, then a 4.9% drop on Sunday, leaving the week roughly 2% net positive. CoinMarketCap's 25 October read put volume down about 36% to roughly $33M, with price below its 7-day and 30-day averages and RSI near 42. Traders are not piling in. They are waiting.
Here is the setup that matters. Support sits at $0.00000295 — today's low, defended so far — with $0.000002885 below it. Resistance is $0.00000310, the ceiling capping the last two days, then $0.00000316 and the 23 October high at $0.00000336. A break above $0.00000310 would be the first sign of stabilization. A break below $0.00000295 opens the lower end of the range.
And here is why this range deserves respect, not boredom. BONK still carries the heaviest governance scar of any major memecoin. On 6 July, an attacker spent about $4.4M buying just over 1% of supply, cleared a 1% quorum, and passed proposal BIP #76 — moving roughly 4.426 trillion BONK, about $20M at the time, out of the BonkDAO treasury. Seven wallets voted. There was no timelock, no veto, no bug. As Rekt put it: BonkDAO did not get robbed, it got outvoted. The attacker has never been identified, no recovery has been confirmed, Upbit delisted BONK in September, and as of mid-October analysts were still calling for governance reforms that have not been publicly confirmed. That overhang is why BONK rallies keep fading.
The macro backdrop does the rest. Bitcoin is under $80,000, more than $810M in crypto positions were liquidated in a day, and the Federal Open Market Committee decides on Wednesday, with September PCE data the day after. Memecoins are high-beta to that tape — when traders de-risk, memes fall first and fastest. And because BONK lives on Solana, $SOL sentiment is the weather vane: if Solana rotation stays risk-off into Wednesday, BONK's range breaks down, not up.
What I am watching: whether $0.00000295 holds into Wednesday, whether $0.00000310 gets reclaimed on real volume, and whether anyone in the BonkDAO conversation finally shows a governance fix rather than another retrospective. Check $BONK 's chart to see how the market is pricing that gap between a quiet tape and an unresolved past.
Not financial advice. DYOR.
$BONK is sitting at about $0.00000300, essentially flat over 24 hours, squeezed into a $0.00000295–$0.00000310 range. No catalyst. No panic. Just a coiled spring with a timer on it.
First, a warning before you scroll any further. Your feed may be showing a "$20M BONK treasury drained" headline this morning. That story is real — but it is from 6 July, not today. The live tape shows no crash: Kraken has BONK up about 0.1% over 24 hours, not down 7%. If someone is selling you panic about it today, they are selling you old news with a fresh timestamp.
So what is actually happening? A slow bleed of attention. BONK's week has been choppy, not trending: up to $0.00000336 on 23 October, then a 4.9% drop on Sunday, leaving the week roughly 2% net positive. CoinMarketCap's 25 October read put volume down about 36% to roughly $33M, with price below its 7-day and 30-day averages and RSI near 42. Traders are not piling in. They are waiting.
Here is the setup that matters. Support sits at $0.00000295 — today's low, defended so far — with $0.000002885 below it. Resistance is $0.00000310, the ceiling capping the last two days, then $0.00000316 and the 23 October high at $0.00000336. A break above $0.00000310 would be the first sign of stabilization. A break below $0.00000295 opens the lower end of the range.
And here is why this range deserves respect, not boredom. BONK still carries the heaviest governance scar of any major memecoin. On 6 July, an attacker spent about $4.4M buying just over 1% of supply, cleared a 1% quorum, and passed proposal BIP #76 — moving roughly 4.426 trillion BONK, about $20M at the time, out of the BonkDAO treasury. Seven wallets voted. There was no timelock, no veto, no bug. As Rekt put it: BonkDAO did not get robbed, it got outvoted. The attacker has never been identified, no recovery has been confirmed, Upbit delisted BONK in September, and as of mid-October analysts were still calling for governance reforms that have not been publicly confirmed. That overhang is why BONK rallies keep fading.
The macro backdrop does the rest. Bitcoin is under $80,000, more than $810M in crypto positions were liquidated in a day, and the Federal Open Market Committee decides on Wednesday, with September PCE data the day after. Memecoins are high-beta to that tape — when traders de-risk, memes fall first and fastest. And because BONK lives on Solana, $SOL sentiment is the weather vane: if Solana rotation stays risk-off into Wednesday, BONK's range breaks down, not up.
What I am watching: whether $0.00000295 holds into Wednesday, whether $0.00000310 gets reclaimed on real volume, and whether anyone in the BonkDAO conversation finally shows a governance fix rather than another retrospective. Check $BONK 's chart to see how the market is pricing that gap between a quiet tape and an unresolved past.
Not financial advice. DYOR.
58

·
--
💎 BINANCE GEMS | EARLY SPOT WATCH
Signal #76 · $XRP
Score: 48/100 | EARLY ENTRY
I've got $XRP on my radar because the setup may still be developing, rather than being a move I'd want to chase after a big candle.
Volume activity is one of the main things supporting this watch. There appears to be about 5.5% of room to the nearby resistance reference.
Price reference: $1.3201
24h change: -0.7% · 24h volume: $94.63M
Risk reference — SL: $1.3134995
Potential TP1: $1.3267005
Potential TP2: $1.3300007
Potential TP3: $1.333301
My plan: no chasing. I want the setup to hold, volume to stay healthy, and resistance to clear cleanly. If those conditions fail, I skip it.
This is a spot-market watchlist idea, not a guaranteed result. Manage risk and confirm the live chart before acting.
#BinanceGems #SpotTrading $XRP
💎 BINANCE GEMS | EARLY SPOT WATCH
Signal #76 · $XRP
Score: 48/100 | EARLY ENTRY
I've got $XRP on my radar because the setup may still be developing, rather than being a move I'd want to chase after a big candle.
Volume activity is one of the main things supporting this watch. There appears to be about 5.5% of room to the nearby resistance reference.
Price reference: $1.3201
24h change: -0.7% · 24h volume: $94.63M
Risk reference — SL: $1.3134995
Potential TP1: $1.3267005
Potential TP2: $1.3300007
Potential TP3: $1.333301
My plan: no chasing. I want the setup to hold, volume to stay healthy, and resistance to clear cleanly. If those conditions fail, I skip it.
This is a spot-market watchlist idea, not a guaranteed result. Manage risk and confirm the live chart before acting.
#BinanceGems #SpotTrading $XRP
Signal #76 · $XRP
Score: 48/100 | EARLY ENTRY
I've got $XRP on my radar because the setup may still be developing, rather than being a move I'd want to chase after a big candle.
Volume activity is one of the main things supporting this watch. There appears to be about 5.5% of room to the nearby resistance reference.
Price reference: $1.3201
24h change: -0.7% · 24h volume: $94.63M
Risk reference — SL: $1.3134995
Potential TP1: $1.3267005
Potential TP2: $1.3300007
Potential TP3: $1.333301
My plan: no chasing. I want the setup to hold, volume to stay healthy, and resistance to clear cleanly. If those conditions fail, I skip it.
This is a spot-market watchlist idea, not a guaranteed result. Manage risk and confirm the live chart before acting.
#BinanceGems #SpotTrading $XRP
1

·
--
We're excited to share the latest trending tokens with our community 🚀. According to CoinGecko, several tokens are making waves in the market.
We're seeing significant interest in tokens like Pump.fun (PUMP), Lorenzo Protocol (BANK), and Geodnet (GEOD), with market cap ranks #76, #192, and #202 respectively. Other notable mentions include Pons (PONS) and Pudgy Penguins (PENGU) with market cap ranks #452 and #110.
We believe these tokens are worth keeping an eye on, with potential for growth 💰. As our community continues to grow, we're committed to providing the latest updates and insights 📊. With this information, we're confident our users will make informed decisions 🚫.
$NIL, $PUMP, $BTW
We're excited to share the latest trending tokens with our community 🚀. According to CoinGecko, several tokens are making waves in the market.
We're seeing significant interest in tokens like Pump.fun (PUMP), Lorenzo Protocol (BANK), and Geodnet (GEOD), with market cap ranks #76, #192, and #202 respectively. Other notable mentions include Pons (PONS) and Pudgy Penguins (PENGU) with market cap ranks #452 and #110.
We believe these tokens are worth keeping an eye on, with potential for growth 💰. As our community continues to grow, we're committed to providing the latest updates and insights 📊. With this information, we're confident our users will make informed decisions 🚫.
$NIL , $PUMP , $BTW
We're seeing significant interest in tokens like Pump.fun (PUMP), Lorenzo Protocol (BANK), and Geodnet (GEOD), with market cap ranks #76, #192, and #202 respectively. Other notable mentions include Pons (PONS) and Pudgy Penguins (PENGU) with market cap ranks #452 and #110.
We believe these tokens are worth keeping an eye on, with potential for growth 💰. As our community continues to grow, we're committed to providing the latest updates and insights 📊. With this information, we're confident our users will make informed decisions 🚫.
$NIL , $PUMP , $BTW
194


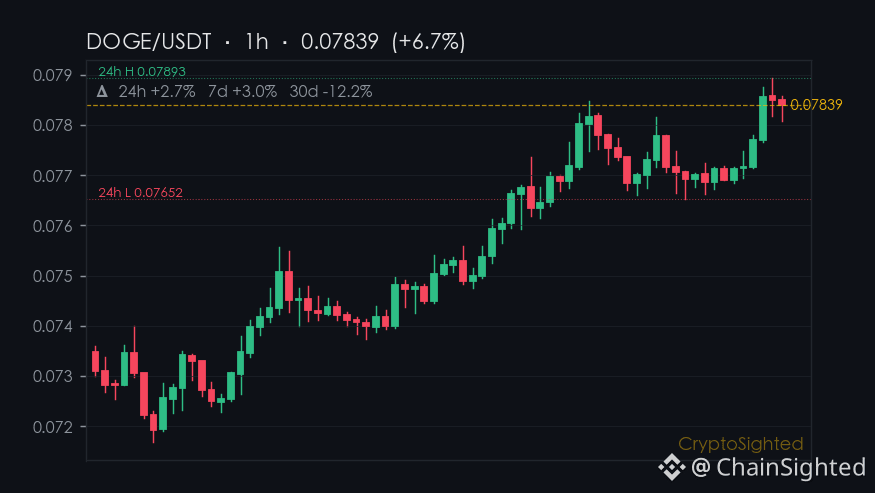
$DOGE is trading at $0.07838, up 2.28% in the last 24 hours - but that’s not the story. What’s striking is the 523, 744, 345 DOGE volume, a number that suggests something bigger is moving.
DOGE is sitting in a tight range, with its 7-day gain of 5.9% contrasting sharply with its 30-day loss of 3.8%. That’s a classic sign of short-term buying, not long-term conviction. And while $ADA is up 11.65% in 24 hours, DOGE’s volume is over 1.5 times higher - a clear indicator of where the action is.
The question is: is this just noise, or is DOGE setting up for a move?
Defense or offense - one word.
—
Not financial advice. Crypto assets are high-risk; do your own research.
📌 Hotspot Watch · #76
#CryptoTrends #CryptoSighted $DOGE
$DOGE is trading at $0.07838, up 2.28% in the last 24 hours - but that’s not the story. What’s striking is the 523, 744, 345 DOGE volume, a number that suggests something bigger is moving.
DOGE is sitting in a tight range, with its 7-day gain of 5.9% contrasting sharply with its 30-day loss of 3.8%. That’s a classic sign of short-term buying, not long-term conviction. And while $ADA is up 11.65% in 24 hours, DOGE’s volume is over 1.5 times higher - a clear indicator of where the action is.
The question is: is this just noise, or is DOGE setting up for a move?
Defense or offense - one word.
—
Not financial advice. Crypto assets are high-risk; do your own research.
📌 Hotspot Watch · #76
#CryptoTrends #CryptoSighted $DOGE
DOGE is sitting in a tight range, with its 7-day gain of 5.9% contrasting sharply with its 30-day loss of 3.8%. That’s a classic sign of short-term buying, not long-term conviction. And while $ADA is up 11.65% in 24 hours, DOGE’s volume is over 1.5 times higher - a clear indicator of where the action is.
The question is: is this just noise, or is DOGE setting up for a move?
Defense or offense - one word.
—
Not financial advice. Crypto assets are high-risk; do your own research.
📌 Hotspot Watch · #76
#CryptoTrends #CryptoSighted $DOGE
85

·
--
I tend to treat the $JUP segment as bottom-structure repair rather than a fresh narrative restart. This intuition is verified by three things: whether volume can hold above 90M, whether buy-side demand remains when it retraces to 0.30, and whether after 7 days plus a 24.56% move there is new spot capital stepping in to take over. At the moment, only the second condition is barely met.
Over 30 days, it moved from 0.221 to 0.3367. The 215M volume candle on September 7 was a pulse; afterward, price pulled back to 0.216. The real lift began after September 18—0.2377, 0.2655, 0.2816, 0.299—rising step by step. This stair-step advance is more convincing than a single-day blow-off. But on September 26, when it surged to 0.3414, volume was 125M; then it shrank to 91M and 71.88M over the next two days. Price stayed flat around 0.336, down 3.96% in 24 hours. After the spike, nobody stepped in.
A market cap of 1.12B, rank #76, and still -83.16% from ATH—these three numbers determine its situation: it’s not an alpha that nobody knows, and it hasn’t been priced in enough. A 1-year return of -23.71% means most of the people who entered over the past year are still underwater; this batch of coins is potential overhead selling pressure.
The invalidation conditions are not ambiguous: if volume drops back below 60M, or if price breaks below 0.30 and can’t get back above it, then this bottom-raising interpretation doesn’t hold—it’s just a range rebound. No need to rush to pick a side; just watch how volume returns in the 0.30 area—that’s enough.
I tend to treat the $JUP segment as bottom-structure repair rather than a fresh narrative restart. This intuition is verified by three things: whether volume can hold above 90M, whether buy-side demand remains when it retraces to 0.30, and whether after 7 days plus a 24.56% move there is new spot capital stepping in to take over. At the moment, only the second condition is barely met.
Over 30 days, it moved from 0.221 to 0.3367. The 215M volume candle on September 7 was a pulse; afterward, price pulled back to 0.216. The real lift began after September 18—0.2377, 0.2655, 0.2816, 0.299—rising step by step. This stair-step advance is more convincing than a single-day blow-off. But on September 26, when it surged to 0.3414, volume was 125M; then it shrank to 91M and 71.88M over the next two days. Price stayed flat around 0.336, down 3.96% in 24 hours. After the spike, nobody stepped in.
A market cap of 1.12B, rank #76, and still -83.16% from ATH—these three numbers determine its situation: it’s not an alpha that nobody knows, and it hasn’t been priced in enough. A 1-year return of -23.71% means most of the people who entered over the past year are still underwater; this batch of coins is potential overhead selling pressure.
The invalidation conditions are not ambiguous: if volume drops back below 60M, or if price breaks below 0.30 and can’t get back above it, then this bottom-raising interpretation doesn’t hold—it’s just a range rebound. No need to rush to pick a side; just watch how volume returns in the 0.30 area—that’s enough.
Over 30 days, it moved from 0.221 to 0.3367. The 215M volume candle on September 7 was a pulse; afterward, price pulled back to 0.216. The real lift began after September 18—0.2377, 0.2655, 0.2816, 0.299—rising step by step. This stair-step advance is more convincing than a single-day blow-off. But on September 26, when it surged to 0.3414, volume was 125M; then it shrank to 91M and 71.88M over the next two days. Price stayed flat around 0.336, down 3.96% in 24 hours. After the spike, nobody stepped in.
A market cap of 1.12B, rank #76, and still -83.16% from ATH—these three numbers determine its situation: it’s not an alpha that nobody knows, and it hasn’t been priced in enough. A 1-year return of -23.71% means most of the people who entered over the past year are still underwater; this batch of coins is potential overhead selling pressure.
The invalidation conditions are not ambiguous: if volume drops back below 60M, or if price breaks below 0.30 and can’t get back above it, then this bottom-raising interpretation doesn’t hold—it’s just a range rebound. No need to rush to pick a side; just watch how volume returns in the 0.30 area—that’s enough.
19

Article
$PI -12.1% in 24h — crashed the most in the top-100!😱 $PI -12.1% in 24h — crashed the most in the top-100!
Day breakdown — short and to the point.
🧭 Result: movement within the broader trend — 7D and 30D in the same direction; volume is low — the move may be unstable.
🌍 Market context: out of 69 large coins with notable movement in the last 24h — 🔼 12 increased, 🔽 57 decreased
$PI -12.1% in 24h — crashed the most in the top-100!
😱 $PI -12.1% in 24h — crashed the most in the top-100!
Day breakdown — short and to the point.
🧭 Result: movement within the broader trend — 7D and 30D in the same direction; volume is low — the move may be unstable.
🌍 Market context: out of 69 large coins with notable movement in the last 24h — 🔼 12 increased, 🔽 57 decreased
Day breakdown — short and to the point.
🧭 Result: movement within the broader trend — 7D and 30D in the same direction; volume is low — the move may be unstable.
🌍 Market context: out of 69 large coins with notable movement in the last 24h — 🔼 12 increased, 🔽 57 decreased
641

·
--
BonkDAO Treasury Targeted by Malicious Governance Proposal Attack @bonk_inu
A proposal called Sowellian BonkDAO—corresponding to Bonk Improvement Proposal #76 —was packaged as a governance reform plan. It proposed replacing members and the committees, rebuilding the DAO, reactivating assets, and also promised to distribute BONK rewards to addresses that vote in favor.
After the proposal passed, about 44 trillion BONK were transferred out of the BonkDAO treasury, valued at roughly $19.3 million to $20 million at the time. The funds flowed to a wallet ending with JHvQ. On-chain tracking shows that this address had previously received financial support from a Bybit account. Later the same day, these tokens were transferred again to another Solana address ending with eh42. As of now, the BONK rewards that were promised to the participants who voted in favor have not been actually distributed.
The attackers did not crack private keys or exploit any disclosed contract vulnerabilities. The attack path occurred at the governance layer. The attackers first accumulated BONK holdings and voting power in advance using multiple exchange wallets, then submitted a proposal with high-risk execution permissions into the governance process at BonkDAO. BonkDAO later confirmed the details and identified the portions of exchange wallets that had been used to buy BONK before the proposal. External on-chain analysts previously estimated that to obtain enough voting power, the attacker may have spent only around $4 million worth of BONK, yet ultimately drained nearly $20 million from the treasury.
Once the news spread, BONK fell by nearly 10%. Upbit immediately paused BONK deposits and withdrawals, and Kraken also took similar measures. The core goal was to prevent the attacker from moving the stolen funds into centralized platforms and converting them into stablecoins or fiat. BonkDAO has notified law enforcement agencies and is working with exchanges, cross-chain bridges, and the Solana Foundation to track the funds, seek freezes, and recover assets
BonkDAO Treasury Targeted by Malicious Governance Proposal Attack @bonk_inu
A proposal called Sowellian BonkDAO—corresponding to Bonk Improvement Proposal #76 —was packaged as a governance reform plan. It proposed replacing members and the committees, rebuilding the DAO, reactivating assets, and also promised to distribute BONK rewards to addresses that vote in favor.
After the proposal passed, about 44 trillion BONK were transferred out of the BonkDAO treasury, valued at roughly $19.3 million to $20 million at the time. The funds flowed to a wallet ending with JHvQ. On-chain tracking shows that this address had previously received financial support from a Bybit account. Later the same day, these tokens were transferred again to another Solana address ending with eh42. As of now, the BONK rewards that were promised to the participants who voted in favor have not been actually distributed.
The attackers did not crack private keys or exploit any disclosed contract vulnerabilities. The attack path occurred at the governance layer. The attackers first accumulated BONK holdings and voting power in advance using multiple exchange wallets, then submitted a proposal with high-risk execution permissions into the governance process at BonkDAO. BonkDAO later confirmed the details and identified the portions of exchange wallets that had been used to buy BONK before the proposal. External on-chain analysts previously estimated that to obtain enough voting power, the attacker may have spent only around $4 million worth of BONK, yet ultimately drained nearly $20 million from the treasury.
Once the news spread, BONK fell by nearly 10%. Upbit immediately paused BONK deposits and withdrawals, and Kraken also took similar measures. The core goal was to prevent the attacker from moving the stolen funds into centralized platforms and converting them into stablecoins or fiat. BonkDAO has notified law enforcement agencies and is working with exchanges, cross-chain bridges, and the Solana Foundation to track the funds, seek freezes, and recover assets
A proposal called Sowellian BonkDAO—corresponding to Bonk Improvement Proposal #76 —was packaged as a governance reform plan. It proposed replacing members and the committees, rebuilding the DAO, reactivating assets, and also promised to distribute BONK rewards to addresses that vote in favor.
After the proposal passed, about 44 trillion BONK were transferred out of the BonkDAO treasury, valued at roughly $19.3 million to $20 million at the time. The funds flowed to a wallet ending with JHvQ. On-chain tracking shows that this address had previously received financial support from a Bybit account. Later the same day, these tokens were transferred again to another Solana address ending with eh42. As of now, the BONK rewards that were promised to the participants who voted in favor have not been actually distributed.
The attackers did not crack private keys or exploit any disclosed contract vulnerabilities. The attack path occurred at the governance layer. The attackers first accumulated BONK holdings and voting power in advance using multiple exchange wallets, then submitted a proposal with high-risk execution permissions into the governance process at BonkDAO. BonkDAO later confirmed the details and identified the portions of exchange wallets that had been used to buy BONK before the proposal. External on-chain analysts previously estimated that to obtain enough voting power, the attacker may have spent only around $4 million worth of BONK, yet ultimately drained nearly $20 million from the treasury.
Once the news spread, BONK fell by nearly 10%. Upbit immediately paused BONK deposits and withdrawals, and Kraken also took similar measures. The core goal was to prevent the attacker from moving the stolen funds into centralized platforms and converting them into stablecoins or fiat. BonkDAO has notified law enforcement agencies and is working with exchanges, cross-chain bridges, and the Solana Foundation to track the funds, seek freezes, and recover assets
287

·
--
How to Read Daily Price Movements and Make Fast Trades? – & Sample Practical GuideArbitrum (ARBUSDT) is trending right now!
Rank: #76
🚀 **Step 1: Prioritize Checking the Daily Data** - On Binance Square, from the “Markets” tab, observe the and its 24-hour change and volume. - **Today’s data (03‑09‑2026):** - : **0,958.55** ↑%4.71 | Volume **2.95B** - : **,501.75** ↑%4.50 | Volume **5.65B** - **Why is it important?** A positive % change along with high volume is considered a strong momentum signal; it may be a short-term buying opportunity. 📊 **Step 2: Analyze the Volume-Price Relationship** - If the price is rising and volume is also increasing → **Real buying pressure** (bullish). - If the price is rising but volume is decreasing → **Weak momentum**, with a risk of correction. - **Practical:** Observe the strong buying signal by looking together at ’s 4.71% increase and the 2.95B volume. 🎯 **Step 3: Identify Short-Term Entry and Exit Points** 1. **Entry:** If you see a “bullish engulfing” or “hammer” pattern above the daily opening, place a limit order 0.5–1% above that candle’s closing price. - Example: 80,958 → place a buy order in the 81,300–81,500 range. 2. **Stop-Loss:** Place it below the recent swing low of the entry price (e.g., 9,800) or at the 2% risk level. 3. **Take-Profit:** Aim for a 1:2 risk-reward ratio → target a 4–6% profit from entry (≈ 4,200–5,800). 🔍 **Step 4: Use Chart Pattern Clues** - **Ascending Triangle:** Horizontal resistance + rising support → expectation of an upward breakout. - **Bullish Flag:** A short correction flag after a strong directional impulse → expect continuation on the breakout. - **Right now:** 4-hour
How to Read Daily Price Movements and Make Fast Trades? – & Sample Practical Guide
Arbitrum (ARBUSDT) is trending right now!
Rank: #76
🚀 **Step 1: Prioritize Checking the Daily Data** - On Binance Square, from the “Markets” tab, observe the and its 24-hour change and volume. - **Today’s data (03‑09‑2026):** - : **0,958.55** ↑%4.71 | Volume **2.95B** - : **,501.75** ↑%4.50 | Volume **5.65B** - **Why is it important?** A positive % change along with high volume is considered a strong momentum signal; it may be a short-term buying opportunity. 📊 **Step 2: Analyze the Volume-Price Relationship** - If the price is rising and volume is also increasing → **Real buying pressure** (bullish). - If the price is rising but volume is decreasing → **Weak momentum**, with a risk of correction. - **Practical:** Observe the strong buying signal by looking together at ’s 4.71% increase and the 2.95B volume. 🎯 **Step 3: Identify Short-Term Entry and Exit Points** 1. **Entry:** If you see a “bullish engulfing” or “hammer” pattern above the daily opening, place a limit order 0.5–1% above that candle’s closing price. - Example: 80,958 → place a buy order in the 81,300–81,500 range. 2. **Stop-Loss:** Place it below the recent swing low of the entry price (e.g., 9,800) or at the 2% risk level. 3. **Take-Profit:** Aim for a 1:2 risk-reward ratio → target a 4–6% profit from entry (≈ 4,200–5,800). 🔍 **Step 4: Use Chart Pattern Clues** - **Ascending Triangle:** Horizontal resistance + rising support → expectation of an upward breakout. - **Bullish Flag:** A short correction flag after a strong directional impulse → expect continuation on the breakout. - **Right now:** 4-hour
Rank: #76
🚀 **Step 1: Prioritize Checking the Daily Data** - On Binance Square, from the “Markets” tab, observe the and its 24-hour change and volume. - **Today’s data (03‑09‑2026):** - : **0,958.55** ↑%4.71 | Volume **2.95B** - : **,501.75** ↑%4.50 | Volume **5.65B** - **Why is it important?** A positive % change along with high volume is considered a strong momentum signal; it may be a short-term buying opportunity. 📊 **Step 2: Analyze the Volume-Price Relationship** - If the price is rising and volume is also increasing → **Real buying pressure** (bullish). - If the price is rising but volume is decreasing → **Weak momentum**, with a risk of correction. - **Practical:** Observe the strong buying signal by looking together at ’s 4.71% increase and the 2.95B volume. 🎯 **Step 3: Identify Short-Term Entry and Exit Points** 1. **Entry:** If you see a “bullish engulfing” or “hammer” pattern above the daily opening, place a limit order 0.5–1% above that candle’s closing price. - Example: 80,958 → place a buy order in the 81,300–81,500 range. 2. **Stop-Loss:** Place it below the recent swing low of the entry price (e.g., 9,800) or at the 2% risk level. 3. **Take-Profit:** Aim for a 1:2 risk-reward ratio → target a 4–6% profit from entry (≈ 4,200–5,800). 🔍 **Step 4: Use Chart Pattern Clues** - **Ascending Triangle:** Horizontal resistance + rising support → expectation of an upward breakout. - **Bullish Flag:** A short correction flag after a strong directional impulse → expect continuation on the breakout. - **Right now:** 4-hour
50

·
--
We need to explain why each coin might be trending, speculating based on rank/score.
Data: Pons (PONS): Rank #117, Score 0.0. Lil' Shrub (SHRUB): Rank #495, Score 1.0. Arbitrum (ARB): Rank #76, Score 2.0.
We need 150-200 words. Let's aim ~170 words.
Three sections, each maybe a paragraph. No markdown (so no bold, italics). Just plain text.
We need to include the hashtags at end.
Make sure final line is exactly the hashtags line.
We must not include any extra commentary.
Let's craft.
Word count: Let's count roughly.
Section 1: Pons (PONS) - maybe 50 words.
Section 2: Lil' Shrub (SHRUB) - maybe 50 words.
Section 3: Arbitrum (ARB) - maybe 50 words.
Then the ending sentence and hashtags.
Total maybe 170.
Let's write.
Count words manually.
We'll write:
"Pons (PONS) sits at rank 117 with a score of 0.0, suggesting low current momentum. However, its presence in the top 120 could indicate early accumulation by niche communities or a recent listing on a minor exchange, sparking speculative interest among traders looking for hidden gems."
Count words: Pons(1) (PONS)2 sits3 at4 rank5 117
We need to explain why each coin might be trending, speculating based on rank/score.
Data: Pons (PONS): Rank #117, Score 0.0. Lil' Shrub (SHRUB): Rank #495, Score 1.0. Arbitrum (ARB): Rank #76, Score 2.0.
We need 150-200 words. Let's aim ~170 words.
Three sections, each maybe a paragraph. No markdown (so no bold, italics). Just plain text.
We need to include the hashtags at end.
Make sure final line is exactly the hashtags line.
We must not include any extra commentary.
Let's craft.
Word count: Let's count roughly.
Section 1: Pons (PONS) - maybe 50 words.
Section 2: Lil' Shrub (SHRUB) - maybe 50 words.
Section 3: Arbitrum (ARB) - maybe 50 words.
Then the ending sentence and hashtags.
Total maybe 170.
Let's write.
Count words manually.
We'll write:
"Pons (PONS) sits at rank 117 with a score of 0.0, suggesting low current momentum. However, its presence in the top 120 could indicate early accumulation by niche communities or a recent listing on a minor exchange, sparking speculative interest among traders looking for hidden gems."
Count words: Pons(1) (PONS)2 sits3 at4 rank5 117
Data: Pons (PONS): Rank #117, Score 0.0. Lil' Shrub (SHRUB): Rank #495, Score 1.0. Arbitrum (ARB): Rank #76, Score 2.0.
We need 150-200 words. Let's aim ~170 words.
Three sections, each maybe a paragraph. No markdown (so no bold, italics). Just plain text.
We need to include the hashtags at end.
Make sure final line is exactly the hashtags line.
We must not include any extra commentary.
Let's craft.
Word count: Let's count roughly.
Section 1: Pons (PONS) - maybe 50 words.
Section 2: Lil' Shrub (SHRUB) - maybe 50 words.
Section 3: Arbitrum (ARB) - maybe 50 words.
Then the ending sentence and hashtags.
Total maybe 170.
Let's write.
Count words manually.
We'll write:
"Pons (PONS) sits at rank 117 with a score of 0.0, suggesting low current momentum. However, its presence in the top 120 could indicate early accumulation by niche communities or a recent listing on a minor exchange, sparking speculative interest among traders looking for hidden gems."
Count words: Pons(1) (PONS)2 sits3 at4 rank5 117
60

#76 WHAT IS YOUR GREATEST WEAPON ?
#DayTradingStrategy
#HODLTradingStrategy
#BTCWhaleMovement
#NFPWatch
$BNB
$BTC
$SOL
#76 WHAT IS YOUR GREATEST WEAPON ?
#DayTradingStrategy
#HODLTradingStrategy
#BTCWhaleMovement
#NFPWatch
$BNB
$BTC
$SOL
#DayTradingStrategy
#HODLTradingStrategy
#BTCWhaleMovement
#NFPWatch
$BNB
$BTC
$SOL

2.7k
1.3k
220
2.7k

·
--
Contract Quantitative Brief #76 | Today, just focus on these two, don’t chase the third one
Market Status:
The trend is still intact, funding rates are generally manageable, prioritize targets where the trend hasn’t broken and the pullback isn’t deep.
Top Candidates:
1) ALLOUSDT
Reason for Selection: The price surge and trading volume are solid, strong short-term continuation, funding rate is neutral, indicating it's not a purely crowded long.
Watch Level: Can it hold near the 20-day line after a pullback?
Trigger Condition: Regain stability and increase volume, continue the upward move.
Invalidation Condition: Break below the pullback low and weaken with high volume.
2) STGUSDT
Reason for Selection: The 1-hour chart and trading volume are still holding, open interest (OI) is rising as well, indicating there’s still capital willing to take over.
Watch Level: Can it hold around 0.26?
Trigger Condition: Stabilize and continue to rise.
Invalidation Condition: Surge fails to continue and falls back below the watch level.
Backup Observation/Not Chasing:
VELVETUSDT feels more like a pullback after an emotional spike; there’s strength, but it’s not a comfortable chase for long positions.
Risk Warning:
The biggest fear in short-term trading is a sudden volume spike after a strong consensus, especially if you're chasing during an acceleration phase; the margin for error will be very tight.
In Summary:
I will focus on ALLOUSDT and STGUSDT first, the third one is just for observation, I’ll wait for confirmation before making a move.
Contract Quantitative Brief #76 | Today, just focus on these two, don’t chase the third one
Market Status:
The trend is still intact, funding rates are generally manageable, prioritize targets where the trend hasn’t broken and the pullback isn’t deep.
Top Candidates:
1) ALLOUSDT
Reason for Selection: The price surge and trading volume are solid, strong short-term continuation, funding rate is neutral, indicating it's not a purely crowded long.
Watch Level: Can it hold near the 20-day line after a pullback?
Trigger Condition: Regain stability and increase volume, continue the upward move.
Invalidation Condition: Break below the pullback low and weaken with high volume.
2) STGUSDT
Reason for Selection: The 1-hour chart and trading volume are still holding, open interest (OI) is rising as well, indicating there’s still capital willing to take over.
Watch Level: Can it hold around 0.26?
Trigger Condition: Stabilize and continue to rise.
Invalidation Condition: Surge fails to continue and falls back below the watch level.
Backup Observation/Not Chasing:
VELVETUSDT feels more like a pullback after an emotional spike; there’s strength, but it’s not a comfortable chase for long positions.
Risk Warning:
The biggest fear in short-term trading is a sudden volume spike after a strong consensus, especially if you're chasing during an acceleration phase; the margin for error will be very tight.
In Summary:
I will focus on ALLOUSDT and STGUSDT first, the third one is just for observation, I’ll wait for confirmation before making a move.
Market Status:
The trend is still intact, funding rates are generally manageable, prioritize targets where the trend hasn’t broken and the pullback isn’t deep.
Top Candidates:
1) ALLOUSDT
Reason for Selection: The price surge and trading volume are solid, strong short-term continuation, funding rate is neutral, indicating it's not a purely crowded long.
Watch Level: Can it hold near the 20-day line after a pullback?
Trigger Condition: Regain stability and increase volume, continue the upward move.
Invalidation Condition: Break below the pullback low and weaken with high volume.
2) STGUSDT
Reason for Selection: The 1-hour chart and trading volume are still holding, open interest (OI) is rising as well, indicating there’s still capital willing to take over.
Watch Level: Can it hold around 0.26?
Trigger Condition: Stabilize and continue to rise.
Invalidation Condition: Surge fails to continue and falls back below the watch level.
Backup Observation/Not Chasing:
VELVETUSDT feels more like a pullback after an emotional spike; there’s strength, but it’s not a comfortable chase for long positions.
Risk Warning:
The biggest fear in short-term trading is a sudden volume spike after a strong consensus, especially if you're chasing during an acceleration phase; the margin for error will be very tight.
In Summary:
I will focus on ALLOUSDT and STGUSDT first, the third one is just for observation, I’ll wait for confirmation before making a move.
612
·
--
We're excited to share the latest trending tokens with our community. According to CoinGecko, top tokens like Bitcoin (BTC) and Ethereum (ETH) are making waves 🚀.
We're seeing a mix of established and emerging tokens on the list, including Solana (SOL) and Zcash (ZEC). Other notable mentions are NEAR Protocol (NEAR) and Bittensor (TAO), which are gaining traction. Venice Token (VVV) is also on the rise, with a market cap rank of #76.
We're committed to keeping our community informed about the latest market trends 💡. With so many exciting tokens to choose from, we're confident that our users will find opportunities that align with their investment goals 📈. We're looking forward to seeing how these tokens perform in the future 👍
$BABY, $ALLO, $CLO
We're excited to share the latest trending tokens with our community. According to CoinGecko, top tokens like Bitcoin (BTC) and Ethereum (ETH) are making waves 🚀.
We're seeing a mix of established and emerging tokens on the list, including Solana (SOL) and Zcash (ZEC). Other notable mentions are NEAR Protocol (NEAR) and Bittensor (TAO), which are gaining traction. Venice Token (VVV) is also on the rise, with a market cap rank of #76.
We're committed to keeping our community informed about the latest market trends 💡. With so many exciting tokens to choose from, we're confident that our users will find opportunities that align with their investment goals 📈. We're looking forward to seeing how these tokens perform in the future 👍
$BABY , $ALLO , $CLO
We're seeing a mix of established and emerging tokens on the list, including Solana (SOL) and Zcash (ZEC). Other notable mentions are NEAR Protocol (NEAR) and Bittensor (TAO), which are gaining traction. Venice Token (VVV) is also on the rise, with a market cap rank of #76.
We're committed to keeping our community informed about the latest market trends 💡. With so many exciting tokens to choose from, we're confident that our users will find opportunities that align with their investment goals 📈. We're looking forward to seeing how these tokens perform in the future 👍
$BABY , $ALLO , $CLO
4
·
--
Watching $ADI surge from $4 to $6.3, a 58% gain over 30 days—only to dip back for 3 more days now. The hardest part for people watching from the sidelines is this: chasing means risking being trapped in the middle of the pullback; not chasing means it might grind its way toward a new ATH of $8.
The actual market picture isn’t that complicated. It’s down 3.35% over 7 days, and another 3.68% in the last 24 hours. Volume has stayed steady at around 5–6M. There’s no panic selling and no obvious surge in buy orders. For the rally from 4.0 to 7.0, there hasn’t been sustained volume expansion accompanying the move—more like a natural cooldown after an uptrend with reduced volume. What I care about most is that it’s still 22% away from the ATH. It ranks #76 by market cap, but daily trading volume is only about 0.7% of its market cap. That level of trading activity can’t support a rapid breakout above the prior high. If it wants to return to an uptrend, it likely needs at least volume above 10M and to hold steady above $6.5. Otherwise, the current position looks more like a “too much of a run, time to rest” range where both bulls and bears are waiting for signals.
What sidelined participants need to confirm now isn’t “can it still go up,” but “if it pulls back, will you buy at a lower price?” The cost of chasing is the possibility of another 5–10% drop to $5.7–5.8. The cost of not chasing is that if it launches a second upswing, the feeling of missing out doubles. If the pullback doesn’t break below $5.8 and volume picks back up, that’s the relatively safer spot to test a position.
Final multiple-choice question: If you’re entering with a light position now, would you rather probe with a small trade around $6.3 with a set stop-loss—or wait until the $5.8–5.9 area before considering entry?
Watching $ADI surge from $4 to $6.3, a 58% gain over 30 days—only to dip back for 3 more days now. The hardest part for people watching from the sidelines is this: chasing means risking being trapped in the middle of the pullback; not chasing means it might grind its way toward a new ATH of $8.
The actual market picture isn’t that complicated. It’s down 3.35% over 7 days, and another 3.68% in the last 24 hours. Volume has stayed steady at around 5–6M. There’s no panic selling and no obvious surge in buy orders. For the rally from 4.0 to 7.0, there hasn’t been sustained volume expansion accompanying the move—more like a natural cooldown after an uptrend with reduced volume. What I care about most is that it’s still 22% away from the ATH. It ranks #76 by market cap, but daily trading volume is only about 0.7% of its market cap. That level of trading activity can’t support a rapid breakout above the prior high. If it wants to return to an uptrend, it likely needs at least volume above 10M and to hold steady above $6.5. Otherwise, the current position looks more like a “too much of a run, time to rest” range where both bulls and bears are waiting for signals.
What sidelined participants need to confirm now isn’t “can it still go up,” but “if it pulls back, will you buy at a lower price?” The cost of chasing is the possibility of another 5–10% drop to $5.7–5.8. The cost of not chasing is that if it launches a second upswing, the feeling of missing out doubles. If the pullback doesn’t break below $5.8 and volume picks back up, that’s the relatively safer spot to test a position.
Final multiple-choice question: If you’re entering with a light position now, would you rather probe with a small trade around $6.3 with a set stop-loss—or wait until the $5.8–5.9 area before considering entry?
The actual market picture isn’t that complicated. It’s down 3.35% over 7 days, and another 3.68% in the last 24 hours. Volume has stayed steady at around 5–6M. There’s no panic selling and no obvious surge in buy orders. For the rally from 4.0 to 7.0, there hasn’t been sustained volume expansion accompanying the move—more like a natural cooldown after an uptrend with reduced volume. What I care about most is that it’s still 22% away from the ATH. It ranks #76 by market cap, but daily trading volume is only about 0.7% of its market cap. That level of trading activity can’t support a rapid breakout above the prior high. If it wants to return to an uptrend, it likely needs at least volume above 10M and to hold steady above $6.5. Otherwise, the current position looks more like a “too much of a run, time to rest” range where both bulls and bears are waiting for signals.
What sidelined participants need to confirm now isn’t “can it still go up,” but “if it pulls back, will you buy at a lower price?” The cost of chasing is the possibility of another 5–10% drop to $5.7–5.8. The cost of not chasing is that if it launches a second upswing, the feeling of missing out doubles. If the pullback doesn’t break below $5.8 and volume picks back up, that’s the relatively safer spot to test a position.
Final multiple-choice question: If you’re entering with a light position now, would you rather probe with a small trade around $6.3 with a set stop-loss—or wait until the $5.8–5.9 area before considering entry?
7
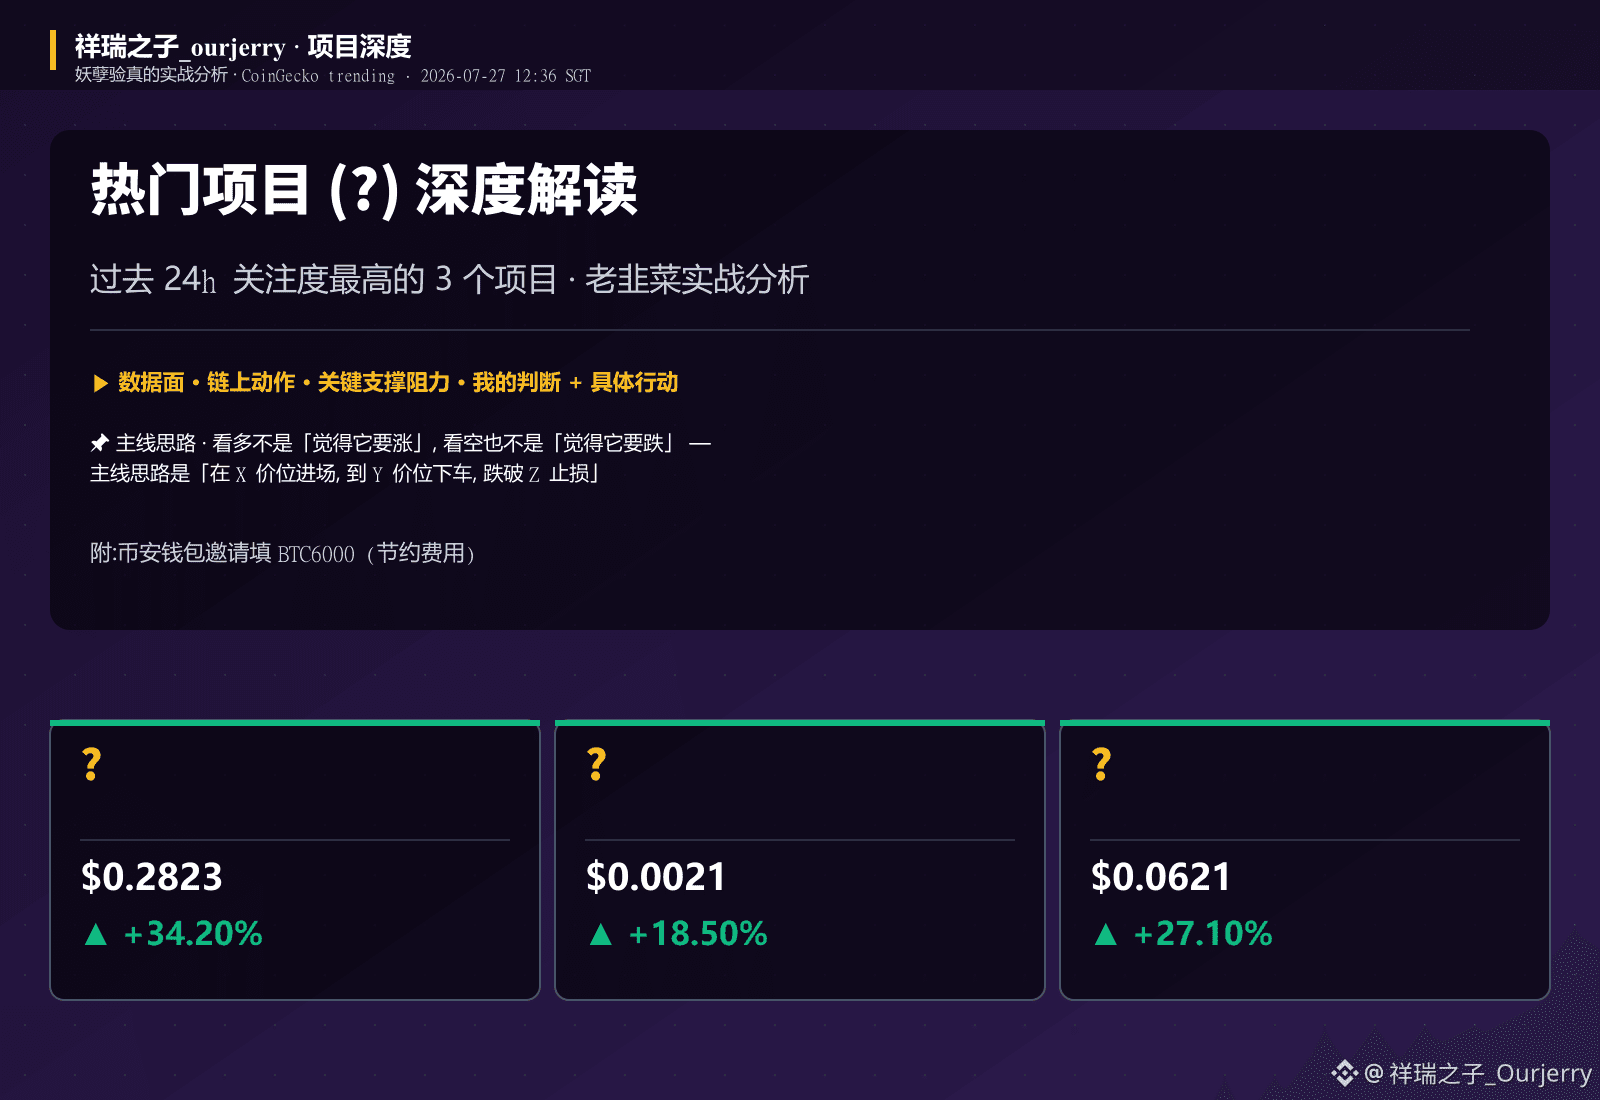
Article
⚖️ Overall Overview⚖️ Overall Overview
I just checked CoinGecko’s trending leaderboard for the past 24 hours. Out of the top 6, I picked 3 that are most worth breaking down: Geodnet (GEOD), Pump.fun (PUMP), and Pudgy Penguins (PENGU). Plainly put, this leaderboard is essentially a snapshot of “capital flow to sector sentiment.” GEOD is up 34.2% in 24h, PUMP is up 18.5%, and PENGU is basically flat over 24h yet still holds steady in the top 5. Together, they cover three completely different tracks: DePIN decentralized physical infrastructure, the Solana meme launchpad, and the IP brand NFT scene. Let’s dig into each one, step by step.
⚖️ Overall Overview
⚖️ Overall Overview
I just checked CoinGecko’s trending leaderboard for the past 24 hours. Out of the top 6, I picked 3 that are most worth breaking down: Geodnet (GEOD), Pump.fun (PUMP), and Pudgy Penguins (PENGU). Plainly put, this leaderboard is essentially a snapshot of “capital flow to sector sentiment.” GEOD is up 34.2% in 24h, PUMP is up 18.5%, and PENGU is basically flat over 24h yet still holds steady in the top 5. Together, they cover three completely different tracks: DePIN decentralized physical infrastructure, the Solana meme launchpad, and the IP brand NFT scene. Let’s dig into each one, step by step.
I just checked CoinGecko’s trending leaderboard for the past 24 hours. Out of the top 6, I picked 3 that are most worth breaking down: Geodnet (GEOD), Pump.fun (PUMP), and Pudgy Penguins (PENGU). Plainly put, this leaderboard is essentially a snapshot of “capital flow to sector sentiment.” GEOD is up 34.2% in 24h, PUMP is up 18.5%, and PENGU is basically flat over 24h yet still holds steady in the top 5. Together, they cover three completely different tracks: DePIN decentralized physical infrastructure, the Solana meme launchpad, and the IP brand NFT scene. Let’s dig into each one, step by step.
200
↑0.74% - that’s the daily gain for $ETH.
ETH is sitting at $1,868.13, up 0.74% in the last 24 hours.
But the bigger story isn’t just the price - it’s what’s happening beneath the surface.
This move comes as Binance announces new futures contracts and tokenized securities.
The news is out, and the market is reacting - but not with the kind of frenzy you’d expect.
ETH’s 24-hour volume stands at 123,267 ETH, and its 7-day price change is ↑0.5%, while its 30-day gain is ↑19.1%.
That’s a clear divergence: long-term momentum is still intact, but the short-term action is muffled.
—
Not financial advice. DYOR.
📌 Gainers Radar · #76 · #Gainers #CryptoSighted $ETH
↑0.74% - that’s the daily gain for $ETH .
ETH is sitting at $1,868.13, up 0.74% in the last 24 hours.
But the bigger story isn’t just the price - it’s what’s happening beneath the surface.
This move comes as Binance announces new futures contracts and tokenized securities.
The news is out, and the market is reacting - but not with the kind of frenzy you’d expect.
ETH’s 24-hour volume stands at 123,267 ETH, and its 7-day price change is ↑0.5%, while its 30-day gain is ↑19.1%.
That’s a clear divergence: long-term momentum is still intact, but the short-term action is muffled.
—
Not financial advice. DYOR.
📌 Gainers Radar · #76 · #Gainers #CryptoSighted $ETH
ETH is sitting at $1,868.13, up 0.74% in the last 24 hours.
But the bigger story isn’t just the price - it’s what’s happening beneath the surface.
This move comes as Binance announces new futures contracts and tokenized securities.
The news is out, and the market is reacting - but not with the kind of frenzy you’d expect.
ETH’s 24-hour volume stands at 123,267 ETH, and its 7-day price change is ↑0.5%, while its 30-day gain is ↑19.1%.
That’s a clear divergence: long-term momentum is still intact, but the short-term action is muffled.
—
Not financial advice. DYOR.
📌 Gainers Radar · #76 · #Gainers #CryptoSighted $ETH
222
·
--
$JUP is currently in a fairly clear rebound phase: 30-day +50.63%, 7-day +24.65%, and the price is still rising today. But what stands out more is the massive bullish candle on September 7—$215M in volume, lifting the price from $0.22 to above $0.27. After that, the following days saw shrinking volume as it drifted upward slowly. This doesn’t look like a one-and-done impulse that quickly fizzles out; it looks more like a bottom that’s been accumulating repeatedly, with the “steps” gradually rising.
The 30-day gain is 50%, and it’s still -83.60% away from the ATH. The market cap has returned to #76 at $1.09B, as the market is re-pricing the “ecosystem entry point.” The real test is consistency: over the past few days, price action has been converging, and volume has hovered around $90M–$110M. Turnover is fairly active, but there isn’t yet solid evidence of fresh incremental inflows.
Right now, attention is on the dense traded zone at $0.29–$0.30. If $JUP breaks above $0.33 on expanding volume, the next target will be the market structure around $0.35. If it instead falls back below $0.29, the capital that built positions near $0.22 will first lock in profits, and this rebound may again return to a “wait-and-see” configuration.
Can this kind of bottom-up lifting trend attract a sufficiently large-scale ecosystem buyer to carry the momentum forward—not just capital chasing Solana ecosystem optimism? If price fluctuations can’t be translated into a synchronized push toward real utility, then every subsequent surge in volume after $0.35 could turn into yet another high-level rotation, pushing the price back to the starting point.
$JUP is currently in a fairly clear rebound phase: 30-day +50.63%, 7-day +24.65%, and the price is still rising today. But what stands out more is the massive bullish candle on September 7—$215M in volume, lifting the price from $0.22 to above $0.27. After that, the following days saw shrinking volume as it drifted upward slowly. This doesn’t look like a one-and-done impulse that quickly fizzles out; it looks more like a bottom that’s been accumulating repeatedly, with the “steps” gradually rising.
The 30-day gain is 50%, and it’s still -83.60% away from the ATH. The market cap has returned to #76 at $1.09B, as the market is re-pricing the “ecosystem entry point.” The real test is consistency: over the past few days, price action has been converging, and volume has hovered around $90M–$110M. Turnover is fairly active, but there isn’t yet solid evidence of fresh incremental inflows.
Right now, attention is on the dense traded zone at $0.29–$0.30. If $JUP breaks above $0.33 on expanding volume, the next target will be the market structure around $0.35. If it instead falls back below $0.29, the capital that built positions near $0.22 will first lock in profits, and this rebound may again return to a “wait-and-see” configuration.
Can this kind of bottom-up lifting trend attract a sufficiently large-scale ecosystem buyer to carry the momentum forward—not just capital chasing Solana ecosystem optimism? If price fluctuations can’t be translated into a synchronized push toward real utility, then every subsequent surge in volume after $0.35 could turn into yet another high-level rotation, pushing the price back to the starting point.
The 30-day gain is 50%, and it’s still -83.60% away from the ATH. The market cap has returned to #76 at $1.09B, as the market is re-pricing the “ecosystem entry point.” The real test is consistency: over the past few days, price action has been converging, and volume has hovered around $90M–$110M. Turnover is fairly active, but there isn’t yet solid evidence of fresh incremental inflows.
Right now, attention is on the dense traded zone at $0.29–$0.30. If $JUP breaks above $0.33 on expanding volume, the next target will be the market structure around $0.35. If it instead falls back below $0.29, the capital that built positions near $0.22 will first lock in profits, and this rebound may again return to a “wait-and-see” configuration.
Can this kind of bottom-up lifting trend attract a sufficiently large-scale ecosystem buyer to carry the momentum forward—not just capital chasing Solana ecosystem optimism? If price fluctuations can’t be translated into a synchronized push toward real utility, then every subsequent surge in volume after $0.35 could turn into yet another high-level rotation, pushing the price back to the starting point.
161
Log in to explore more content
Join global crypto users on Binance Square
⚡️ Get latest and useful information about crypto.
💬 Trusted by the world’s largest crypto exchange.
👍 Discover real insights from verified creators.
Email / Phone number
Trending Topics
1
#CanBTCReboundAfterFallingBelow60K?
355,715 views
1,492 Discussing
2
#GlobalStocksFaceLongestLosingStreakSince2023
117,251 views
1,060 Discussing
3
#BlackRockIBITPostsRecord$541MSingleDayOutflow
588 views
15 Discussing
4
#AnthropicPlungesTowardIPOPriceonDay2
56,610 views
572 Discussing
5
#TwentyOneCapitalAdds172.25BTC
9,276 views
146 Discussing
6
#HKBillWouldExcludeTokenizedDepositsFromVirtualAssets
819 views
14 Discussing
7
#BNBDropsBelow540USDTWith8.46%DailyDecline
30,205 views
254 Discussing
8
#HKBillProposesHK$100KFineForUnauthorizedCryptoTitles
999 views
14 Discussing
9
#BitMineFaces$10.1BUnrealizedETHLoss
1,955 views
18 Discussing
10
#StrategyReports$35BNetReserves
1,814 views
17 Discussing