
The Crypto Basic
7.7k Posts

The Crypto Basic
 Square Verified+
Report
Block User
Your Ultimate Crypto News Source
0 Following
36.3K+ Followers
165.9K+ Liked
Posts
Verified
Article
"Shiba Inu Insider Says SHIB Is on Track for a Dedicated Spot ETF"Shiba Eternity Advisor Mazrael says #Shiba Inu has made significant progress toward gaining broader access to regulated exchange-traded products.
Mazrael made the remarks while responding to a Shiba Inu community member seeking an update on the possibility of a U.S. SHIB ETF.
In response, Mazrael acknowledged that Shiba Inu still lacks a dedicated U.S. spot ETF. Nonetheless, he pointed to developments across the United States, Europe, Japan, and Canada as signs that SHIB is gradually moving closer to that milestone.
SHIB Gains Exposure Through T. Rowe Price’s ETF
Mazrael identified the T. Rowe Price Active Crypto ETF (TKNZ) as one of the most significant developments for SHIB.
T. Rowe Price launched TKNZ on NYSE Arca on July 16, 2026, as an actively managed, multi-token spot crypto exchange-traded product. Instead of tracking a single cryptocurrency, the fund selects assets from an eligible universe and can hold a basket of digital assets.
Notably, SHIB appeared among the eligible assets listed in the fund’s July prospectus. This gives institutional investors a regulated U.S. investment vehicle that can potentially provide exposure to SHIB. However, SHIB was not among the assets featured at the fund’s initial launch.
Europe and Japan Expand Regulated SHIB Access
Meanwhile, Mazrael highlighted Valour’s SHIB ETP in Europe, which trades under the ticker 1VBS on the Spotlight Stock Market.
He also pointed to SHIB’s regulated spot access in Japan through Nomura’s Laser Digital following registration with the Japanese Financial Services Agency. Although the Japanese product is not an ETF, Mazrael considers the listing another important step toward expanding regulated investment access to SHIB.
Furthermore, Mazrael noted the growing availability of SHIB derivatives in Canada. Regulatory filings confirmed the certification of Shiba Inu-related futures products in 2026, including a SHIB/USD futures product and a SHIB perpetual futures contract.
More recently, Coinbase’s regulated futures operation added SHIB to its crypto derivatives offerings for eligible Canadian clients.
While futures differ from spot ETFs, Mazrael believes their availability further demonstrates SHIB’s expanding presence within regulated financial markets.
SHIB Is Taking a Different Route From Dogecoin
Mazrael also compared SHIB’s progress with Dogecoin’s path to the ETF market.
According to him, Dogecoin reached the dedicated spot ETF market before Shiba Inu. However, SHIB has followed a different route by gradually building eligibility, ETP exposure, regulated spot access, and derivatives infrastructure across multiple jurisdictions.
Therefore, although Shiba Inu still lacks a dedicated U.S. spot ETF, Mazrael believes the groundwork for such a product is increasingly taking shape.
“No ETF yet. But well on track,” Mazrael remarked.
#Cryptonews
"Shiba Inu Insider Says SHIB Is on Track for a Dedicated Spot ETF"
Shiba Eternity Advisor Mazrael says #Shiba Inu has made significant progress toward gaining broader access to regulated exchange-traded products.
Mazrael made the remarks while responding to a Shiba Inu community member seeking an update on the possibility of a U.S. SHIB ETF.
In response, Mazrael acknowledged that Shiba Inu still lacks a dedicated U.S. spot ETF. Nonetheless, he pointed to developments across the United States, Europe, Japan, and Canada as signs that SHIB is gradually moving closer to that milestone.
SHIB Gains Exposure Through T. Rowe Price’s ETF
Mazrael identified the T. Rowe Price Active Crypto ETF (TKNZ) as one of the most significant developments for SHIB.
T. Rowe Price launched TKNZ on NYSE Arca on July 16, 2026, as an actively managed, multi-token spot crypto exchange-traded product. Instead of tracking a single cryptocurrency, the fund selects assets from an eligible universe and can hold a basket of digital assets.
Notably, SHIB appeared among the eligible assets listed in the fund’s July prospectus. This gives institutional investors a regulated U.S. investment vehicle that can potentially provide exposure to SHIB. However, SHIB was not among the assets featured at the fund’s initial launch.
Europe and Japan Expand Regulated SHIB Access
Meanwhile, Mazrael highlighted Valour’s SHIB ETP in Europe, which trades under the ticker 1VBS on the Spotlight Stock Market.
He also pointed to SHIB’s regulated spot access in Japan through Nomura’s Laser Digital following registration with the Japanese Financial Services Agency. Although the Japanese product is not an ETF, Mazrael considers the listing another important step toward expanding regulated investment access to SHIB.
Furthermore, Mazrael noted the growing availability of SHIB derivatives in Canada. Regulatory filings confirmed the certification of Shiba Inu-related futures products in 2026, including a SHIB/USD futures product and a SHIB perpetual futures contract.
More recently, Coinbase’s regulated futures operation added SHIB to its crypto derivatives offerings for eligible Canadian clients.
While futures differ from spot ETFs, Mazrael believes their availability further demonstrates SHIB’s expanding presence within regulated financial markets.
SHIB Is Taking a Different Route From Dogecoin
Mazrael also compared SHIB’s progress with Dogecoin’s path to the ETF market.
According to him, Dogecoin reached the dedicated spot ETF market before Shiba Inu. However, SHIB has followed a different route by gradually building eligibility, ETP exposure, regulated spot access, and derivatives infrastructure across multiple jurisdictions.
Therefore, although Shiba Inu still lacks a dedicated U.S. spot ETF, Mazrael believes the groundwork for such a product is increasingly taking shape.
“No ETF yet. But well on track,” Mazrael remarked.
#Cryptonews
Mazrael made the remarks while responding to a Shiba Inu community member seeking an update on the possibility of a U.S. SHIB ETF.
In response, Mazrael acknowledged that Shiba Inu still lacks a dedicated U.S. spot ETF. Nonetheless, he pointed to developments across the United States, Europe, Japan, and Canada as signs that SHIB is gradually moving closer to that milestone.
SHIB Gains Exposure Through T. Rowe Price’s ETF
Mazrael identified the T. Rowe Price Active Crypto ETF (TKNZ) as one of the most significant developments for SHIB.
T. Rowe Price launched TKNZ on NYSE Arca on July 16, 2026, as an actively managed, multi-token spot crypto exchange-traded product. Instead of tracking a single cryptocurrency, the fund selects assets from an eligible universe and can hold a basket of digital assets.
Notably, SHIB appeared among the eligible assets listed in the fund’s July prospectus. This gives institutional investors a regulated U.S. investment vehicle that can potentially provide exposure to SHIB. However, SHIB was not among the assets featured at the fund’s initial launch.
Europe and Japan Expand Regulated SHIB Access
Meanwhile, Mazrael highlighted Valour’s SHIB ETP in Europe, which trades under the ticker 1VBS on the Spotlight Stock Market.
He also pointed to SHIB’s regulated spot access in Japan through Nomura’s Laser Digital following registration with the Japanese Financial Services Agency. Although the Japanese product is not an ETF, Mazrael considers the listing another important step toward expanding regulated investment access to SHIB.
Furthermore, Mazrael noted the growing availability of SHIB derivatives in Canada. Regulatory filings confirmed the certification of Shiba Inu-related futures products in 2026, including a SHIB/USD futures product and a SHIB perpetual futures contract.
More recently, Coinbase’s regulated futures operation added SHIB to its crypto derivatives offerings for eligible Canadian clients.
While futures differ from spot ETFs, Mazrael believes their availability further demonstrates SHIB’s expanding presence within regulated financial markets.
SHIB Is Taking a Different Route From Dogecoin
Mazrael also compared SHIB’s progress with Dogecoin’s path to the ETF market.
According to him, Dogecoin reached the dedicated spot ETF market before Shiba Inu. However, SHIB has followed a different route by gradually building eligibility, ETP exposure, regulated spot access, and derivatives infrastructure across multiple jurisdictions.
Therefore, although Shiba Inu still lacks a dedicated U.S. spot ETF, Mazrael believes the groundwork for such a product is increasingly taking shape.
“No ETF yet. But well on track,” Mazrael remarked.
#Cryptonews
2
333
Article
"Cardano Founder Highlights Key Solution to Growing AI Threats"#Cardano founder Charles Hoskinson has reacted to the reported theft of 4,000 Bitcoin from the Liquid Network’s federation wallet.
Liquid confirmed the incident in an X post yesterday, stating that hackers siphoned approximately 4,000 Bitcoin worth $320 million from its federation wallet. According to the network, the attackers moved the funds through the SideSwap Peg-out Authorization Key (PAK) service.
However, Liquid and SideSwap both indicated that the PAK itself was not compromised. Instead, SideSwap said the L-BTC involved in the transaction originated from a vulnerability in Elements, the Bitcoin-derived software that powers the Liquid sidechain.
Following the incident, Liquid disabled its bridge nodes and paused network activity while federation members investigated the breach. Meanwhile, exchanges received notifications and began pausing, or preparing to pause, L-BTC deposits and withdrawals.
The transaction also contained an OP_RETURN message, in which the attackers, who claimed to be white hats, requested on-chain contact.
Hoskinson Warns of AI-Driven Cybersecurity Risks
Reacting to the incident, Hoskinson used the breach to highlight what he sees as a growing cybersecurity threat from artificial intelligence.
He argued that formal methods may provide one of the strongest defenses against increasingly capable AI-driven attacks. As AI systems become better at analyzing source code, identifying vulnerabilities and automating sophisticated attacks, blockchain developers face an increasingly narrow window between the discovery of a software weakness and its exploitation.
AI has already begun changing the cryptocurrency security landscape by helping attackers identify potential targets, analyze complex code, and automate phishing and social-engineering campaigns. The reported Coldcard hack, which involved the theft of $130 million worth of Bitcoin, has further fueled concerns about how advanced AI tools could make difficult vulnerabilities easier to identify and exploit.
Against this backdrop, Hoskinson argues that conventional testing alone may no longer provide sufficient protection. Instead, he points to formal methods, which use mathematical specifications and proofs to establish whether software behaves according to its intended design.
Cardano’s Emphasis on Formal Verification
Hoskinson’s warning also aligns with Cardano’s long-standing emphasis on mathematically rigorous blockchain development.
Cardano’s development philosophy incorporates academic research, peer review, and formal verification as important components of its security approach. Its Ouroboros consensus protocol, for example, emerged from formal academic research, while the broader ecosystem has emphasized proving critical properties of protocols and software rather than relying exclusively on experimental testing.
This approach supports Hoskinson’s argument because formal verification seeks to mathematically demonstrate that specified properties hold. As a result, developers can potentially identify entire classes of vulnerabilities before deploying code to production.
Cardano also relies on functional programming technologies such as Haskell and Plutus. Their strong type systems and mathematical foundations can help developers detect certain categories of programming errors earlier in the development process.
Notably, Cardano’s approach aims to prevent vulnerabilities before they reach production rather than relying solely on testing and conventional security practices.
#CryptoNewsFlash
"Cardano Founder Highlights Key Solution to Growing AI Threats"
#Cardano founder Charles Hoskinson has reacted to the reported theft of 4,000 Bitcoin from the Liquid Network’s federation wallet.
Liquid confirmed the incident in an X post yesterday, stating that hackers siphoned approximately 4,000 Bitcoin worth $320 million from its federation wallet. According to the network, the attackers moved the funds through the SideSwap Peg-out Authorization Key (PAK) service.
However, Liquid and SideSwap both indicated that the PAK itself was not compromised. Instead, SideSwap said the L-BTC involved in the transaction originated from a vulnerability in Elements, the Bitcoin-derived software that powers the Liquid sidechain.
Following the incident, Liquid disabled its bridge nodes and paused network activity while federation members investigated the breach. Meanwhile, exchanges received notifications and began pausing, or preparing to pause, L-BTC deposits and withdrawals.
The transaction also contained an OP_RETURN message, in which the attackers, who claimed to be white hats, requested on-chain contact.
Hoskinson Warns of AI-Driven Cybersecurity Risks
Reacting to the incident, Hoskinson used the breach to highlight what he sees as a growing cybersecurity threat from artificial intelligence.
He argued that formal methods may provide one of the strongest defenses against increasingly capable AI-driven attacks. As AI systems become better at analyzing source code, identifying vulnerabilities and automating sophisticated attacks, blockchain developers face an increasingly narrow window between the discovery of a software weakness and its exploitation.
AI has already begun changing the cryptocurrency security landscape by helping attackers identify potential targets, analyze complex code, and automate phishing and social-engineering campaigns. The reported Coldcard hack, which involved the theft of $130 million worth of Bitcoin, has further fueled concerns about how advanced AI tools could make difficult vulnerabilities easier to identify and exploit.
Against this backdrop, Hoskinson argues that conventional testing alone may no longer provide sufficient protection. Instead, he points to formal methods, which use mathematical specifications and proofs to establish whether software behaves according to its intended design.
Cardano’s Emphasis on Formal Verification
Hoskinson’s warning also aligns with Cardano’s long-standing emphasis on mathematically rigorous blockchain development.
Cardano’s development philosophy incorporates academic research, peer review, and formal verification as important components of its security approach. Its Ouroboros consensus protocol, for example, emerged from formal academic research, while the broader ecosystem has emphasized proving critical properties of protocols and software rather than relying exclusively on experimental testing.
This approach supports Hoskinson’s argument because formal verification seeks to mathematically demonstrate that specified properties hold. As a result, developers can potentially identify entire classes of vulnerabilities before deploying code to production.
Cardano also relies on functional programming technologies such as Haskell and Plutus. Their strong type systems and mathematical foundations can help developers detect certain categories of programming errors earlier in the development process.
Notably, Cardano’s approach aims to prevent vulnerabilities before they reach production rather than relying solely on testing and conventional security practices.
#CryptoNewsFlash
Liquid confirmed the incident in an X post yesterday, stating that hackers siphoned approximately 4,000 Bitcoin worth $320 million from its federation wallet. According to the network, the attackers moved the funds through the SideSwap Peg-out Authorization Key (PAK) service.
However, Liquid and SideSwap both indicated that the PAK itself was not compromised. Instead, SideSwap said the L-BTC involved in the transaction originated from a vulnerability in Elements, the Bitcoin-derived software that powers the Liquid sidechain.
Following the incident, Liquid disabled its bridge nodes and paused network activity while federation members investigated the breach. Meanwhile, exchanges received notifications and began pausing, or preparing to pause, L-BTC deposits and withdrawals.
The transaction also contained an OP_RETURN message, in which the attackers, who claimed to be white hats, requested on-chain contact.
Hoskinson Warns of AI-Driven Cybersecurity Risks
Reacting to the incident, Hoskinson used the breach to highlight what he sees as a growing cybersecurity threat from artificial intelligence.
He argued that formal methods may provide one of the strongest defenses against increasingly capable AI-driven attacks. As AI systems become better at analyzing source code, identifying vulnerabilities and automating sophisticated attacks, blockchain developers face an increasingly narrow window between the discovery of a software weakness and its exploitation.
AI has already begun changing the cryptocurrency security landscape by helping attackers identify potential targets, analyze complex code, and automate phishing and social-engineering campaigns. The reported Coldcard hack, which involved the theft of $130 million worth of Bitcoin, has further fueled concerns about how advanced AI tools could make difficult vulnerabilities easier to identify and exploit.
Against this backdrop, Hoskinson argues that conventional testing alone may no longer provide sufficient protection. Instead, he points to formal methods, which use mathematical specifications and proofs to establish whether software behaves according to its intended design.
Cardano’s Emphasis on Formal Verification
Hoskinson’s warning also aligns with Cardano’s long-standing emphasis on mathematically rigorous blockchain development.
Cardano’s development philosophy incorporates academic research, peer review, and formal verification as important components of its security approach. Its Ouroboros consensus protocol, for example, emerged from formal academic research, while the broader ecosystem has emphasized proving critical properties of protocols and software rather than relying exclusively on experimental testing.
This approach supports Hoskinson’s argument because formal verification seeks to mathematically demonstrate that specified properties hold. As a result, developers can potentially identify entire classes of vulnerabilities before deploying code to production.
Cardano also relies on functional programming technologies such as Haskell and Plutus. Their strong type systems and mathematical foundations can help developers detect certain categories of programming errors earlier in the development process.
Notably, Cardano’s approach aims to prevent vulnerabilities before they reach production rather than relying solely on testing and conventional security practices.
#CryptoNewsFlash
355
Article
"XRP Maintains Bullish BoS as Price Targets Rebound to $1.48"#XRP has pulled back from the $1.69 high reached during its August rally, but its 4-hour chart still shows a bullish Break of Structure (BoS).
Notably, XRP rose 71.8% from $0.988 to $1.698 in August before the current pullback began. The decline has already erased about 20% of the August high, as the price now trades just above the EMA21 at $1.4020.
This level could help determine whether the pullback stays limited or turns into a steeper decline.
XRP Maintains Bullish BoS
The 4-hour chart shows that XRP formed a bullish BoS 23 bars ago after breaking above $1.4335. This move gave buyers control of the short-term trend, but the recent decline has brought the price back to the EMA21 at $1.4020. The EMA55 at $1.3884 now provides another support level below the EMA21.
Meanwhile, XRP’s Bollinger Bands range from $1.3607 to $1.4433. XRP currently sits in the lower half of this range, but this alone does not point to a reversal. Instead, the price action could simply undergo a period of consolidation within the wider 4-hour uptrend.
The chart leaves the $1.4835 swing high as the next major level to watch. XRP has not tested this level since forming the bullish BoS. As a result, a move toward it would give buyers a chance to complete the next major test in the current structure.
Important XRP Demand Zone
The area around the EMA21 at $1.4020 and the $1.4335 BoS level features an important support zone for the current structure.
Below it, the $1.35–$1.38 region could provide further support. Market analyst Ali Martinez previously identified this area as a major demand zone, with about 3.2 billion XRP changing hands there.
If XRP loses the EMA21, the price could first move toward the EMA55 at $1.3884. Further weakness could then bring the $1.35-$1.38 demand zone into focus. However, a move back above $1.4335 would strengthen the bullish setup and increase the chances of a retest of $1.4835.
XRP ETFs Keep Drawing Fresh Capital
XRP’s price has declined from its August high, but spot XRP ETFs have continued to attract capital. US spot XRP ETFs recorded $110.49 million in inflows during the week ending Aug. 28, marking their strongest weekly inflow of 2026.
The funds extended their inflow streak to 11 straight trading sessions, bringing in roughly $170 million during that period. The continued inflows as XRP declined suggest that investors are still adding exposure as the market works through its recent correction.
Despite Goldman Sachs confirming about $87.4 million in XRP ETF exposure as of the second quarter, retail investors still account for nearly 84% of XRP ETF inflows, which leaves room for greater institutional participation.
XRP Needs to Reclaim $1.4335
Essentially, the bullish setup needs XRP to close a 4-hour candle above $1.4335. Such a move would show that buyers have reclaimed the BoS level and could clear the path toward the $1.4835 swing high.
If XRP breaks above $1.4835, the next major target would be the $1.6999 August high. However, the structure also has a clear level that would weaken the bullish case.
A 4-hour close below the EMA55 at $1.3884 would put the current structure under pressure and could indicate that the bullish setup has failed.
#CryptoNewsCommunity
"XRP Maintains Bullish BoS as Price Targets Rebound to $1.48"
#XRP has pulled back from the $1.69 high reached during its August rally, but its 4-hour chart still shows a bullish Break of Structure (BoS).
Notably, XRP rose 71.8% from $0.988 to $1.698 in August before the current pullback began. The decline has already erased about 20% of the August high, as the price now trades just above the EMA21 at $1.4020.
This level could help determine whether the pullback stays limited or turns into a steeper decline.
XRP Maintains Bullish BoS
The 4-hour chart shows that XRP formed a bullish BoS 23 bars ago after breaking above $1.4335. This move gave buyers control of the short-term trend, but the recent decline has brought the price back to the EMA21 at $1.4020. The EMA55 at $1.3884 now provides another support level below the EMA21.
Meanwhile, XRP’s Bollinger Bands range from $1.3607 to $1.4433. XRP currently sits in the lower half of this range, but this alone does not point to a reversal. Instead, the price action could simply undergo a period of consolidation within the wider 4-hour uptrend.
The chart leaves the $1.4835 swing high as the next major level to watch. XRP has not tested this level since forming the bullish BoS. As a result, a move toward it would give buyers a chance to complete the next major test in the current structure.
Important XRP Demand Zone
The area around the EMA21 at $1.4020 and the $1.4335 BoS level features an important support zone for the current structure.
Below it, the $1.35–$1.38 region could provide further support. Market analyst Ali Martinez previously identified this area as a major demand zone, with about 3.2 billion XRP changing hands there.
If XRP loses the EMA21, the price could first move toward the EMA55 at $1.3884. Further weakness could then bring the $1.35-$1.38 demand zone into focus. However, a move back above $1.4335 would strengthen the bullish setup and increase the chances of a retest of $1.4835.
XRP ETFs Keep Drawing Fresh Capital
XRP’s price has declined from its August high, but spot XRP ETFs have continued to attract capital. US spot XRP ETFs recorded $110.49 million in inflows during the week ending Aug. 28, marking their strongest weekly inflow of 2026.
The funds extended their inflow streak to 11 straight trading sessions, bringing in roughly $170 million during that period. The continued inflows as XRP declined suggest that investors are still adding exposure as the market works through its recent correction.
Despite Goldman Sachs confirming about $87.4 million in XRP ETF exposure as of the second quarter, retail investors still account for nearly 84% of XRP ETF inflows, which leaves room for greater institutional participation.
XRP Needs to Reclaim $1.4335
Essentially, the bullish setup needs XRP to close a 4-hour candle above $1.4335. Such a move would show that buyers have reclaimed the BoS level and could clear the path toward the $1.4835 swing high.
If XRP breaks above $1.4835, the next major target would be the $1.6999 August high. However, the structure also has a clear level that would weaken the bullish case.
A 4-hour close below the EMA55 at $1.3884 would put the current structure under pressure and could indicate that the bullish setup has failed.
#CryptoNewsCommunity
Notably, XRP rose 71.8% from $0.988 to $1.698 in August before the current pullback began. The decline has already erased about 20% of the August high, as the price now trades just above the EMA21 at $1.4020.
This level could help determine whether the pullback stays limited or turns into a steeper decline.
XRP Maintains Bullish BoS
The 4-hour chart shows that XRP formed a bullish BoS 23 bars ago after breaking above $1.4335. This move gave buyers control of the short-term trend, but the recent decline has brought the price back to the EMA21 at $1.4020. The EMA55 at $1.3884 now provides another support level below the EMA21.
Meanwhile, XRP’s Bollinger Bands range from $1.3607 to $1.4433. XRP currently sits in the lower half of this range, but this alone does not point to a reversal. Instead, the price action could simply undergo a period of consolidation within the wider 4-hour uptrend.
The chart leaves the $1.4835 swing high as the next major level to watch. XRP has not tested this level since forming the bullish BoS. As a result, a move toward it would give buyers a chance to complete the next major test in the current structure.
Important XRP Demand Zone
The area around the EMA21 at $1.4020 and the $1.4335 BoS level features an important support zone for the current structure.
Below it, the $1.35–$1.38 region could provide further support. Market analyst Ali Martinez previously identified this area as a major demand zone, with about 3.2 billion XRP changing hands there.
If XRP loses the EMA21, the price could first move toward the EMA55 at $1.3884. Further weakness could then bring the $1.35-$1.38 demand zone into focus. However, a move back above $1.4335 would strengthen the bullish setup and increase the chances of a retest of $1.4835.
XRP ETFs Keep Drawing Fresh Capital
XRP’s price has declined from its August high, but spot XRP ETFs have continued to attract capital. US spot XRP ETFs recorded $110.49 million in inflows during the week ending Aug. 28, marking their strongest weekly inflow of 2026.
The funds extended their inflow streak to 11 straight trading sessions, bringing in roughly $170 million during that period. The continued inflows as XRP declined suggest that investors are still adding exposure as the market works through its recent correction.
Despite Goldman Sachs confirming about $87.4 million in XRP ETF exposure as of the second quarter, retail investors still account for nearly 84% of XRP ETF inflows, which leaves room for greater institutional participation.
XRP Needs to Reclaim $1.4335
Essentially, the bullish setup needs XRP to close a 4-hour candle above $1.4335. Such a move would show that buyers have reclaimed the BoS level and could clear the path toward the $1.4835 swing high.
If XRP breaks above $1.4835, the next major target would be the $1.6999 August high. However, the structure also has a clear level that would weaken the bullish case.
A 4-hour close below the EMA55 at $1.3884 would put the current structure under pressure and could indicate that the bullish setup has failed.
#CryptoNewsCommunity
1
2
397
U.S. spot #Bitcoin exchange-traded funds (ETFs) drew $986.9 million in net inflows last week, up from $924.5 million the previous week. This marked the third consecutive week of positive flows.
BlackRock’s IBIT accounted for $691.5 million of the inflows in the week ended Sept. 4, according to SoSoValue data. The continued allocations were accompanied by lower trading activity, with weekly volume across the Bitcoin funds falling to $14.5 billion from nearly $19 billion.
The latest figures extended momentum from August, when spot Bitcoin ETFs attracted $3.52 billion in net inflows, their strongest monthly showing since September 2025.
Dominick John, an analyst at Zeus Research, said the sustained inflows indicate institutional capital is gradually rebuilding Bitcoin exposure and generating genuine spot demand rather than demand based on leveraged speculation.
Presto Research associate Min Jung similarly attributed the flows to renewed institutional demand, saying crypto appeared to be undergoing a catch-up trade after trailing other risk assets.
#CryptoNewss
U.S. spot #Bitcoin exchange-traded funds (ETFs) drew $986.9 million in net inflows last week, up from $924.5 million the previous week. This marked the third consecutive week of positive flows.
BlackRock’s IBIT accounted for $691.5 million of the inflows in the week ended Sept. 4, according to SoSoValue data. The continued allocations were accompanied by lower trading activity, with weekly volume across the Bitcoin funds falling to $14.5 billion from nearly $19 billion.
The latest figures extended momentum from August, when spot Bitcoin ETFs attracted $3.52 billion in net inflows, their strongest monthly showing since September 2025.
Dominick John, an analyst at Zeus Research, said the sustained inflows indicate institutional capital is gradually rebuilding Bitcoin exposure and generating genuine spot demand rather than demand based on leveraged speculation.
Presto Research associate Min Jung similarly attributed the flows to renewed institutional demand, saying crypto appeared to be undergoing a catch-up trade after trailing other risk assets.
#CryptoNewss
BlackRock’s IBIT accounted for $691.5 million of the inflows in the week ended Sept. 4, according to SoSoValue data. The continued allocations were accompanied by lower trading activity, with weekly volume across the Bitcoin funds falling to $14.5 billion from nearly $19 billion.
The latest figures extended momentum from August, when spot Bitcoin ETFs attracted $3.52 billion in net inflows, their strongest monthly showing since September 2025.
Dominick John, an analyst at Zeus Research, said the sustained inflows indicate institutional capital is gradually rebuilding Bitcoin exposure and generating genuine spot demand rather than demand based on leveraged speculation.
Presto Research associate Min Jung similarly attributed the flows to renewed institutional demand, saying crypto appeared to be undergoing a catch-up trade after trailing other risk assets.
#CryptoNewss
BTC-1.31%
IBITETF-0.50%
233
Verified
Article
"US Government Could Seize XRP During Financial Crisis: Expert Warns"American media personality Alex Jones has warned that proposed changes to the financial system could eventually give governments greater control over privately held assets, including #XRP .
During a recent broadcast, Jones linked discussions surrounding centralized financial ledgers, bank bail-ins, and the mobilization of household savings to a broader concern about government intervention in private wealth. He suggested that regulators could eventually develop mechanisms to control citizens’ assets during a severe financial crisis.
Jones specifically raised the possibility that authorities could target digital assets such as XRP. He compared the potential scenario with the U.S. government’s restrictions on private gold ownership in 1933, arguing that digital assets could face similar intervention under extraordinary circumstances.
However, his comments have faced strong criticism from members of the XRP community, who argue that the claims lack supporting evidence.
XRP Community Challenges Jones’ Claims
XRP community figure Moon Lambo dismissed Jones’ warning as “conspiracy theory nonsense,” arguing that there is no established U.S. government plan to confiscate XRP.
According to Moon Lambo, forcibly taking XRP from American investors would undermine confidence in the digital-asset market and could trigger panic selling. He further argued that such a move could deprive the United States of a significant source of retail and institutional capital.
Moon Lambo also challenged Jones’ comparison with the 1933 gold restrictions. He pointed out that the U.S. operated under a gold-standard monetary system at the time, whereas the modern U.S. dollar is a fiat currency. Therefore, he argued, the government has no comparable monetary requirement to acquire XRP.
Aussie XRP likewise labeled Jones’ claim pure FUD, stressing that the government cannot simply confiscate XRP held in a self-custody wallet. Meanwhile, Jacob Metzger took a more evidence-focused position. He challenged Jones and others making similar claims to identify the specific law, policy, or government document that would authorize regulators to seize people’s XRP, homes, or bank accounts.
Self-Custody Remains a Key Point
Digital Ascension Group Chairman Jake Claver also questioned the timing of Jones’ comments, while an XRPL dUNL validator Vet emphasized that self-custodied XRP remains under the control of whoever possesses the corresponding private keys.
The validator also rejected the characterization of XRP as exclusively a “bank asset.” Instead, he noted that the XRP Ledger is open-source and available to anyone.
Furthermore, financial authorities such as the U.S. FDIC do not have an established legal framework that simply allows them to seize privately held digital assets. Similarly, claims about authorities intervening in Ripple’s locked XRP escrow holdings have faced legal scrutiny, with those escrows operating through predefined mechanisms rather than giving regulators direct control over privately held XRP.
Jones Clarifies His XRP Comments
Amid the backlash, Jones has since clarified that his concerns are focused more broadly on vulnerabilities within the financial system rather than on XRP itself.
Jones explained that viewers had initially asked whether governments could seize XRP during an extreme economic crisis. In response, he said his primary concern was the potential use of emergency government powers, including bank bail-ins, and whether authorities could target different forms of private wealth if the traditional financial system came under severe pressure.
As a result, his clarification shifts the focus from a specific prediction that the government will confiscate XRP to a broader warning about how emergency financial powers could affect private assets during a systemic crisis.
Despite the controversy, some XRP proponents believe Jones’ comments could ultimately benefit the asset by exposing it to a much larger audience. Jones has a massive following of roughly 4.4 million users on X, meaning his discussion of XRP reaches an audience far beyond the cryptocurrency community.
#CryptonewswithJack
"US Government Could Seize XRP During Financial Crisis: Expert Warns"
American media personality Alex Jones has warned that proposed changes to the financial system could eventually give governments greater control over privately held assets, including #XRP .
During a recent broadcast, Jones linked discussions surrounding centralized financial ledgers, bank bail-ins, and the mobilization of household savings to a broader concern about government intervention in private wealth. He suggested that regulators could eventually develop mechanisms to control citizens’ assets during a severe financial crisis.
Jones specifically raised the possibility that authorities could target digital assets such as XRP. He compared the potential scenario with the U.S. government’s restrictions on private gold ownership in 1933, arguing that digital assets could face similar intervention under extraordinary circumstances.
However, his comments have faced strong criticism from members of the XRP community, who argue that the claims lack supporting evidence.
XRP Community Challenges Jones’ Claims
XRP community figure Moon Lambo dismissed Jones’ warning as “conspiracy theory nonsense,” arguing that there is no established U.S. government plan to confiscate XRP.
According to Moon Lambo, forcibly taking XRP from American investors would undermine confidence in the digital-asset market and could trigger panic selling. He further argued that such a move could deprive the United States of a significant source of retail and institutional capital.
Moon Lambo also challenged Jones’ comparison with the 1933 gold restrictions. He pointed out that the U.S. operated under a gold-standard monetary system at the time, whereas the modern U.S. dollar is a fiat currency. Therefore, he argued, the government has no comparable monetary requirement to acquire XRP.
Aussie XRP likewise labeled Jones’ claim pure FUD, stressing that the government cannot simply confiscate XRP held in a self-custody wallet. Meanwhile, Jacob Metzger took a more evidence-focused position. He challenged Jones and others making similar claims to identify the specific law, policy, or government document that would authorize regulators to seize people’s XRP, homes, or bank accounts.
Self-Custody Remains a Key Point
Digital Ascension Group Chairman Jake Claver also questioned the timing of Jones’ comments, while an XRPL dUNL validator Vet emphasized that self-custodied XRP remains under the control of whoever possesses the corresponding private keys.
The validator also rejected the characterization of XRP as exclusively a “bank asset.” Instead, he noted that the XRP Ledger is open-source and available to anyone.
Furthermore, financial authorities such as the U.S. FDIC do not have an established legal framework that simply allows them to seize privately held digital assets. Similarly, claims about authorities intervening in Ripple’s locked XRP escrow holdings have faced legal scrutiny, with those escrows operating through predefined mechanisms rather than giving regulators direct control over privately held XRP.
Jones Clarifies His XRP Comments
Amid the backlash, Jones has since clarified that his concerns are focused more broadly on vulnerabilities within the financial system rather than on XRP itself.
Jones explained that viewers had initially asked whether governments could seize XRP during an extreme economic crisis. In response, he said his primary concern was the potential use of emergency government powers, including bank bail-ins, and whether authorities could target different forms of private wealth if the traditional financial system came under severe pressure.
As a result, his clarification shifts the focus from a specific prediction that the government will confiscate XRP to a broader warning about how emergency financial powers could affect private assets during a systemic crisis.
Despite the controversy, some XRP proponents believe Jones’ comments could ultimately benefit the asset by exposing it to a much larger audience. Jones has a massive following of roughly 4.4 million users on X, meaning his discussion of XRP reaches an audience far beyond the cryptocurrency community.
#CryptonewswithJack
During a recent broadcast, Jones linked discussions surrounding centralized financial ledgers, bank bail-ins, and the mobilization of household savings to a broader concern about government intervention in private wealth. He suggested that regulators could eventually develop mechanisms to control citizens’ assets during a severe financial crisis.
Jones specifically raised the possibility that authorities could target digital assets such as XRP. He compared the potential scenario with the U.S. government’s restrictions on private gold ownership in 1933, arguing that digital assets could face similar intervention under extraordinary circumstances.
However, his comments have faced strong criticism from members of the XRP community, who argue that the claims lack supporting evidence.
XRP Community Challenges Jones’ Claims
XRP community figure Moon Lambo dismissed Jones’ warning as “conspiracy theory nonsense,” arguing that there is no established U.S. government plan to confiscate XRP.
According to Moon Lambo, forcibly taking XRP from American investors would undermine confidence in the digital-asset market and could trigger panic selling. He further argued that such a move could deprive the United States of a significant source of retail and institutional capital.
Moon Lambo also challenged Jones’ comparison with the 1933 gold restrictions. He pointed out that the U.S. operated under a gold-standard monetary system at the time, whereas the modern U.S. dollar is a fiat currency. Therefore, he argued, the government has no comparable monetary requirement to acquire XRP.
Aussie XRP likewise labeled Jones’ claim pure FUD, stressing that the government cannot simply confiscate XRP held in a self-custody wallet. Meanwhile, Jacob Metzger took a more evidence-focused position. He challenged Jones and others making similar claims to identify the specific law, policy, or government document that would authorize regulators to seize people’s XRP, homes, or bank accounts.
Self-Custody Remains a Key Point
Digital Ascension Group Chairman Jake Claver also questioned the timing of Jones’ comments, while an XRPL dUNL validator Vet emphasized that self-custodied XRP remains under the control of whoever possesses the corresponding private keys.
The validator also rejected the characterization of XRP as exclusively a “bank asset.” Instead, he noted that the XRP Ledger is open-source and available to anyone.
Furthermore, financial authorities such as the U.S. FDIC do not have an established legal framework that simply allows them to seize privately held digital assets. Similarly, claims about authorities intervening in Ripple’s locked XRP escrow holdings have faced legal scrutiny, with those escrows operating through predefined mechanisms rather than giving regulators direct control over privately held XRP.
Jones Clarifies His XRP Comments
Amid the backlash, Jones has since clarified that his concerns are focused more broadly on vulnerabilities within the financial system rather than on XRP itself.
Jones explained that viewers had initially asked whether governments could seize XRP during an extreme economic crisis. In response, he said his primary concern was the potential use of emergency government powers, including bank bail-ins, and whether authorities could target different forms of private wealth if the traditional financial system came under severe pressure.
As a result, his clarification shifts the focus from a specific prediction that the government will confiscate XRP to a broader warning about how emergency financial powers could affect private assets during a systemic crisis.
Despite the controversy, some XRP proponents believe Jones’ comments could ultimately benefit the asset by exposing it to a much larger audience. Jones has a massive following of roughly 4.4 million users on X, meaning his discussion of XRP reaches an audience far beyond the cryptocurrency community.
#CryptonewswithJack
1
201
The value of stablecoins and tokenized assets on the #XRP
Ledger (XRPL) has grown about 43 times in just six quarters.
According to Evernorth, the average value of these assets rose from $99 million in Q1 2025 to $4.26 billion in Q2 2026. The value increased every quarter, with no declines.
The Q2 2026 figure was the highest recorded, suggesting that the XRP Ledger is managing and settling large financial assets.
Tokenized assets were the main reason for XRPL’s rapid growth. According to the report, tokenized assets on XRPL averaged $3.72 billion in Q2 2026, up more than 3,000% from the previous year.
RLUSD, Ripple’s dollar-backed stablecoin, also grew quickly. Its average balance reached $539 million in Q2 2026, compared with $73 million a year earlier — a 642% increase.
RLUSD’s balance increased every quarter over the six-quarter period. Its share of the stablecoin supply on XRPL also rose from 20% to 34%. The amount of money moved through RLUSD also jumped 925% compared with a year earlier, according to Evernorth.
#Crypto
The value of stablecoins and tokenized assets on the #XRP
Ledger (XRPL) has grown about 43 times in just six quarters.
According to Evernorth, the average value of these assets rose from $99 million in Q1 2025 to $4.26 billion in Q2 2026. The value increased every quarter, with no declines.
The Q2 2026 figure was the highest recorded, suggesting that the XRP Ledger is managing and settling large financial assets.
Tokenized assets were the main reason for XRPL’s rapid growth. According to the report, tokenized assets on XRPL averaged $3.72 billion in Q2 2026, up more than 3,000% from the previous year.
RLUSD, Ripple’s dollar-backed stablecoin, also grew quickly. Its average balance reached $539 million in Q2 2026, compared with $73 million a year earlier — a 642% increase.
RLUSD’s balance increased every quarter over the six-quarter period. Its share of the stablecoin supply on XRPL also rose from 20% to 34%. The amount of money moved through RLUSD also jumped 925% compared with a year earlier, according to Evernorth.
#Crypto
Ledger (XRPL) has grown about 43 times in just six quarters.
According to Evernorth, the average value of these assets rose from $99 million in Q1 2025 to $4.26 billion in Q2 2026. The value increased every quarter, with no declines.
The Q2 2026 figure was the highest recorded, suggesting that the XRP Ledger is managing and settling large financial assets.
Tokenized assets were the main reason for XRPL’s rapid growth. According to the report, tokenized assets on XRPL averaged $3.72 billion in Q2 2026, up more than 3,000% from the previous year.
RLUSD, Ripple’s dollar-backed stablecoin, also grew quickly. Its average balance reached $539 million in Q2 2026, compared with $73 million a year earlier — a 642% increase.
RLUSD’s balance increased every quarter over the six-quarter period. Its share of the stablecoin supply on XRPL also rose from 20% to 34%. The amount of money moved through RLUSD also jumped 925% compared with a year earlier, according to Evernorth.
#Crypto
243
Article
"Hyperscale Data Halts Michigan Bitcoin Mining With BTC Treasury Down 79%"Hyperscale Data has shut down Bitcoin mining at its Michigan facility to make way for an AI data center customer, with the company’s BTC holdings now about 79% below the level cited in late July.
The company said Wednesday that it shut down all miners at the site following an inspection by the unidentified California-based neocloud provider. The company intends to sell the mining equipment associated with the Michigan operation.
The shutdown advances Hyperscale’s plan to convert the facility from Bitcoin mining to AI infrastructure. Its customer has committed to 20 megawatts of computing capacity under a master services agreement with an initial 10-year term and two optional five-year extensions.
Hyperscale estimates that the agreement could generate more than $1.2 billion in revenue if the customer exercises both extensions, taking the contract to its maximum 20-year term. The customer also has an option for another 32 MW, which could push total contract revenue above $3 billion if exercised and maintained through the extensions.
Hyperscale said the planned expansion has not been finalized and remains subject to funding, regulatory clearances, and other uncertainties. The company ultimately expects the Michigan site to support about 340 MW of power capacity.
Bitcoin Sales Help Fund Michigan Conversion
Hyperscale is partly financing the Michigan redevelopment by drawing down its Bitcoin treasury.
The company reported holdings of about 1,006 BTC on July 30, when it had also sold 100 BTC. Hyperscale also raised $5.1 million by selling roughly 65 BTC during the week through Aug. 30. It said the proceeds would help fund work at the Michigan site.
BitcoinTreasuries.NET lists the company with 215 BTC valued at about $16.7 million. Compared with the July figure, that represents a decline of about 79%. The platform ranks Hyperscale 84th among the public companies it tracks.
Hyperscale Shares Fall to Split-Adjusted Record
The operational shift comes as Hyperscale’s shares trade near record lows.
The company’s NYSE American-listed stock fell about 17% on Wednesday, closing at $0.1984 after reaching $0.1934 intraday, according to Yahoo Finance data. The closing level marked a split-adjusted record low.
The move came shortly after Hyperscale completed a reverse stock split at a ratio of one share for every five shares outstanding. Trading on the adjusted share basis began Aug. 25, according to a filing with the U.S. Securities and Exchange Commission (SEC).
#CryptoNews🚀🔥V
"Hyperscale Data Halts Michigan Bitcoin Mining With BTC Treasury Down 79%"
Hyperscale Data has shut down Bitcoin mining at its Michigan facility to make way for an AI data center customer, with the company’s BTC holdings now about 79% below the level cited in late July.
The company said Wednesday that it shut down all miners at the site following an inspection by the unidentified California-based neocloud provider. The company intends to sell the mining equipment associated with the Michigan operation.
The shutdown advances Hyperscale’s plan to convert the facility from Bitcoin mining to AI infrastructure. Its customer has committed to 20 megawatts of computing capacity under a master services agreement with an initial 10-year term and two optional five-year extensions.
Hyperscale estimates that the agreement could generate more than $1.2 billion in revenue if the customer exercises both extensions, taking the contract to its maximum 20-year term. The customer also has an option for another 32 MW, which could push total contract revenue above $3 billion if exercised and maintained through the extensions.
Hyperscale said the planned expansion has not been finalized and remains subject to funding, regulatory clearances, and other uncertainties. The company ultimately expects the Michigan site to support about 340 MW of power capacity.
Bitcoin Sales Help Fund Michigan Conversion
Hyperscale is partly financing the Michigan redevelopment by drawing down its Bitcoin treasury.
The company reported holdings of about 1,006 BTC on July 30, when it had also sold 100 BTC. Hyperscale also raised $5.1 million by selling roughly 65 BTC during the week through Aug. 30. It said the proceeds would help fund work at the Michigan site.
BitcoinTreasuries.NET lists the company with 215 BTC valued at about $16.7 million. Compared with the July figure, that represents a decline of about 79%. The platform ranks Hyperscale 84th among the public companies it tracks.
Hyperscale Shares Fall to Split-Adjusted Record
The operational shift comes as Hyperscale’s shares trade near record lows.
The company’s NYSE American-listed stock fell about 17% on Wednesday, closing at $0.1984 after reaching $0.1934 intraday, according to Yahoo Finance data. The closing level marked a split-adjusted record low.
The move came shortly after Hyperscale completed a reverse stock split at a ratio of one share for every five shares outstanding. Trading on the adjusted share basis began Aug. 25, according to a filing with the U.S. Securities and Exchange Commission (SEC).
#CryptoNews🚀🔥V
The company said Wednesday that it shut down all miners at the site following an inspection by the unidentified California-based neocloud provider. The company intends to sell the mining equipment associated with the Michigan operation.
The shutdown advances Hyperscale’s plan to convert the facility from Bitcoin mining to AI infrastructure. Its customer has committed to 20 megawatts of computing capacity under a master services agreement with an initial 10-year term and two optional five-year extensions.
Hyperscale estimates that the agreement could generate more than $1.2 billion in revenue if the customer exercises both extensions, taking the contract to its maximum 20-year term. The customer also has an option for another 32 MW, which could push total contract revenue above $3 billion if exercised and maintained through the extensions.
Hyperscale said the planned expansion has not been finalized and remains subject to funding, regulatory clearances, and other uncertainties. The company ultimately expects the Michigan site to support about 340 MW of power capacity.
Bitcoin Sales Help Fund Michigan Conversion
Hyperscale is partly financing the Michigan redevelopment by drawing down its Bitcoin treasury.
The company reported holdings of about 1,006 BTC on July 30, when it had also sold 100 BTC. Hyperscale also raised $5.1 million by selling roughly 65 BTC during the week through Aug. 30. It said the proceeds would help fund work at the Michigan site.
BitcoinTreasuries.NET lists the company with 215 BTC valued at about $16.7 million. Compared with the July figure, that represents a decline of about 79%. The platform ranks Hyperscale 84th among the public companies it tracks.
Hyperscale Shares Fall to Split-Adjusted Record
The operational shift comes as Hyperscale’s shares trade near record lows.
The company’s NYSE American-listed stock fell about 17% on Wednesday, closing at $0.1984 after reaching $0.1934 intraday, according to Yahoo Finance data. The closing level marked a split-adjusted record low.
The move came shortly after Hyperscale completed a reverse stock split at a ratio of one share for every five shares outstanding. Trading on the adjusted share basis began Aug. 25, according to a filing with the U.S. Securities and Exchange Commission (SEC).
#CryptoNews🚀🔥V
261
Article
"US Authorities, CrowdStrike Disrupt Sality Botnet Used to Steal at Least $150,000 in Crypto"The US Justice Department said an international operation involving European law enforcement and private-sector partners disrupted Sality’s operations, cutting the malware network off from its operator. Sality had been linked to cryptocurrency theft and other cyberattacks.
The Justice Department said Tuesday that authorities in Bulgaria, Hungary and Romania participated in the effort alongside CrowdStrike and the Shadowserver Foundation. According to US officials, the malware network had been infecting devices and deploying malicious software since 2003.
EggJagger Redirected Crypto Payments
Over the previous eight years, Sality’s operator used a clipjacking tool known as EggJagger to steal at least 12.1 million rubles, equivalent to roughly $150,000 in cryptocurrency, according to CrowdStrike.
EggJagger monitored device clipboards for cryptocurrency wallet addresses and replaced them with addresses controlled by the operator. As a result, payments could be redirected when victims copied Bitcoin or Ethereum addresses before making transfers.
CrowdStrike said the value of stolen digital assets that remained unspent peaked at about 147 million rubles, or roughly $1.35 million, in January 2025.
Disruption Cuts Operator Off From Infected Computers
The operation severed the Sality operator’s ability to communicate with compromised machines, according to CrowdStrike.
More than 15,000 infected computers were part of Sality’s peer-to-peer botnet. The bots checked every 40 minutes whether known peers remained online, allowing machines within the decentralized network to communicate directly with one another.
CrowdStrike said the disruption isolated those infected machines from the operator, preventing them from receiving new payload instructions or direct payload transfers.
#CryptonewswithJack
"US Authorities, CrowdStrike Disrupt Sality Botnet Used to Steal at Least $150,000 in Crypto"
The US Justice Department said an international operation involving European law enforcement and private-sector partners disrupted Sality’s operations, cutting the malware network off from its operator. Sality had been linked to cryptocurrency theft and other cyberattacks.
The Justice Department said Tuesday that authorities in Bulgaria, Hungary and Romania participated in the effort alongside CrowdStrike and the Shadowserver Foundation. According to US officials, the malware network had been infecting devices and deploying malicious software since 2003.
EggJagger Redirected Crypto Payments
Over the previous eight years, Sality’s operator used a clipjacking tool known as EggJagger to steal at least 12.1 million rubles, equivalent to roughly $150,000 in cryptocurrency, according to CrowdStrike.
EggJagger monitored device clipboards for cryptocurrency wallet addresses and replaced them with addresses controlled by the operator. As a result, payments could be redirected when victims copied Bitcoin or Ethereum addresses before making transfers.
CrowdStrike said the value of stolen digital assets that remained unspent peaked at about 147 million rubles, or roughly $1.35 million, in January 2025.
Disruption Cuts Operator Off From Infected Computers
The operation severed the Sality operator’s ability to communicate with compromised machines, according to CrowdStrike.
More than 15,000 infected computers were part of Sality’s peer-to-peer botnet. The bots checked every 40 minutes whether known peers remained online, allowing machines within the decentralized network to communicate directly with one another.
CrowdStrike said the disruption isolated those infected machines from the operator, preventing them from receiving new payload instructions or direct payload transfers.
#CryptonewswithJack
The Justice Department said Tuesday that authorities in Bulgaria, Hungary and Romania participated in the effort alongside CrowdStrike and the Shadowserver Foundation. According to US officials, the malware network had been infecting devices and deploying malicious software since 2003.
EggJagger Redirected Crypto Payments
Over the previous eight years, Sality’s operator used a clipjacking tool known as EggJagger to steal at least 12.1 million rubles, equivalent to roughly $150,000 in cryptocurrency, according to CrowdStrike.
EggJagger monitored device clipboards for cryptocurrency wallet addresses and replaced them with addresses controlled by the operator. As a result, payments could be redirected when victims copied Bitcoin or Ethereum addresses before making transfers.
CrowdStrike said the value of stolen digital assets that remained unspent peaked at about 147 million rubles, or roughly $1.35 million, in January 2025.
Disruption Cuts Operator Off From Infected Computers
The operation severed the Sality operator’s ability to communicate with compromised machines, according to CrowdStrike.
More than 15,000 infected computers were part of Sality’s peer-to-peer botnet. The bots checked every 40 minutes whether known peers remained online, allowing machines within the decentralized network to communicate directly with one another.
CrowdStrike said the disruption isolated those infected machines from the operator, preventing them from receiving new payload instructions or direct payload transfers.
#CryptonewswithJack
45
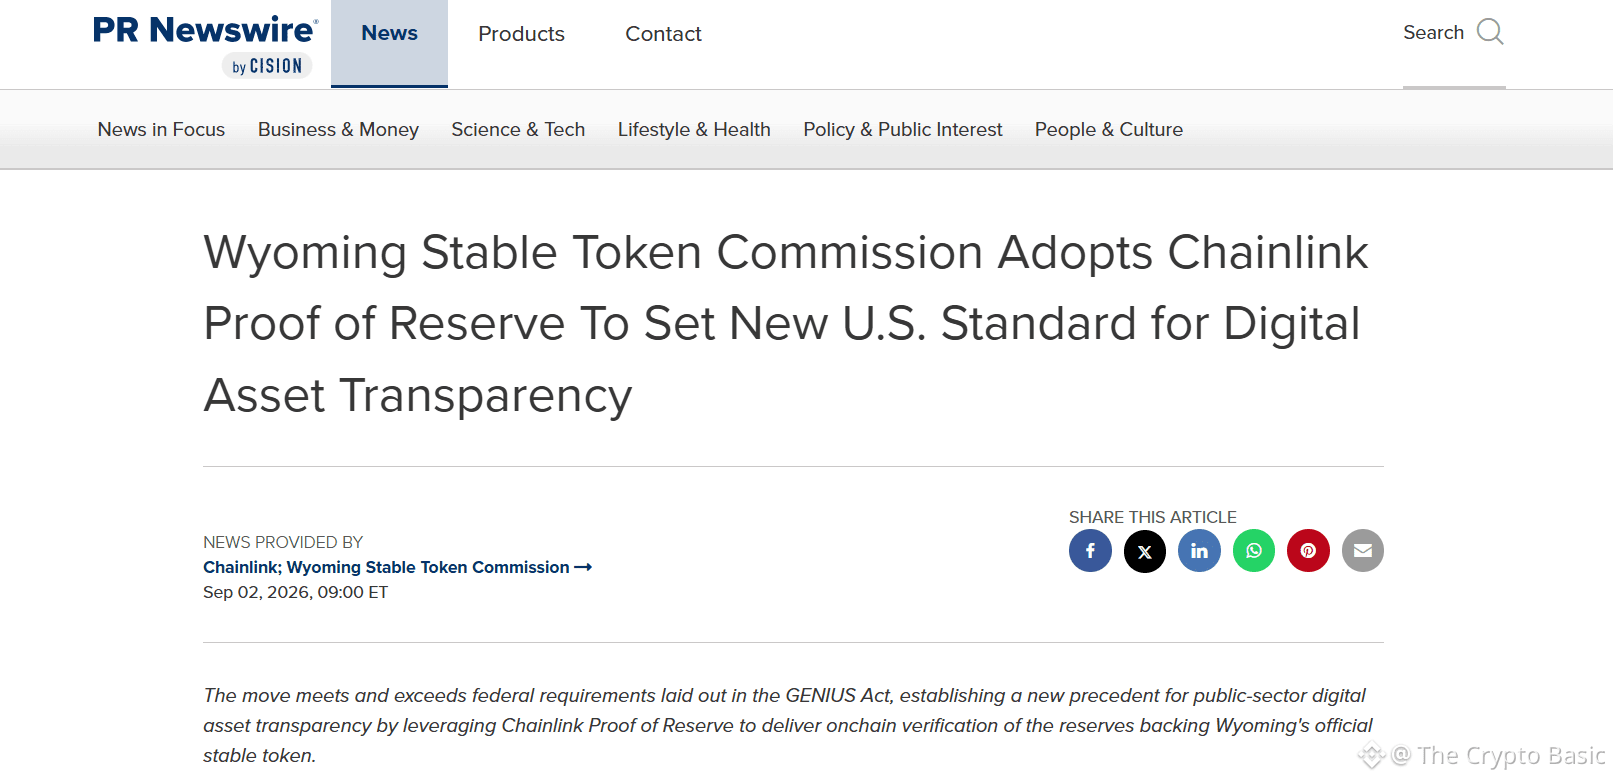
The US state of Wyoming is adding Chainlink-based reserve monitoring to its Frontier Stable Token, giving users access to verified on-chain data about the assets supporting FRNT with minimal reporting delay. The move further broadens Chainlink’s role in the state-issued stablecoin.
According to a Wednesday announcement from the Wyoming Stable Token Commission, the state has selected Chainlink’s Proof of Reserve technology to put verified data on FRNT’s reserves and circulating supply onchain. The Network Firm will independently examine the figures before the data is transmitted through Chainlink infrastructure.
The commission is seeking an additional safeguard through Chainlink’s Secure Mint feature. Once adopted, the mechanism would prevent the creation of new FRNT unless verified reserves are equal to or greater than the token’s total supply.
Those measures build on Wyoming’s existing reserve-reporting process. FRNT already has daily reserve attestations, while the GENIUS Act calls for monthly disclosures covering reserve composition and outstanding stablecoin supply. The commission said Proof of Reserve will provide more timely visibility into movements in the token’s backing between reporting periods.
#CryptoNewsCommunity
The US state of Wyoming is adding Chainlink-based reserve monitoring to its Frontier Stable Token, giving users access to verified on-chain data about the assets supporting FRNT with minimal reporting delay. The move further broadens Chainlink’s role in the state-issued stablecoin.
According to a Wednesday announcement from the Wyoming Stable Token Commission, the state has selected Chainlink’s Proof of Reserve technology to put verified data on FRNT’s reserves and circulating supply onchain. The Network Firm will independently examine the figures before the data is transmitted through Chainlink infrastructure.
The commission is seeking an additional safeguard through Chainlink’s Secure Mint feature. Once adopted, the mechanism would prevent the creation of new FRNT unless verified reserves are equal to or greater than the token’s total supply.
Those measures build on Wyoming’s existing reserve-reporting process. FRNT already has daily reserve attestations, while the GENIUS Act calls for monthly disclosures covering reserve composition and outstanding stablecoin supply. The commission said Proof of Reserve will provide more timely visibility into movements in the token’s backing between reporting periods.
#CryptoNewsCommunity
According to a Wednesday announcement from the Wyoming Stable Token Commission, the state has selected Chainlink’s Proof of Reserve technology to put verified data on FRNT’s reserves and circulating supply onchain. The Network Firm will independently examine the figures before the data is transmitted through Chainlink infrastructure.
The commission is seeking an additional safeguard through Chainlink’s Secure Mint feature. Once adopted, the mechanism would prevent the creation of new FRNT unless verified reserves are equal to or greater than the token’s total supply.
Those measures build on Wyoming’s existing reserve-reporting process. FRNT already has daily reserve attestations, while the GENIUS Act calls for monthly disclosures covering reserve composition and outstanding stablecoin supply. The commission said Proof of Reserve will provide more timely visibility into movements in the token’s backing between reporting periods.
#CryptoNewsCommunity
291
Stolen Bitcoin from the third wave of the Coldcard wallet attacks has begun leaving the hacker’s original addresses, with part of the holdings being swapped into Ethereum through THORChain.
The movement is the first recorded departure of funds from the original attacker addresses across any of the three waves, according to Alex Thorn, Galaxy’s head of research. Thorn said Wednesday that the third-wave attacker had moved about 10% of the stolen holdings, leaving roughly 90% untouched.
Several attempts to convert the assets have not gone through as intended. Thorn said the attacker’s swap attempts through THORChain had repeatedly resulted in refunds, prompting further attempts.
Researchers following the activity on-chain were able to trace the transfers beyond THORChain to a fresh Ethereum address. Thorn said the address had been passed to relevant authorities and crypto companies. He also said the attacker’s next step remained uncertain, including whether the assets would be moved again to make them harder to follow or transferred to an exchange.
#CryptoNewss
Stolen Bitcoin from the third wave of the Coldcard wallet attacks has begun leaving the hacker’s original addresses, with part of the holdings being swapped into Ethereum through THORChain.
The movement is the first recorded departure of funds from the original attacker addresses across any of the three waves, according to Alex Thorn, Galaxy’s head of research. Thorn said Wednesday that the third-wave attacker had moved about 10% of the stolen holdings, leaving roughly 90% untouched.
Several attempts to convert the assets have not gone through as intended. Thorn said the attacker’s swap attempts through THORChain had repeatedly resulted in refunds, prompting further attempts.
Researchers following the activity on-chain were able to trace the transfers beyond THORChain to a fresh Ethereum address. Thorn said the address had been passed to relevant authorities and crypto companies. He also said the attacker’s next step remained uncertain, including whether the assets would be moved again to make them harder to follow or transferred to an exchange.
#CryptoNewss
The movement is the first recorded departure of funds from the original attacker addresses across any of the three waves, according to Alex Thorn, Galaxy’s head of research. Thorn said Wednesday that the third-wave attacker had moved about 10% of the stolen holdings, leaving roughly 90% untouched.
Several attempts to convert the assets have not gone through as intended. Thorn said the attacker’s swap attempts through THORChain had repeatedly resulted in refunds, prompting further attempts.
Researchers following the activity on-chain were able to trace the transfers beyond THORChain to a fresh Ethereum address. Thorn said the address had been passed to relevant authorities and crypto companies. He also said the attacker’s next step remained uncertain, including whether the assets would be moved again to make them harder to follow or transferred to an exchange.
#CryptoNewss
2
293
Cardano founder Charles Hoskinson has criticized the relaunched TapTools, saying the platform no longer resembles the high-quality analytics website he once used as part of his daily routine.
For context, TapTools initially announced its shutdown in June after facing significant internal and financial difficulties. As reported earlier, the platform had lost its fifth senior executive within a year, with departures involving key positions such as chief technology officer and chief operating officer, as well as co-founders.
However, TapTools later reversed its decision yesterday and announced its return with the message, “We’re back.”
The announcement initially sparked excitement among some Cardano community members. That enthusiasm quickly faded after the platform introduced a controversial requirement for users.
#CryptoNewsFlash
Cardano founder Charles Hoskinson has criticized the relaunched TapTools, saying the platform no longer resembles the high-quality analytics website he once used as part of his daily routine.
For context, TapTools initially announced its shutdown in June after facing significant internal and financial difficulties. As reported earlier, the platform had lost its fifth senior executive within a year, with departures involving key positions such as chief technology officer and chief operating officer, as well as co-founders.
However, TapTools later reversed its decision yesterday and announced its return with the message, “We’re back.”
The announcement initially sparked excitement among some Cardano community members. That enthusiasm quickly faded after the platform introduced a controversial requirement for users.
#CryptoNewsFlash
For context, TapTools initially announced its shutdown in June after facing significant internal and financial difficulties. As reported earlier, the platform had lost its fifth senior executive within a year, with departures involving key positions such as chief technology officer and chief operating officer, as well as co-founders.
However, TapTools later reversed its decision yesterday and announced its return with the message, “We’re back.”
The announcement initially sparked excitement among some Cardano community members. That enthusiasm quickly faded after the platform introduced a controversial requirement for users.
#CryptoNewsFlash
304
Article
"XRPL DEX Order Book Volume Spiked to 3.57M XRP in Q2 2026"Despite the #XRP price struggles, DEX order book volume on the XRP Ledger (XRPL) soared to 3.57 million XRP per day in Q2 2026.
Recent on-chain data shows that the XRP ecosystem had a mixed second quarter in 2026. This is according to a report from Evernorth, the largest XRP Treasury firm by total holdings.
Specifically, the data confirms that trading through the XRPL decentralized exchange (DEX) order book rose 79% year over year to 3.57 million XRP per day.
XRPL Order-Book Activity Points to Bigger Traders
The rise in volume came despite fewer accounts taking part in order-book trading. The number of accounts starting these trades fell from 1,864 to 1,111 per day.
As a result, the average amount traded by each account rose to 3,217 XRP per day, compared with 1,072 XRP a year earlier.
In addition, order-book trading also made up 81% of all DEX activity in Q2, compared with 54% a year earlier. However, total trading was 16% lower than in Q1 2026, when February recorded unusually high activity.
The rise in trading volume alongside the drop in active accounts suggests that larger and more professional traders may have taken a bigger share of XRPL DEX activity.
This trend also came as XRPL added more infrastructure for institutional users. For instance, permissioned domains and permissioned trading venues went live in February, which gave institutions more tools to use the network.
RLUSD Grows on XRPL
Meanwhile, RLUSD also continued to grow on XRPL. Average RLUSD balances reached $539 million, compared with $73 million a year earlier.
The balance increased in every quarter without recording a decline. This growth persisted despite stablecoin supply across the wider crypto industry falling for the first time since 2023.
On XRPL, RLUSD supply grew 642% year over year, while the value transferred through the stablecoin jumped 925%. This growth pushed XRPL’s share of total RLUSD from 20% to 34%. Higher stablecoin balances could also support larger payment and tokenized-asset transactions on the ledger.
XRPL Account Activity Falls
However, not all of the network’s numbers improved. For one, XRPL averaged 16,587 accounts transacting each day during Q2, while the number of new accounts averaged 2,783 per day. Both figures fell by about 25% from the same period a year earlier.
The broader blockchain market also saw lower activity during the period. On-chain exchange volume dropped 46% year over year, while transaction fees across the seven largest programmable networks fell 38%.
Account numbers tend to show retail activity more clearly, and the decline suggests that retail participation weakened across the broader crypto market during the quarter.
Despite the drop in account activity, the value on XRPL continued to rise. Network value grew from $99 million to $4.26 billion across six quarters. Each quarter recorded a higher figure than the previous one, with Q2 reaching the series high. The increase has continued for a year and a half.
XRP Volume Per Account Remains Strong
Trading volume per account moved in the opposite direction from overall account growth. Across the entire exchange, XRP traded per account rose 81% to 1,149 in Q4 2025. It then climbed another 85% to 2,125 in Q1 2026.
Q2 gave back 15% of that increase, taking the figure to 1,815 XRP per account. Despite this decline, the resulting level remained 2.7 times higher than the series starting point of 636 XRP.
Overall trading volume also recovered after reaching its lowest point in 2025. Daily volume fell to a Q3 2025 low of 2.63 million XRP before recovering to 3.15 million XRP per day in Q4 2025 and 5.26 million XRP per day in Q1 2026. Volume then declined in Q2 to 4.42 million XRP per day.
However, Q2 volume remained 68% above the 2.63 million XRP low. It also remained higher than every quarter of 2025 except Q1 2025, which still holds the series high.
Several XRPL Metrics Hit New Lows
Three metrics ended Q2 at their lowest levels in the six-quarter period. Specifically, daily transacting accounts fell from 33,145 to 16,587, while daily new wallets declined from 6,617 to 2,783. The number of assets traded against XRP on the order book also dropped from 479.9 to 319.4.
At the same time, XRP-paired pools grew 26% across the same six-quarter period, while trading through those pools fell 74%. This suggests that the growing number of pools reflects available capacity rather than stronger trading activity.
#Crypto
"XRPL DEX Order Book Volume Spiked to 3.57M XRP in Q2 2026"
Despite the #XRP price struggles, DEX order book volume on the XRP Ledger (XRPL) soared to 3.57 million XRP per day in Q2 2026.
Recent on-chain data shows that the XRP ecosystem had a mixed second quarter in 2026. This is according to a report from Evernorth, the largest XRP Treasury firm by total holdings.
Specifically, the data confirms that trading through the XRPL decentralized exchange (DEX) order book rose 79% year over year to 3.57 million XRP per day.
XRPL Order-Book Activity Points to Bigger Traders
The rise in volume came despite fewer accounts taking part in order-book trading. The number of accounts starting these trades fell from 1,864 to 1,111 per day.
As a result, the average amount traded by each account rose to 3,217 XRP per day, compared with 1,072 XRP a year earlier.
In addition, order-book trading also made up 81% of all DEX activity in Q2, compared with 54% a year earlier. However, total trading was 16% lower than in Q1 2026, when February recorded unusually high activity.
The rise in trading volume alongside the drop in active accounts suggests that larger and more professional traders may have taken a bigger share of XRPL DEX activity.
This trend also came as XRPL added more infrastructure for institutional users. For instance, permissioned domains and permissioned trading venues went live in February, which gave institutions more tools to use the network.
RLUSD Grows on XRPL
Meanwhile, RLUSD also continued to grow on XRPL. Average RLUSD balances reached $539 million, compared with $73 million a year earlier.
The balance increased in every quarter without recording a decline. This growth persisted despite stablecoin supply across the wider crypto industry falling for the first time since 2023.
On XRPL, RLUSD supply grew 642% year over year, while the value transferred through the stablecoin jumped 925%. This growth pushed XRPL’s share of total RLUSD from 20% to 34%. Higher stablecoin balances could also support larger payment and tokenized-asset transactions on the ledger.
XRPL Account Activity Falls
However, not all of the network’s numbers improved. For one, XRPL averaged 16,587 accounts transacting each day during Q2, while the number of new accounts averaged 2,783 per day. Both figures fell by about 25% from the same period a year earlier.
The broader blockchain market also saw lower activity during the period. On-chain exchange volume dropped 46% year over year, while transaction fees across the seven largest programmable networks fell 38%.
Account numbers tend to show retail activity more clearly, and the decline suggests that retail participation weakened across the broader crypto market during the quarter.
Despite the drop in account activity, the value on XRPL continued to rise. Network value grew from $99 million to $4.26 billion across six quarters. Each quarter recorded a higher figure than the previous one, with Q2 reaching the series high. The increase has continued for a year and a half.
XRP Volume Per Account Remains Strong
Trading volume per account moved in the opposite direction from overall account growth. Across the entire exchange, XRP traded per account rose 81% to 1,149 in Q4 2025. It then climbed another 85% to 2,125 in Q1 2026.
Q2 gave back 15% of that increase, taking the figure to 1,815 XRP per account. Despite this decline, the resulting level remained 2.7 times higher than the series starting point of 636 XRP.
Overall trading volume also recovered after reaching its lowest point in 2025. Daily volume fell to a Q3 2025 low of 2.63 million XRP before recovering to 3.15 million XRP per day in Q4 2025 and 5.26 million XRP per day in Q1 2026. Volume then declined in Q2 to 4.42 million XRP per day.
However, Q2 volume remained 68% above the 2.63 million XRP low. It also remained higher than every quarter of 2025 except Q1 2025, which still holds the series high.
Several XRPL Metrics Hit New Lows
Three metrics ended Q2 at their lowest levels in the six-quarter period. Specifically, daily transacting accounts fell from 33,145 to 16,587, while daily new wallets declined from 6,617 to 2,783. The number of assets traded against XRP on the order book also dropped from 479.9 to 319.4.
At the same time, XRP-paired pools grew 26% across the same six-quarter period, while trading through those pools fell 74%. This suggests that the growing number of pools reflects available capacity rather than stronger trading activity.
#Crypto
Recent on-chain data shows that the XRP ecosystem had a mixed second quarter in 2026. This is according to a report from Evernorth, the largest XRP Treasury firm by total holdings.
Specifically, the data confirms that trading through the XRPL decentralized exchange (DEX) order book rose 79% year over year to 3.57 million XRP per day.
XRPL Order-Book Activity Points to Bigger Traders
The rise in volume came despite fewer accounts taking part in order-book trading. The number of accounts starting these trades fell from 1,864 to 1,111 per day.
As a result, the average amount traded by each account rose to 3,217 XRP per day, compared with 1,072 XRP a year earlier.
In addition, order-book trading also made up 81% of all DEX activity in Q2, compared with 54% a year earlier. However, total trading was 16% lower than in Q1 2026, when February recorded unusually high activity.
The rise in trading volume alongside the drop in active accounts suggests that larger and more professional traders may have taken a bigger share of XRPL DEX activity.
This trend also came as XRPL added more infrastructure for institutional users. For instance, permissioned domains and permissioned trading venues went live in February, which gave institutions more tools to use the network.
RLUSD Grows on XRPL
Meanwhile, RLUSD also continued to grow on XRPL. Average RLUSD balances reached $539 million, compared with $73 million a year earlier.
The balance increased in every quarter without recording a decline. This growth persisted despite stablecoin supply across the wider crypto industry falling for the first time since 2023.
On XRPL, RLUSD supply grew 642% year over year, while the value transferred through the stablecoin jumped 925%. This growth pushed XRPL’s share of total RLUSD from 20% to 34%. Higher stablecoin balances could also support larger payment and tokenized-asset transactions on the ledger.
XRPL Account Activity Falls
However, not all of the network’s numbers improved. For one, XRPL averaged 16,587 accounts transacting each day during Q2, while the number of new accounts averaged 2,783 per day. Both figures fell by about 25% from the same period a year earlier.
The broader blockchain market also saw lower activity during the period. On-chain exchange volume dropped 46% year over year, while transaction fees across the seven largest programmable networks fell 38%.
Account numbers tend to show retail activity more clearly, and the decline suggests that retail participation weakened across the broader crypto market during the quarter.
Despite the drop in account activity, the value on XRPL continued to rise. Network value grew from $99 million to $4.26 billion across six quarters. Each quarter recorded a higher figure than the previous one, with Q2 reaching the series high. The increase has continued for a year and a half.
XRP Volume Per Account Remains Strong
Trading volume per account moved in the opposite direction from overall account growth. Across the entire exchange, XRP traded per account rose 81% to 1,149 in Q4 2025. It then climbed another 85% to 2,125 in Q1 2026.
Q2 gave back 15% of that increase, taking the figure to 1,815 XRP per account. Despite this decline, the resulting level remained 2.7 times higher than the series starting point of 636 XRP.
Overall trading volume also recovered after reaching its lowest point in 2025. Daily volume fell to a Q3 2025 low of 2.63 million XRP before recovering to 3.15 million XRP per day in Q4 2025 and 5.26 million XRP per day in Q1 2026. Volume then declined in Q2 to 4.42 million XRP per day.
However, Q2 volume remained 68% above the 2.63 million XRP low. It also remained higher than every quarter of 2025 except Q1 2025, which still holds the series high.
Several XRPL Metrics Hit New Lows
Three metrics ended Q2 at their lowest levels in the six-quarter period. Specifically, daily transacting accounts fell from 33,145 to 16,587, while daily new wallets declined from 6,617 to 2,783. The number of assets traded against XRP on the order book also dropped from 479.9 to 319.4.
At the same time, XRP-paired pools grew 26% across the same six-quarter period, while trading through those pools fell 74%. This suggests that the growing number of pools reflects available capacity rather than stronger trading activity.
#Crypto
330
Article
"Cardano Network Activity Rises Sharply as Daily Transactions Soar 33% Hit 32,841"#Cardano has recorded a sharp increase in network activity, with daily transactions climbing significantly over the past 24 hours.
According to data highlighted by blockchain fundamentals platform Chainspect, the network processed more than 24,000 transactions on Wednesday, marking its highest daily throughput of the previous week.
Cardano Transaction Volume Chart
The momentum has continued, with Cardano’s daily transaction count rising another 33% over 24 hours to 32,841 at press time. At press time, the network was processing 0.38 transactions per second, with an average block time of 20.2 seconds.
This surge adds to Cardano’s growing cumulative transaction count. Since its launch in September 2017, the blockchain has processed approximately 123.02 million transactions.
Cardano Maintains Strong Developer Activity
Beyond transaction growth, Cardano continues to demonstrate strong developer activity.
Chainspect currently records 303,143 commits for the network, placing Cardano among the leading blockchain ecosystems by development activity. However, the exact ranking can fluctuate as the underlying data changes.
Polkadot remains ahead with more than 701,000 commits, while Ethereum has recorded over 520,000. Nevertheless, Cardano ranks ahead of several major ecosystems, including Arbitrum and Optimism, which currently have roughly 200,000 and 182,000 commits, respectively. This comes as Cardano continues to work on major projects, including Ouroboros Leios, Hydra, and RealFi.
Cardano DeFi Activity Gains Momentum as ADA Nears $0.21
Meanwhile, Cardano’s DeFi sector has also shown signs of renewed activity, according to data from DeFiLlama.
The network’s total value locked (TVL) has increased 6.05% over the past 24 hours to $58.01 million. Additionally, decentralized exchange volume has climbed 22.42% over the past week to $9.15 million.
These gains come as ADA records a notable price recovery amid a broader market rally. Cardano is currently trading near the $0.21 level. Over the past 24 hours, ADA has surged 13.08% to $0.2082, extending its monthly gains to 21.35%.
Despite the strong recovery, Cardano remains the 15th-largest crypto by market cap, with a valuation of $7.6 billion. At the same time, its trading volume has jumped 52% over the past day to $804.78 million.
The combination of rising transaction activity, sustained developer engagement, stronger DeFi metrics, and ADA’s latest price gains highlights growing momentum across the Cardano ecosystem.
#CryptonewswithJack
"Cardano Network Activity Rises Sharply as Daily Transactions Soar 33% Hit 32,841"
#Cardano has recorded a sharp increase in network activity, with daily transactions climbing significantly over the past 24 hours.
According to data highlighted by blockchain fundamentals platform Chainspect, the network processed more than 24,000 transactions on Wednesday, marking its highest daily throughput of the previous week.
Cardano Transaction Volume Chart
The momentum has continued, with Cardano’s daily transaction count rising another 33% over 24 hours to 32,841 at press time. At press time, the network was processing 0.38 transactions per second, with an average block time of 20.2 seconds.
This surge adds to Cardano’s growing cumulative transaction count. Since its launch in September 2017, the blockchain has processed approximately 123.02 million transactions.
Cardano Maintains Strong Developer Activity
Beyond transaction growth, Cardano continues to demonstrate strong developer activity.
Chainspect currently records 303,143 commits for the network, placing Cardano among the leading blockchain ecosystems by development activity. However, the exact ranking can fluctuate as the underlying data changes.
Polkadot remains ahead with more than 701,000 commits, while Ethereum has recorded over 520,000. Nevertheless, Cardano ranks ahead of several major ecosystems, including Arbitrum and Optimism, which currently have roughly 200,000 and 182,000 commits, respectively. This comes as Cardano continues to work on major projects, including Ouroboros Leios, Hydra, and RealFi.
Cardano DeFi Activity Gains Momentum as ADA Nears $0.21
Meanwhile, Cardano’s DeFi sector has also shown signs of renewed activity, according to data from DeFiLlama.
The network’s total value locked (TVL) has increased 6.05% over the past 24 hours to $58.01 million. Additionally, decentralized exchange volume has climbed 22.42% over the past week to $9.15 million.
These gains come as ADA records a notable price recovery amid a broader market rally. Cardano is currently trading near the $0.21 level. Over the past 24 hours, ADA has surged 13.08% to $0.2082, extending its monthly gains to 21.35%.
Despite the strong recovery, Cardano remains the 15th-largest crypto by market cap, with a valuation of $7.6 billion. At the same time, its trading volume has jumped 52% over the past day to $804.78 million.
The combination of rising transaction activity, sustained developer engagement, stronger DeFi metrics, and ADA’s latest price gains highlights growing momentum across the Cardano ecosystem.
#CryptonewswithJack
According to data highlighted by blockchain fundamentals platform Chainspect, the network processed more than 24,000 transactions on Wednesday, marking its highest daily throughput of the previous week.
Cardano Transaction Volume Chart
The momentum has continued, with Cardano’s daily transaction count rising another 33% over 24 hours to 32,841 at press time. At press time, the network was processing 0.38 transactions per second, with an average block time of 20.2 seconds.
This surge adds to Cardano’s growing cumulative transaction count. Since its launch in September 2017, the blockchain has processed approximately 123.02 million transactions.
Cardano Maintains Strong Developer Activity
Beyond transaction growth, Cardano continues to demonstrate strong developer activity.
Chainspect currently records 303,143 commits for the network, placing Cardano among the leading blockchain ecosystems by development activity. However, the exact ranking can fluctuate as the underlying data changes.
Polkadot remains ahead with more than 701,000 commits, while Ethereum has recorded over 520,000. Nevertheless, Cardano ranks ahead of several major ecosystems, including Arbitrum and Optimism, which currently have roughly 200,000 and 182,000 commits, respectively. This comes as Cardano continues to work on major projects, including Ouroboros Leios, Hydra, and RealFi.
Cardano DeFi Activity Gains Momentum as ADA Nears $0.21
Meanwhile, Cardano’s DeFi sector has also shown signs of renewed activity, according to data from DeFiLlama.
The network’s total value locked (TVL) has increased 6.05% over the past 24 hours to $58.01 million. Additionally, decentralized exchange volume has climbed 22.42% over the past week to $9.15 million.
These gains come as ADA records a notable price recovery amid a broader market rally. Cardano is currently trading near the $0.21 level. Over the past 24 hours, ADA has surged 13.08% to $0.2082, extending its monthly gains to 21.35%.
Despite the strong recovery, Cardano remains the 15th-largest crypto by market cap, with a valuation of $7.6 billion. At the same time, its trading volume has jumped 52% over the past day to $804.78 million.
The combination of rising transaction activity, sustained developer engagement, stronger DeFi metrics, and ADA’s latest price gains highlights growing momentum across the Cardano ecosystem.
#CryptonewswithJack
1
312
Article
"Shiba Inu Team Member Teases Major Announcement From Shytoshi Kusama, Gives Timeline"#Shiba Inu ecosystem team member Vet Kusama has sparked fresh speculation in the SHIB community after hinting that August could bring a major announcement from two prominent figures in the ecosystem.
In a post on X today, Vet Kusama urged the community to stay alert, suggesting that Shytoshi Kusama and Kaal Dhairya could make an announcement before the month ends. He also encouraged Shiba Inu supporters to turn on their notifications so they do not miss the potential development, which he described as “Big News.”
Shytoshi Kusama and Kaal Dhairya Remain Relatively Quiet
Notably, both Shytoshi Kusama and Kaal Dhairya have maintained relatively low profiles on social media throughout much of 2026.
Shytoshi Kusama, the pseudonymous visionary leader associated with the Shiba Inu ecosystem, has largely remained silent on X. His most recent post came on May 13, when he expressed admiration for Dhairya.
Meanwhile, Dhairya has also maintained limited social media activity. His latest referenced X post came on July 25, when he highlighted SHIB’s price surge.
As a result, Vet Kusama’s suggestion that the two developers could soon make an announcement has renewed curiosity among SHIB holders.
R.OS Could Influence Shytoshi’s Next Move
One factor fueling the speculation is Shytoshi Kusama’s apparent shift in focus this year. Rather than remaining highly active in Shiba Inu-related discussions, Kusama has indicated that he has been concentrating on completing R.OS, an independent artificial intelligence project.
His reduced social media presence has consequently raised questions about whether he plans to return to a more prominent role in SHIB development.
However, there is currently no confirmation that the teased announcement will involve R.OS, Shibarium, SHIB, or any other component of the broader ecosystem.
Only 10 Days Remain for the Potential Announcement
Vet Kusama’s comments have also created a sense of urgency as August draws to a close. With just 10 days remaining in the month, members of the SHIB community are increasingly wondering what Kusama and Dhairya might reveal.
However, the nature of the potential announcement remains unclear. Vet Kusama did not provide specific details, while neither Shytoshi Kusama nor Kaal Dhairya has publicly confirmed what they may announce.
Therefore, this speculation should be treated cautiously until the developers provide additional information. For now, Vet Kusama’s comments represent a teaser rather than an official announcement.
#CryptoNewsCommunity
"Shiba Inu Team Member Teases Major Announcement From Shytoshi Kusama, Gives Timeline"
#Shiba Inu ecosystem team member Vet Kusama has sparked fresh speculation in the SHIB community after hinting that August could bring a major announcement from two prominent figures in the ecosystem.
In a post on X today, Vet Kusama urged the community to stay alert, suggesting that Shytoshi Kusama and Kaal Dhairya could make an announcement before the month ends. He also encouraged Shiba Inu supporters to turn on their notifications so they do not miss the potential development, which he described as “Big News.”
Shytoshi Kusama and Kaal Dhairya Remain Relatively Quiet
Notably, both Shytoshi Kusama and Kaal Dhairya have maintained relatively low profiles on social media throughout much of 2026.
Shytoshi Kusama, the pseudonymous visionary leader associated with the Shiba Inu ecosystem, has largely remained silent on X. His most recent post came on May 13, when he expressed admiration for Dhairya.
Meanwhile, Dhairya has also maintained limited social media activity. His latest referenced X post came on July 25, when he highlighted SHIB’s price surge.
As a result, Vet Kusama’s suggestion that the two developers could soon make an announcement has renewed curiosity among SHIB holders.
R.OS Could Influence Shytoshi’s Next Move
One factor fueling the speculation is Shytoshi Kusama’s apparent shift in focus this year. Rather than remaining highly active in Shiba Inu-related discussions, Kusama has indicated that he has been concentrating on completing R.OS, an independent artificial intelligence project.
His reduced social media presence has consequently raised questions about whether he plans to return to a more prominent role in SHIB development.
However, there is currently no confirmation that the teased announcement will involve R.OS, Shibarium, SHIB, or any other component of the broader ecosystem.
Only 10 Days Remain for the Potential Announcement
Vet Kusama’s comments have also created a sense of urgency as August draws to a close. With just 10 days remaining in the month, members of the SHIB community are increasingly wondering what Kusama and Dhairya might reveal.
However, the nature of the potential announcement remains unclear. Vet Kusama did not provide specific details, while neither Shytoshi Kusama nor Kaal Dhairya has publicly confirmed what they may announce.
Therefore, this speculation should be treated cautiously until the developers provide additional information. For now, Vet Kusama’s comments represent a teaser rather than an official announcement.
#CryptoNewsCommunity
In a post on X today, Vet Kusama urged the community to stay alert, suggesting that Shytoshi Kusama and Kaal Dhairya could make an announcement before the month ends. He also encouraged Shiba Inu supporters to turn on their notifications so they do not miss the potential development, which he described as “Big News.”
Shytoshi Kusama and Kaal Dhairya Remain Relatively Quiet
Notably, both Shytoshi Kusama and Kaal Dhairya have maintained relatively low profiles on social media throughout much of 2026.
Shytoshi Kusama, the pseudonymous visionary leader associated with the Shiba Inu ecosystem, has largely remained silent on X. His most recent post came on May 13, when he expressed admiration for Dhairya.
Meanwhile, Dhairya has also maintained limited social media activity. His latest referenced X post came on July 25, when he highlighted SHIB’s price surge.
As a result, Vet Kusama’s suggestion that the two developers could soon make an announcement has renewed curiosity among SHIB holders.
R.OS Could Influence Shytoshi’s Next Move
One factor fueling the speculation is Shytoshi Kusama’s apparent shift in focus this year. Rather than remaining highly active in Shiba Inu-related discussions, Kusama has indicated that he has been concentrating on completing R.OS, an independent artificial intelligence project.
His reduced social media presence has consequently raised questions about whether he plans to return to a more prominent role in SHIB development.
However, there is currently no confirmation that the teased announcement will involve R.OS, Shibarium, SHIB, or any other component of the broader ecosystem.
Only 10 Days Remain for the Potential Announcement
Vet Kusama’s comments have also created a sense of urgency as August draws to a close. With just 10 days remaining in the month, members of the SHIB community are increasingly wondering what Kusama and Dhairya might reveal.
However, the nature of the potential announcement remains unclear. Vet Kusama did not provide specific details, while neither Shytoshi Kusama nor Kaal Dhairya has publicly confirmed what they may announce.
Therefore, this speculation should be treated cautiously until the developers provide additional information. For now, Vet Kusama’s comments represent a teaser rather than an official announcement.
#CryptoNewsCommunity
675
The #Shiba Inu community is highlighting the long-term conviction of a top-50 whale who has held 5 trillion SHIB tokens for over 4 years without a single outflow.
According to data from Arkham, the whale received 5,000,000,058,418 (5 trillion) SHIB from an unlabeled address on November 4, 2021. The transaction came only days after Shiba Inu reached its all-time high of $0.00008845 on October 28, 2021.
At the time, the whale’s SHIB holdings were worth $281.98 million. Today, however, the same holdings are valued at roughly $25.35 million, reflecting a staggering 91.01% decline in dollar value. Despite that dramatic reduction, the whale has apparently refused to sell.
#CryptoNews
Shiba Inu Top 50 Whale Shows Resilience in SHIB
The #Shiba Inu community is highlighting the long-term conviction of a top-50 whale who has held 5 trillion SHIB tokens for over 4 years without a single outflow.
According to data from Arkham, the whale received 5,000,000,058,418 (5 trillion) SHIB from an unlabeled address on November 4, 2021. The transaction came only days after Shiba Inu reached its all-time high of $0.00008845 on October 28, 2021.
At the time, the whale’s SHIB holdings were worth $281.98 million. Today, however, the same holdings are valued at roughly $25.35 million, reflecting a staggering 91.01% decline in dollar value. Despite that dramatic reduction, the whale has apparently refused to sell.
#CryptoNews
Shiba Inu Top 50 Whale Shows Resilience in SHIB
According to data from Arkham, the whale received 5,000,000,058,418 (5 trillion) SHIB from an unlabeled address on November 4, 2021. The transaction came only days after Shiba Inu reached its all-time high of $0.00008845 on October 28, 2021.
At the time, the whale’s SHIB holdings were worth $281.98 million. Today, however, the same holdings are valued at roughly $25.35 million, reflecting a staggering 91.01% decline in dollar value. Despite that dramatic reduction, the whale has apparently refused to sell.
#CryptoNews
Shiba Inu Top 50 Whale Shows Resilience in SHIB
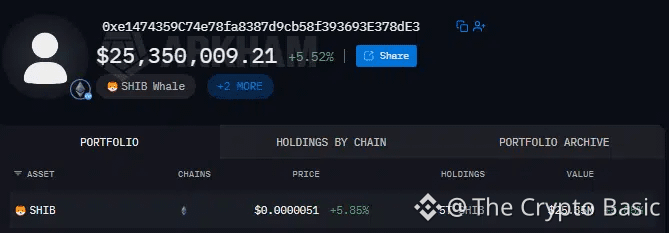
2
742
Article
"XRP Shorts Suffer $33,000,000 Wipeout Amid Price Rebound"#XRP shorts have suffered over $33 million worth of liquidations over the past 24 hours amid the recent XRP price resurgence above $1.30.
As the crypto market rebounds on the back of favorable macroeconomic developments and proposed liquidity injections, XRP has leveraged the upward trend to stage its most impressive rally of the year, securing its spot among the top gainers.
Interestingly, data from Coinglass, a leading market analytics platform, confirms that this recovery push has resulted in increased liquidations for XRP shorts, as investors betting on sustained price declines continue to witness losses in the futures market.
XRP Reclaims $1.30
For context, XRP’s resurgence came later than the rest of the market. While the broader crypto market started seeing gains at the start of the week, XRP only began recovering on Wednesday, Aug. 19, when it posted a massive 10.40% gain.
So far, XRP has recorded some of the largest gains in the market, outperforming Bitcoin (BTC) and nearly every altcoin in the top 100 over the daily and weekly timeframes.
As the upsurge continued, XRP eventually reclaimed the $1.30 price level on Aug. 20 for the first time since early June. The asset has since maintained the rally, hitting a 3-month peak of $1.43 today before pulling back to settle at $1.35 as of press time.
XRP Shorts Record $33M Loss
While bullish investors have benefited from this rally, the upsurge has dealt a blow to XRP shorts. Notably, XRP’s initial upsurge led to increased interest among traders in the derivatives market, with most market participants anticipating a sudden drop and opening short positions.
However, XRP maintained its rally, resulting in massive losses for these short positions. According to Coinglass, XRP shorts have suffered nearly in liquidations over the last four hours. Notably, shorts accounted for over 68% of the total liquidations within this period.
In the 12-hour timeframe, total liquidations amounted to $23.39 million, with shorts recording $15.68 million or 67%. Meanwhile, over the past 24 hours, XRP shorts made up $33.25 million in liquidated value, representing a 60% share of the total $55.2 million.
However, longs have accounted for the greater share in the last hour, amounting to $824,560, a 71% share of the $1.16 million total. This turnaround is due to XRP’s resistance at the $1.43 level today and the recent pullback toward $1.35.
A Spike in Futures Interest
Further data from Coinglass also confirms the latest spike in futures interest. Notably, XRP’s futures volume has surged more than 130% to $14.40 billion at press time, marking a 6-month peak. The last time daily futures volume crossed the $10 billion mark was in February 2026.
In addition to this, open interest has also risen 15.8% to $3.42 billion. Data shows that Binance continues to lead in futures volume, with $4.35 billion. Meanwhile, Bybit comes second with $1.87 billion, while MEXC holds the third spot, having processed $1.81 billion worth of XRP futures volume in the last 24 hours.
#crypto
"XRP Shorts Suffer $33,000,000 Wipeout Amid Price Rebound"
#XRP shorts have suffered over $33 million worth of liquidations over the past 24 hours amid the recent XRP price resurgence above $1.30.
As the crypto market rebounds on the back of favorable macroeconomic developments and proposed liquidity injections, XRP has leveraged the upward trend to stage its most impressive rally of the year, securing its spot among the top gainers.
Interestingly, data from Coinglass, a leading market analytics platform, confirms that this recovery push has resulted in increased liquidations for XRP shorts, as investors betting on sustained price declines continue to witness losses in the futures market.
XRP Reclaims $1.30
For context, XRP’s resurgence came later than the rest of the market. While the broader crypto market started seeing gains at the start of the week, XRP only began recovering on Wednesday, Aug. 19, when it posted a massive 10.40% gain.
So far, XRP has recorded some of the largest gains in the market, outperforming Bitcoin (BTC) and nearly every altcoin in the top 100 over the daily and weekly timeframes.
As the upsurge continued, XRP eventually reclaimed the $1.30 price level on Aug. 20 for the first time since early June. The asset has since maintained the rally, hitting a 3-month peak of $1.43 today before pulling back to settle at $1.35 as of press time.
XRP Shorts Record $33M Loss
While bullish investors have benefited from this rally, the upsurge has dealt a blow to XRP shorts. Notably, XRP’s initial upsurge led to increased interest among traders in the derivatives market, with most market participants anticipating a sudden drop and opening short positions.
However, XRP maintained its rally, resulting in massive losses for these short positions. According to Coinglass, XRP shorts have suffered nearly in liquidations over the last four hours. Notably, shorts accounted for over 68% of the total liquidations within this period.
In the 12-hour timeframe, total liquidations amounted to $23.39 million, with shorts recording $15.68 million or 67%. Meanwhile, over the past 24 hours, XRP shorts made up $33.25 million in liquidated value, representing a 60% share of the total $55.2 million.
However, longs have accounted for the greater share in the last hour, amounting to $824,560, a 71% share of the $1.16 million total. This turnaround is due to XRP’s resistance at the $1.43 level today and the recent pullback toward $1.35.
A Spike in Futures Interest
Further data from Coinglass also confirms the latest spike in futures interest. Notably, XRP’s futures volume has surged more than 130% to $14.40 billion at press time, marking a 6-month peak. The last time daily futures volume crossed the $10 billion mark was in February 2026.
In addition to this, open interest has also risen 15.8% to $3.42 billion. Data shows that Binance continues to lead in futures volume, with $4.35 billion. Meanwhile, Bybit comes second with $1.87 billion, while MEXC holds the third spot, having processed $1.81 billion worth of XRP futures volume in the last 24 hours.
#crypto
As the crypto market rebounds on the back of favorable macroeconomic developments and proposed liquidity injections, XRP has leveraged the upward trend to stage its most impressive rally of the year, securing its spot among the top gainers.
Interestingly, data from Coinglass, a leading market analytics platform, confirms that this recovery push has resulted in increased liquidations for XRP shorts, as investors betting on sustained price declines continue to witness losses in the futures market.
XRP Reclaims $1.30
For context, XRP’s resurgence came later than the rest of the market. While the broader crypto market started seeing gains at the start of the week, XRP only began recovering on Wednesday, Aug. 19, when it posted a massive 10.40% gain.
So far, XRP has recorded some of the largest gains in the market, outperforming Bitcoin (BTC) and nearly every altcoin in the top 100 over the daily and weekly timeframes.
As the upsurge continued, XRP eventually reclaimed the $1.30 price level on Aug. 20 for the first time since early June. The asset has since maintained the rally, hitting a 3-month peak of $1.43 today before pulling back to settle at $1.35 as of press time.
XRP Shorts Record $33M Loss
While bullish investors have benefited from this rally, the upsurge has dealt a blow to XRP shorts. Notably, XRP’s initial upsurge led to increased interest among traders in the derivatives market, with most market participants anticipating a sudden drop and opening short positions.
However, XRP maintained its rally, resulting in massive losses for these short positions. According to Coinglass, XRP shorts have suffered nearly in liquidations over the last four hours. Notably, shorts accounted for over 68% of the total liquidations within this period.
In the 12-hour timeframe, total liquidations amounted to $23.39 million, with shorts recording $15.68 million or 67%. Meanwhile, over the past 24 hours, XRP shorts made up $33.25 million in liquidated value, representing a 60% share of the total $55.2 million.
However, longs have accounted for the greater share in the last hour, amounting to $824,560, a 71% share of the $1.16 million total. This turnaround is due to XRP’s resistance at the $1.43 level today and the recent pullback toward $1.35.
A Spike in Futures Interest
Further data from Coinglass also confirms the latest spike in futures interest. Notably, XRP’s futures volume has surged more than 130% to $14.40 billion at press time, marking a 6-month peak. The last time daily futures volume crossed the $10 billion mark was in February 2026.
In addition to this, open interest has also risen 15.8% to $3.42 billion. Data shows that Binance continues to lead in futures volume, with $4.35 billion. Meanwhile, Bybit comes second with $1.87 billion, while MEXC holds the third spot, having processed $1.81 billion worth of XRP futures volume in the last 24 hours.
#crypto
1
405
Article
The End of This XRP Wave 2 Correction Could Happen “Any Hour Now”#XRP is nearing a turning point after a long decline, with analysts Casi and ChartNerd pointing to key support levels and a possible long-term rise.
Casi: XRP Wave 2 Could End Soon
Analyst Casi believes XRP’s current correction, known as Wave 2, could be ending soon. She said the long decline may be hiding a bullish setup on the long-term chart.
“The end of this Wave 2 correction could quite literally happen any hour now,” she wrote on X.
In her post, Casi told XRP holders to “zoom out” and not let the recent drop make them forget why they were bullish in the first place. She believes that once Wave 2 ends, XRP could enter Wave 3, which could lead to a major rally and possibly new all-time highs.
Casi also said XRP could briefly rally from around $1 before falling again. However, she believes the $1 area has already been tested several times.
XRP chart by Casi
For those looking to buy, she highlighted $1.004 and $0.774 as important support levels, based on Fibonacci analysis. Another key level is around $0.867.
Her main message is that Casi believes the current correction may be close to ending, and XRP could be setting up for a major rally. For context, XRP has already dipped 73% from its $3.66 peak in 2025.
ChartNerd Sees a Final Flush
Another XRP analyst, ChartNerd, is also expecting further weakness before a larger reversal. He said XRP is currently moving through a historical “weakness window” that has appeared during previous midterm U.S. election years.
“August is playing out as expected,” ChartNerd wrote, adding that XRP is now “knees deep” into its weakness window.
The analyst compared the current market structure with the periods between June and September during the 2018 and 2022 cycles, both of which eventually produced major market bottoms.
ChartNerd believes the 2026 market could follow a similar pattern, warning that a final flush of weak hands remains highly likely.
The analysis suggests that XRP’s current weakness does not necessarily invalidate the longer-term bullish thesis. Instead, another decline could complete the corrective structure before the next major advance.
XRP’s Long-Term Targets Reach $27
Meanwhile, ChartNerd has also published a much more ambitious long-term projection for XRP. In a separate analysis, he argued that XRP reaching $8, $13 or even $27 by 2030 could be more realistic than some of the $15 targets that circulated when XRP traded above $1.50 earlier this year.
The accompanying chart uses historical Fibonacci extensions and a time-based fractal to project future XRP targets. It identifies extension zones around $4.85, $13.79 and $27.72, with the highest target corresponding to the 161.8% Fibonacci extension.
ChartNerd stressed that the projections are not certainties, describing them as a “data backed cyclical projection” rather than absolute predictions.
For now, the immediate question remains whether XRP can complete its current Wave 2 correction. If Casi’s analysis plays out, the $1.00 area could be a favorable entry for long-term holders.
#Crypto
The End of This XRP Wave 2 Correction Could Happen “Any Hour Now”
#XRP is nearing a turning point after a long decline, with analysts Casi and ChartNerd pointing to key support levels and a possible long-term rise.
Casi: XRP Wave 2 Could End Soon
Analyst Casi believes XRP’s current correction, known as Wave 2, could be ending soon. She said the long decline may be hiding a bullish setup on the long-term chart.
“The end of this Wave 2 correction could quite literally happen any hour now,” she wrote on X.
In her post, Casi told XRP holders to “zoom out” and not let the recent drop make them forget why they were bullish in the first place. She believes that once Wave 2 ends, XRP could enter Wave 3, which could lead to a major rally and possibly new all-time highs.
Casi also said XRP could briefly rally from around $1 before falling again. However, she believes the $1 area has already been tested several times.
XRP chart by Casi
For those looking to buy, she highlighted $1.004 and $0.774 as important support levels, based on Fibonacci analysis. Another key level is around $0.867.
Her main message is that Casi believes the current correction may be close to ending, and XRP could be setting up for a major rally. For context, XRP has already dipped 73% from its $3.66 peak in 2025.
ChartNerd Sees a Final Flush
Another XRP analyst, ChartNerd, is also expecting further weakness before a larger reversal. He said XRP is currently moving through a historical “weakness window” that has appeared during previous midterm U.S. election years.
“August is playing out as expected,” ChartNerd wrote, adding that XRP is now “knees deep” into its weakness window.
The analyst compared the current market structure with the periods between June and September during the 2018 and 2022 cycles, both of which eventually produced major market bottoms.
ChartNerd believes the 2026 market could follow a similar pattern, warning that a final flush of weak hands remains highly likely.
The analysis suggests that XRP’s current weakness does not necessarily invalidate the longer-term bullish thesis. Instead, another decline could complete the corrective structure before the next major advance.
XRP’s Long-Term Targets Reach $27
Meanwhile, ChartNerd has also published a much more ambitious long-term projection for XRP. In a separate analysis, he argued that XRP reaching $8, $13 or even $27 by 2030 could be more realistic than some of the $15 targets that circulated when XRP traded above $1.50 earlier this year.
The accompanying chart uses historical Fibonacci extensions and a time-based fractal to project future XRP targets. It identifies extension zones around $4.85, $13.79 and $27.72, with the highest target corresponding to the 161.8% Fibonacci extension.
ChartNerd stressed that the projections are not certainties, describing them as a “data backed cyclical projection” rather than absolute predictions.
For now, the immediate question remains whether XRP can complete its current Wave 2 correction. If Casi’s analysis plays out, the $1.00 area could be a favorable entry for long-term holders.
#Crypto
Casi: XRP Wave 2 Could End Soon
Analyst Casi believes XRP’s current correction, known as Wave 2, could be ending soon. She said the long decline may be hiding a bullish setup on the long-term chart.
“The end of this Wave 2 correction could quite literally happen any hour now,” she wrote on X.
In her post, Casi told XRP holders to “zoom out” and not let the recent drop make them forget why they were bullish in the first place. She believes that once Wave 2 ends, XRP could enter Wave 3, which could lead to a major rally and possibly new all-time highs.
Casi also said XRP could briefly rally from around $1 before falling again. However, she believes the $1 area has already been tested several times.
XRP chart by Casi
For those looking to buy, she highlighted $1.004 and $0.774 as important support levels, based on Fibonacci analysis. Another key level is around $0.867.
Her main message is that Casi believes the current correction may be close to ending, and XRP could be setting up for a major rally. For context, XRP has already dipped 73% from its $3.66 peak in 2025.
ChartNerd Sees a Final Flush
Another XRP analyst, ChartNerd, is also expecting further weakness before a larger reversal. He said XRP is currently moving through a historical “weakness window” that has appeared during previous midterm U.S. election years.
“August is playing out as expected,” ChartNerd wrote, adding that XRP is now “knees deep” into its weakness window.
The analyst compared the current market structure with the periods between June and September during the 2018 and 2022 cycles, both of which eventually produced major market bottoms.
ChartNerd believes the 2026 market could follow a similar pattern, warning that a final flush of weak hands remains highly likely.
The analysis suggests that XRP’s current weakness does not necessarily invalidate the longer-term bullish thesis. Instead, another decline could complete the corrective structure before the next major advance.
XRP’s Long-Term Targets Reach $27
Meanwhile, ChartNerd has also published a much more ambitious long-term projection for XRP. In a separate analysis, he argued that XRP reaching $8, $13 or even $27 by 2030 could be more realistic than some of the $15 targets that circulated when XRP traded above $1.50 earlier this year.
The accompanying chart uses historical Fibonacci extensions and a time-based fractal to project future XRP targets. It identifies extension zones around $4.85, $13.79 and $27.72, with the highest target corresponding to the 161.8% Fibonacci extension.
ChartNerd stressed that the projections are not certainties, describing them as a “data backed cyclical projection” rather than absolute predictions.
For now, the immediate question remains whether XRP can complete its current Wave 2 correction. If Casi’s analysis plays out, the $1.00 area could be a favorable entry for long-term holders.
#Crypto
1
2
1.5k
Verified
Shiba Inu’s burn activity has reversed sharply this week after recording one of its strongest performances in months.
Over the past 24 hours, Shiba Inu witnessed the incineration of just 7.10 million SHIB worth approximately $33 at current prices. This dramatic slowdown follows a period of intense burn activity that fueled optimism across the Shiba Inu community.
The latest figures represent a steep decline from the elevated burn levels recorded at the end of July, indicating that the recent momentum has cooled, at least for now.
#CryptoNewsCommunity
Shiba Inu Burn
Shiba Inu’s burn activity has reversed sharply this week after recording one of its strongest performances in months.
Over the past 24 hours, Shiba Inu witnessed the incineration of just 7.10 million SHIB worth approximately $33 at current prices. This dramatic slowdown follows a period of intense burn activity that fueled optimism across the Shiba Inu community.
The latest figures represent a steep decline from the elevated burn levels recorded at the end of July, indicating that the recent momentum has cooled, at least for now.
#CryptoNewsCommunity
Shiba Inu Burn
Over the past 24 hours, Shiba Inu witnessed the incineration of just 7.10 million SHIB worth approximately $33 at current prices. This dramatic slowdown follows a period of intense burn activity that fueled optimism across the Shiba Inu community.
The latest figures represent a steep decline from the elevated burn levels recorded at the end of July, indicating that the recent momentum has cooled, at least for now.
#CryptoNewsCommunity
Shiba Inu Burn

1
915
Article
"Cardano Explodes 12% to Break Above $0.20 After Two Months"#Cardano has reclaimed the psychologically important $0.20 level after spending more than two months trading below that mark.
Notably, Cardano last traded above $0.20 on June 4, 2026. After that, ADA entered a prolonged downtrend that eventually pushed it to a multi-year low of $0.1387. However, buying pressure gradually returned over the past few weeks, setting the stage for a strong breakout.
After weeks of gradual recovery, the token broke through the key level with a 12.13% intraday surge, climbing from $0.1879 to $0.2107. Although it later gave back part of its gains, it has continued to hold above the $0.20 threshold. At press time, ADA was trading around $0.2032, signaling renewed bullish momentum.
Cardano Tops Weekly Performance
The latest rally has pushed Cardano to the top of the weekly performance rankings among the 100 largest cryptocurrencies by market cap.
Over the past seven days, ADA has spiked 20.63%, outperforming several leading altcoins and emerging projects. MemeCore ranked second with a 17.44% increase, while Ethena, Pump.fun, Algorand, and LayerZero followed with gains of 14.38%, 13.81%, and 12.91%, respectively.
Cardano has also maintained strong momentum on the daily timeframe. The token has risen 8.42% over the past 24 hours, making it the second-best-performing cryptocurrency among the top 100 assets during that period.
Cardano Emerges as Top Gainer
Ecosystem Developments Fuel Investor Confidence
It is noteworthy that several developments in the ecosystem have reinforced Cardano’s bullish outlook.
Cardano has officially entered its Dijkstra development era, a new governance phase that allows core development to be funded directly through the community treasury following the successful implementation of the van Rossem hard fork.
Meanwhile, on-chain activity has continued to strengthen. Whale wallets accumulated 240 million ADA in recent days, highlighting growing confidence among large investors. At the same time, Cardano expanded its interoperability by launching a new IBC testnet bridge with Cosmos through Injective, further boosting optimism around the ecosystem’s long-term growth.
In the meantime, investor sentiment has also remained firmly positive despite ADA’s recent volatility. According to CoinMarketCap, Cardano currently ranks as the fifth most bullish cryptocurrency by community sentiment, with a bullish score of 79.4%. Combined with rising whale accumulation, expanding network capabilities, and renewed buying momentum, the positive sentiment has helped support ADA’s return above the critical $0.20 price level.
#CryptoNewss
"Cardano Explodes 12% to Break Above $0.20 After Two Months"
#Cardano has reclaimed the psychologically important $0.20 level after spending more than two months trading below that mark.
Notably, Cardano last traded above $0.20 on June 4, 2026. After that, ADA entered a prolonged downtrend that eventually pushed it to a multi-year low of $0.1387. However, buying pressure gradually returned over the past few weeks, setting the stage for a strong breakout.
After weeks of gradual recovery, the token broke through the key level with a 12.13% intraday surge, climbing from $0.1879 to $0.2107. Although it later gave back part of its gains, it has continued to hold above the $0.20 threshold. At press time, ADA was trading around $0.2032, signaling renewed bullish momentum.
Cardano Tops Weekly Performance
The latest rally has pushed Cardano to the top of the weekly performance rankings among the 100 largest cryptocurrencies by market cap.
Over the past seven days, ADA has spiked 20.63%, outperforming several leading altcoins and emerging projects. MemeCore ranked second with a 17.44% increase, while Ethena, Pump.fun, Algorand, and LayerZero followed with gains of 14.38%, 13.81%, and 12.91%, respectively.
Cardano has also maintained strong momentum on the daily timeframe. The token has risen 8.42% over the past 24 hours, making it the second-best-performing cryptocurrency among the top 100 assets during that period.
Cardano Emerges as Top Gainer
Ecosystem Developments Fuel Investor Confidence
It is noteworthy that several developments in the ecosystem have reinforced Cardano’s bullish outlook.
Cardano has officially entered its Dijkstra development era, a new governance phase that allows core development to be funded directly through the community treasury following the successful implementation of the van Rossem hard fork.
Meanwhile, on-chain activity has continued to strengthen. Whale wallets accumulated 240 million ADA in recent days, highlighting growing confidence among large investors. At the same time, Cardano expanded its interoperability by launching a new IBC testnet bridge with Cosmos through Injective, further boosting optimism around the ecosystem’s long-term growth.
In the meantime, investor sentiment has also remained firmly positive despite ADA’s recent volatility. According to CoinMarketCap, Cardano currently ranks as the fifth most bullish cryptocurrency by community sentiment, with a bullish score of 79.4%. Combined with rising whale accumulation, expanding network capabilities, and renewed buying momentum, the positive sentiment has helped support ADA’s return above the critical $0.20 price level.
#CryptoNewss
Notably, Cardano last traded above $0.20 on June 4, 2026. After that, ADA entered a prolonged downtrend that eventually pushed it to a multi-year low of $0.1387. However, buying pressure gradually returned over the past few weeks, setting the stage for a strong breakout.
After weeks of gradual recovery, the token broke through the key level with a 12.13% intraday surge, climbing from $0.1879 to $0.2107. Although it later gave back part of its gains, it has continued to hold above the $0.20 threshold. At press time, ADA was trading around $0.2032, signaling renewed bullish momentum.
Cardano Tops Weekly Performance
The latest rally has pushed Cardano to the top of the weekly performance rankings among the 100 largest cryptocurrencies by market cap.
Over the past seven days, ADA has spiked 20.63%, outperforming several leading altcoins and emerging projects. MemeCore ranked second with a 17.44% increase, while Ethena, Pump.fun, Algorand, and LayerZero followed with gains of 14.38%, 13.81%, and 12.91%, respectively.
Cardano has also maintained strong momentum on the daily timeframe. The token has risen 8.42% over the past 24 hours, making it the second-best-performing cryptocurrency among the top 100 assets during that period.
Cardano Emerges as Top Gainer
Ecosystem Developments Fuel Investor Confidence
It is noteworthy that several developments in the ecosystem have reinforced Cardano’s bullish outlook.
Cardano has officially entered its Dijkstra development era, a new governance phase that allows core development to be funded directly through the community treasury following the successful implementation of the van Rossem hard fork.
Meanwhile, on-chain activity has continued to strengthen. Whale wallets accumulated 240 million ADA in recent days, highlighting growing confidence among large investors. At the same time, Cardano expanded its interoperability by launching a new IBC testnet bridge with Cosmos through Injective, further boosting optimism around the ecosystem’s long-term growth.
In the meantime, investor sentiment has also remained firmly positive despite ADA’s recent volatility. According to CoinMarketCap, Cardano currently ranks as the fifth most bullish cryptocurrency by community sentiment, with a bullish score of 79.4%. Combined with rising whale accumulation, expanding network capabilities, and renewed buying momentum, the positive sentiment has helped support ADA’s return above the critical $0.20 price level.
#CryptoNewss
222
Article
"XRP Whales Holding 10M to 100M Tokens Add 1.23B XRP in 2026 Despite 43% Price Crash"#XRP has had a difficult 2026, with its price falling 43%. However, whales holding between 10 million and 100 million XRP have continued to build their holdings.
Santiment data shows that this group has added 1.23 billion XRP to its combined balance since the start of the year.
For context, these whales held 10.97 billion XRP at the beginning of 2026. Their combined balance now stands at 12.2 billion XRP, giving them an exact increase of 1.23 billion tokens.
At XRP’s current price of $1.04, the newly added tokens have a value of about $1.2792 billion. At XRP’s all-time high of $3.66, attained in July 2025, these 1.23 billion tokens would be worth $4.5 billion.
XRP Whales Show Erratic Accumulation Trend
The group’s accumulation has followed an uneven pattern since the start of the year. The buying began well before 2026, as these XRP whales added more than 2.4 billion tokens in November 2025 alone despite the price struggles. Their combined balance rose from 8.4 billion XRP to more than 10.8 billion during that month.
The pace then slowed as XRP remained under pressure. Notably, their holdings moved above 11 billion XRP in December 2025 but later slipped slightly to 10.97 billion XRP by the start of 2026. The group stayed mostly quiet until March 2026, when it began a mild but steady accumulation campaign.
This buying continued through the following months. By July 8, 2026, the whales had pushed their combined holdings to a new all-time high of 12.27 billion XRP.
Notably, they have distributed some tokens since then, bringing the balance down gradually to 12.2 billion XRP. Despite the recent decline, their current holdings remain far above the 10.97 billion XRP they held at the start of the year.
More Large Holders Enter the Group
The increase in holdings has not come only from existing whales buying more XRP. On-chain data also shows that more addresses have entered the 10 million-to-100 million XRP range.
Specifically, the group had 301 addresses at the start of 2026. Today, it has 313. The number initially fell to 285 in mid-February before recovering. It then climbed steadily to 322 addresses in early July and later dropped to the current 313.
Despite this year’s increase, the number of addresses remains below the group’s all-time high of 351, which it reached in October 2025. Still, the rise from 301 to 313 addresses shows that the group has expanded since the beginning of the year.
Other XRP Whales Show Different Behavior
Other major XRP holders have behaved differently during the same period. Whales holding between 100 million and 1 billion XRP have cut their combined balance from 8.43 billion XRP at the start of the year to 8.13 billion XRP today. This amounts to a distribution of 300 million XRP in 2026.
Other Major XRP Holders
Meanwhile, whales holding between 1 million and 10 million XRP have moved in the other direction, but their increase has been much smaller. This group has added 260 million XRP to its holdings, taking its combined balance to 3.83 billion XRP today.
The 100,000-to-1-million XRP shark group has also reduced its holdings. Specifically, its combined balance has fallen from 6.43 billion XRP at the beginning of 2026 to 6.37 billion XRP today.
#Crypto
"XRP Whales Holding 10M to 100M Tokens Add 1.23B XRP in 2026 Despite 43% Price Crash"
#XRP has had a difficult 2026, with its price falling 43%. However, whales holding between 10 million and 100 million XRP have continued to build their holdings.
Santiment data shows that this group has added 1.23 billion XRP to its combined balance since the start of the year.
For context, these whales held 10.97 billion XRP at the beginning of 2026. Their combined balance now stands at 12.2 billion XRP, giving them an exact increase of 1.23 billion tokens.
At XRP’s current price of $1.04, the newly added tokens have a value of about $1.2792 billion. At XRP’s all-time high of $3.66, attained in July 2025, these 1.23 billion tokens would be worth $4.5 billion.
XRP Whales Show Erratic Accumulation Trend
The group’s accumulation has followed an uneven pattern since the start of the year. The buying began well before 2026, as these XRP whales added more than 2.4 billion tokens in November 2025 alone despite the price struggles. Their combined balance rose from 8.4 billion XRP to more than 10.8 billion during that month.
The pace then slowed as XRP remained under pressure. Notably, their holdings moved above 11 billion XRP in December 2025 but later slipped slightly to 10.97 billion XRP by the start of 2026. The group stayed mostly quiet until March 2026, when it began a mild but steady accumulation campaign.
This buying continued through the following months. By July 8, 2026, the whales had pushed their combined holdings to a new all-time high of 12.27 billion XRP.
Notably, they have distributed some tokens since then, bringing the balance down gradually to 12.2 billion XRP. Despite the recent decline, their current holdings remain far above the 10.97 billion XRP they held at the start of the year.
More Large Holders Enter the Group
The increase in holdings has not come only from existing whales buying more XRP. On-chain data also shows that more addresses have entered the 10 million-to-100 million XRP range.
Specifically, the group had 301 addresses at the start of 2026. Today, it has 313. The number initially fell to 285 in mid-February before recovering. It then climbed steadily to 322 addresses in early July and later dropped to the current 313.
Despite this year’s increase, the number of addresses remains below the group’s all-time high of 351, which it reached in October 2025. Still, the rise from 301 to 313 addresses shows that the group has expanded since the beginning of the year.
Other XRP Whales Show Different Behavior
Other major XRP holders have behaved differently during the same period. Whales holding between 100 million and 1 billion XRP have cut their combined balance from 8.43 billion XRP at the start of the year to 8.13 billion XRP today. This amounts to a distribution of 300 million XRP in 2026.
Other Major XRP Holders
Meanwhile, whales holding between 1 million and 10 million XRP have moved in the other direction, but their increase has been much smaller. This group has added 260 million XRP to its holdings, taking its combined balance to 3.83 billion XRP today.
The 100,000-to-1-million XRP shark group has also reduced its holdings. Specifically, its combined balance has fallen from 6.43 billion XRP at the beginning of 2026 to 6.37 billion XRP today.
#Crypto
Santiment data shows that this group has added 1.23 billion XRP to its combined balance since the start of the year.
For context, these whales held 10.97 billion XRP at the beginning of 2026. Their combined balance now stands at 12.2 billion XRP, giving them an exact increase of 1.23 billion tokens.
At XRP’s current price of $1.04, the newly added tokens have a value of about $1.2792 billion. At XRP’s all-time high of $3.66, attained in July 2025, these 1.23 billion tokens would be worth $4.5 billion.
XRP Whales Show Erratic Accumulation Trend
The group’s accumulation has followed an uneven pattern since the start of the year. The buying began well before 2026, as these XRP whales added more than 2.4 billion tokens in November 2025 alone despite the price struggles. Their combined balance rose from 8.4 billion XRP to more than 10.8 billion during that month.
The pace then slowed as XRP remained under pressure. Notably, their holdings moved above 11 billion XRP in December 2025 but later slipped slightly to 10.97 billion XRP by the start of 2026. The group stayed mostly quiet until March 2026, when it began a mild but steady accumulation campaign.
This buying continued through the following months. By July 8, 2026, the whales had pushed their combined holdings to a new all-time high of 12.27 billion XRP.
Notably, they have distributed some tokens since then, bringing the balance down gradually to 12.2 billion XRP. Despite the recent decline, their current holdings remain far above the 10.97 billion XRP they held at the start of the year.
More Large Holders Enter the Group
The increase in holdings has not come only from existing whales buying more XRP. On-chain data also shows that more addresses have entered the 10 million-to-100 million XRP range.
Specifically, the group had 301 addresses at the start of 2026. Today, it has 313. The number initially fell to 285 in mid-February before recovering. It then climbed steadily to 322 addresses in early July and later dropped to the current 313.
Despite this year’s increase, the number of addresses remains below the group’s all-time high of 351, which it reached in October 2025. Still, the rise from 301 to 313 addresses shows that the group has expanded since the beginning of the year.
Other XRP Whales Show Different Behavior
Other major XRP holders have behaved differently during the same period. Whales holding between 100 million and 1 billion XRP have cut their combined balance from 8.43 billion XRP at the start of the year to 8.13 billion XRP today. This amounts to a distribution of 300 million XRP in 2026.
Other Major XRP Holders
Meanwhile, whales holding between 1 million and 10 million XRP have moved in the other direction, but their increase has been much smaller. This group has added 260 million XRP to its holdings, taking its combined balance to 3.83 billion XRP today.
The 100,000-to-1-million XRP shark group has also reduced its holdings. Specifically, its combined balance has fallen from 6.43 billion XRP at the beginning of 2026 to 6.37 billion XRP today.
#Crypto
3
431
Log in to explore more content
Join global crypto users on Binance Square
⚡️ Get latest and useful information about crypto.
💬 Trusted by the world’s largest crypto exchange.
👍 Discover real insights from verified creators.
Email / Phone number
Trending Topics
AppleDebutsFoldablePhone
42,105 views
839 Discussing
Apple just dropped the foldable iPhone — and the market is paying attention. This isn't just another product cycle; it's a new product category, a new CEO on stage, and a $1,999 price tag that pushes $AAPL further into ultra-premium territory. Foldables are the narrative, and Apple is now the headline.
#appledebutsfoldablephone #EUExtendsCentralContactPointToCASPs #US10YTreasuryYieldHitsHighestSinceNov2023 #BrentCrudeTops$100 #USTreasuryToBuyBackUpTo$6BLongDatedDebt
KimHotbae
·2 Likes
·2.9k views
TSMCAugustRevenueUp53.3%YoY
8,608 views
262 Discussing
IranSaysReadyToEscalateWarWithUS
11,441 views
269 Discussing