
白先生
722 Posts

白先生
17年入圈,推特投研博主 (X: @Baisircrypto)丨比特币定投玩家丨E卫兵总部创始人

原创之星
Open Trade

ETH Holder
Occasional Trader
6.1 Years
111 Following
2.2K+ Followers
10.0K+ Liked
1 Badges
Posts
Portfolio
All
Quotes
Videos
PINNED
Ethereum and Bitcoin plummet? Don't worry, a rebound is coming!
Last week I predicted that $ETH could be considered divine, as it perfectly predicted the drop to the position of 2660!
Lao Bai made a video, about 4 minutes long, and after watching it, you will have a more comprehensive and clear judgment on the direction of the upcoming market and the trading strategy. #美国非农数据超预期 #比特币波动性 #美股2026预测
Last week I predicted that $ETH could be considered divine, as it perfectly predicted the drop to the position of 2660!
Lao Bai made a video, about 4 minutes long, and after watching it, you will have a more comprehensive and clear judgment on the direction of the upcoming market and the trading strategy. #美国非农数据超预期 #比特币波动性 #美股2026预测
2026.9.7 ETH Intraday Market
Combined with yesterday's view, ETH is currently basically moving in a scenario of "range-bound upward movement, gradually approaching the previous high."
After holding steady around 2500 yesterday, it pulled back up to 2528 today, indicating that the 2480-2500 support is effective and the bullish structure remains intact. The key area to watch next is still 2530-2547. If 2547 is broken, we continue to look for upside; if it is blocked again, then as long as a pullback to 2480-2500 does not break down, it still counts as a normal correction.
So there is no need to rush in now. Wait for a breakout confirmation or a pullback to support before taking action.
Combined with yesterday's view, ETH is currently basically moving in a scenario of "range-bound upward movement, gradually approaching the previous high."
After holding steady around 2500 yesterday, it pulled back up to 2528 today, indicating that the 2480-2500 support is effective and the bullish structure remains intact. The key area to watch next is still 2530-2547. If 2547 is broken, we continue to look for upside; if it is blocked again, then as long as a pullback to 2480-2500 does not break down, it still counts as a normal correction.
So there is no need to rush in now. Wait for a breakout confirmation or a pullback to support before taking action.
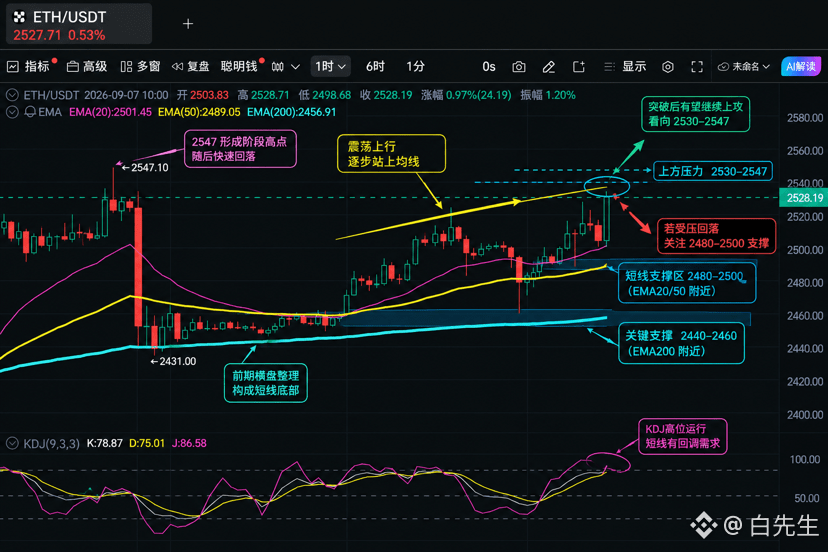
Yesterday, it followed Old Bai’s scripted rehearsal from start to finish—super steady!
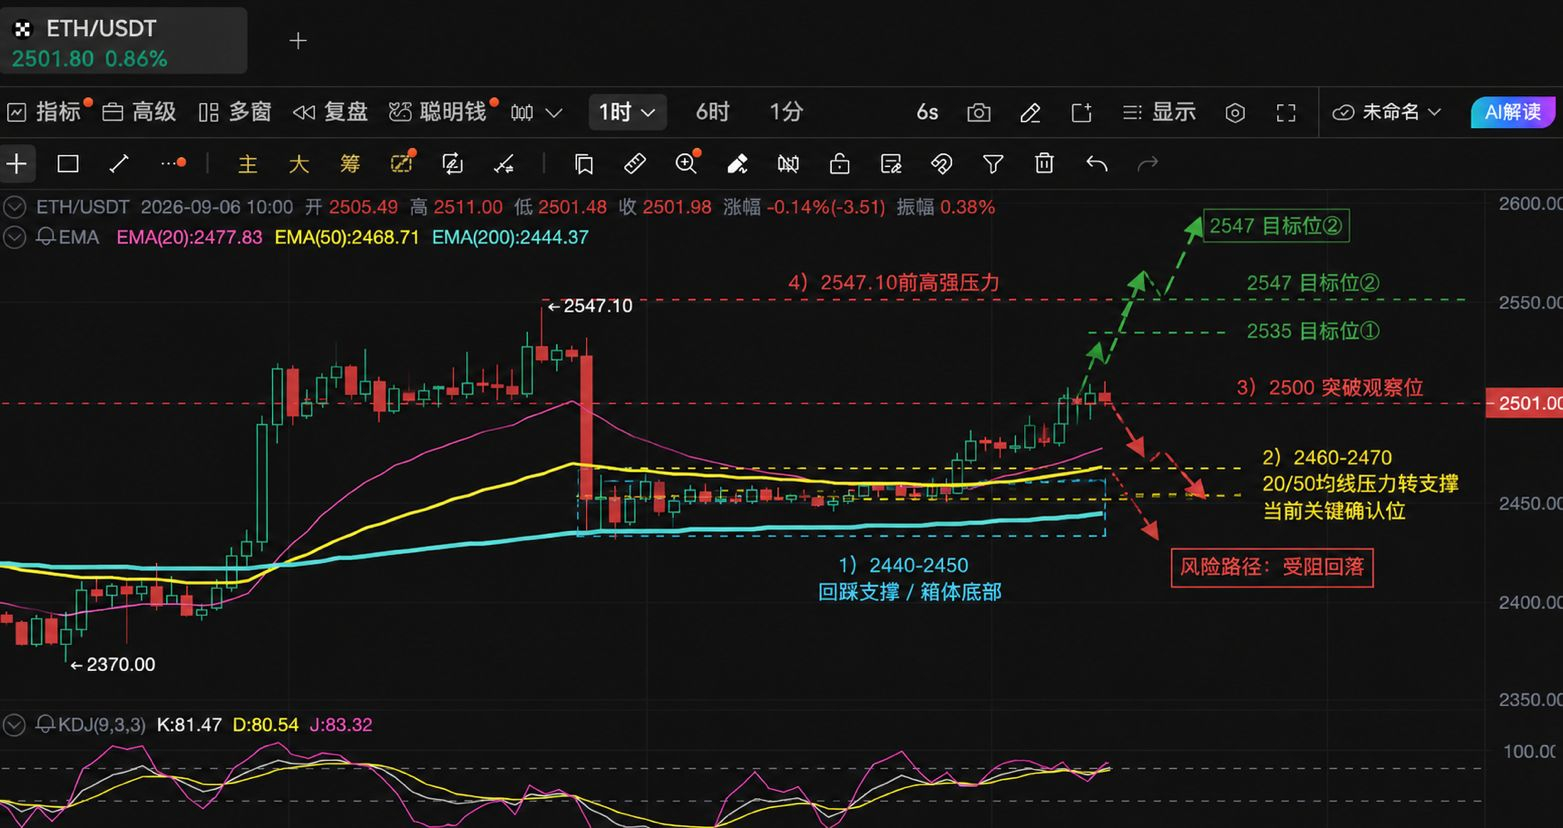
Today ETH, after consolidating around 2450, has climbed back above 2500, and on the 1-hour timeframe a fairly clear breakout structure has already formed.
At the moment, the price is 2501. EMA20 is around 2478, EMA50 around 2469, and EMA200 around 2444. The moving averages have once again lined up in a bullish formation, and the short-term structure has clearly strengthened.
Earlier, the move from 2547 to around 2437 was a rapid dump. After that, ETH did not make a new low; instead, it repeatedly formed a base in the 2440–2470 range.
So now the focus is whether 2500 can hold, and whether 2520 can break through.
If 2520 is decisively broken, there is a good chance price could move to 2547, and the 1-hour structure would upgrade from a mere “rebound” to trend continuation.
On the flip side, if the push above 2500 fails and price falls back below 2470, then this breakout could turn into a false breakout. In that case, we need to watch for a return to the 2440–2450 area.
Today ETH, after consolidating around 2450, has climbed back above 2500, and on the 1-hour timeframe a fairly clear breakout structure has already formed.
At the moment, the price is 2501. EMA20 is around 2478, EMA50 around 2469, and EMA200 around 2444. The moving averages have once again lined up in a bullish formation, and the short-term structure has clearly strengthened.
Earlier, the move from 2547 to around 2437 was a rapid dump. After that, ETH did not make a new low; instead, it repeatedly formed a base in the 2440–2470 range.
So now the focus is whether 2500 can hold, and whether 2520 can break through.
If 2520 is decisively broken, there is a good chance price could move to 2547, and the 1-hour structure would upgrade from a mere “rebound” to trend continuation.
On the flip side, if the push above 2500 fails and price falls back below 2470, then this breakout could turn into a false breakout. In that case, we need to watch for a return to the 2440–2450 area.
白先生
·
--
2026.9.5 ETH Intraday Market
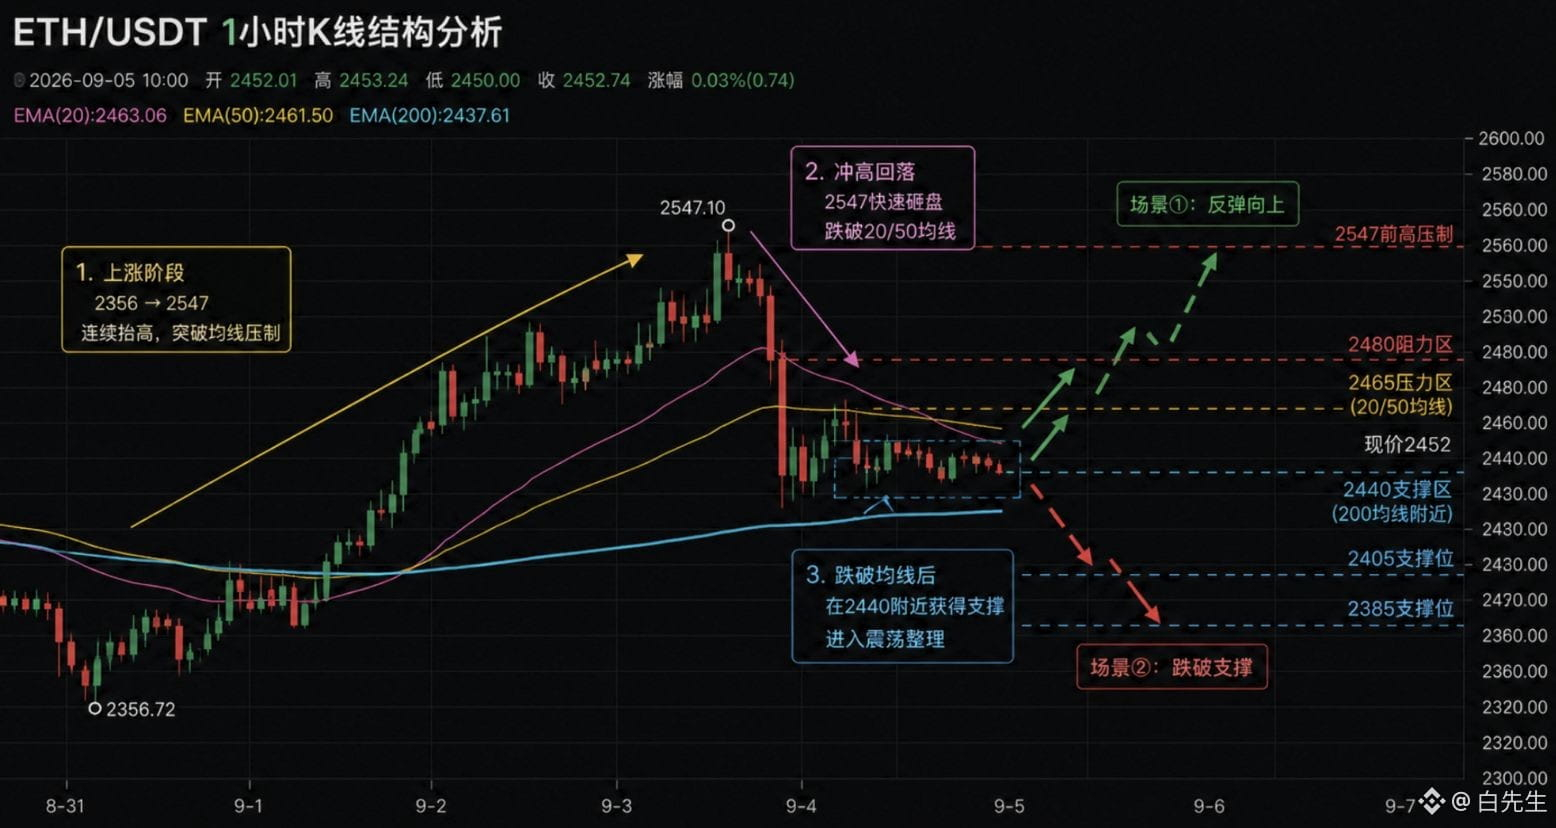
Yesterday's pump and dump felt like another wave of contracts being liquidated. Most likely both longs and shorts got hit. 2356 → surged to 2547 → quickly pulled back → range-bound between 2440 and 2460
What is most worth noting is that after the sharp drop, price did not keep dumping lower, but repeatedly found support around 2440. This suggests there is buying interest there for now. In other words, the short-term price has already fallen below the 20/50 moving averages, but has not yet effectively broken below the 200 moving average
Ideally, it can quickly reclaim 2460–2465 in the short term. Then this decline would look more like a shakeout, and there may later be a chance to retest higher:
2480 → 2500 → 2535–2547
Yesterday's pump and dump felt like another wave of contracts being liquidated. Most likely both longs and shorts got hit. 2356 → surged to 2547 → quickly pulled back → range-bound between 2440 and 2460
What is most worth noting is that after the sharp drop, price did not keep dumping lower, but repeatedly found support around 2440. This suggests there is buying interest there for now. In other words, the short-term price has already fallen below the 20/50 moving averages, but has not yet effectively broken below the 200 moving average
Ideally, it can quickly reclaim 2460–2465 in the short term. Then this decline would look more like a shakeout, and there may later be a chance to retest higher:
2480 → 2500 → 2535–2547
2026.9.5 ETH Intraday Market
Yesterday's pump and dump felt like another wave of contracts being liquidated. Most likely both longs and shorts got hit. 2356 → surged to 2547 → quickly pulled back → range-bound between 2440 and 2460
What is most worth noting is that after the sharp drop, price did not keep dumping lower, but repeatedly found support around 2440. This suggests there is buying interest there for now. In other words, the short-term price has already fallen below the 20/50 moving averages, but has not yet effectively broken below the 200 moving average
Ideally, it can quickly reclaim 2460–2465 in the short term. Then this decline would look more like a shakeout, and there may later be a chance to retest higher:
2480 → 2500 → 2535–2547
Yesterday's pump and dump felt like another wave of contracts being liquidated. Most likely both longs and shorts got hit. 2356 → surged to 2547 → quickly pulled back → range-bound between 2440 and 2460
What is most worth noting is that after the sharp drop, price did not keep dumping lower, but repeatedly found support around 2440. This suggests there is buying interest there for now. In other words, the short-term price has already fallen below the 20/50 moving averages, but has not yet effectively broken below the 200 moving average
Ideally, it can quickly reclaim 2460–2465 in the short term. Then this decline would look more like a shakeout, and there may later be a chance to retest higher:
2480 → 2500 → 2535–2547
2026.9.3 ETH intraday market
Yesterday, ETH’s lowest price already fell to 2368, breaking below the earlier 2383 by another step, which shows that yesterday’s weak structure is indeed continuing.
That means price has moved into a deeper retracement zone within the earlier uptrend. Chasing a short position now no longer offers as comfortable a risk-reward ratio as before.
Based on yesterday’s K-line structure, the short-term trend still faces rebound pressure and a downward shift in the center of gravity. Whether the new low at 2368 can hold will be the key for today.
If 2368 is validly broken to the downside, don’t rush to pick up longs. The next support levels to watch are 2330 → 2300.
This is the most clearly defined rebound resistance zone right now.
Yesterday, ETH’s lowest price already fell to 2368, breaking below the earlier 2383 by another step, which shows that yesterday’s weak structure is indeed continuing.
That means price has moved into a deeper retracement zone within the earlier uptrend. Chasing a short position now no longer offers as comfortable a risk-reward ratio as before.
Based on yesterday’s K-line structure, the short-term trend still faces rebound pressure and a downward shift in the center of gravity. Whether the new low at 2368 can hold will be the key for today.
If 2368 is validly broken to the downside, don’t rush to pick up longs. The next support levels to watch are 2330 → 2300.
This is the most clearly defined rebound resistance zone right now.

2026.9.2 ETH Intraday Thoughts:
After yesterday’s rebound from 2490 failed, the price continued to drift lower all the way. Today, although there were several attempts to rebound, the local highs never managed to break above the previous rebound high. Overall, the market structure remains weak, with lower highs and continually tested lows.
Today, the key focus is the overhead area 2425-2440. If the rebound manages to regain 2425 and then further breaks above 2438, it would indicate that the short-term downtrend is starting to correct, and you could look for 2460 → 2490.
Second is the downside level 2383, which is currently the most critical previous low. But if 2383 is broken convincingly to the downside, then yesterday’s rebound would be basically confirmed as a failure, and the downside could continue to be seen around 2350!
After yesterday’s rebound from 2490 failed, the price continued to drift lower all the way. Today, although there were several attempts to rebound, the local highs never managed to break above the previous rebound high. Overall, the market structure remains weak, with lower highs and continually tested lows.
Today, the key focus is the overhead area 2425-2440. If the rebound manages to regain 2425 and then further breaks above 2438, it would indicate that the short-term downtrend is starting to correct, and you could look for 2460 → 2490.
Second is the downside level 2383, which is currently the most critical previous low. But if 2383 is broken convincingly to the downside, then yesterday’s rebound would be basically confirmed as a failure, and the downside could continue to be seen around 2350!

2026.9.1 ETH intraday market:
Yesterday, ETH bounced back after stabilizing around 2388, reaching a high of 2490, but it still failed to break through 2500.
Today, the price is basically holding around 2450, indicating that yesterday’s rebound did not continue to expand. At the same time, it also has not dropped back below 2400.
From this price action, the market appears to be entering a new short-term consolidation and digestion phase.
In terms of trading ideas today, look at 2490–2500 to the upside. If there is a breakout with increased volume above 2490, and a pullback confirms it does not break, then a long setup could target 2535, with further attention on the previous high.
To the downside, watch 2400–2388. If price continues to range around 2450 and then moves lower to retest 2400, as long as 2400 can hold, you can still wait for a stabilization and rebound.
Overall, the bulls still need more time to repair. It’s not yet the right moment to look for a trend reversal. First, see whether ETH can truly reclaim 2500 and hold it.
Yesterday, ETH bounced back after stabilizing around 2388, reaching a high of 2490, but it still failed to break through 2500.
Today, the price is basically holding around 2450, indicating that yesterday’s rebound did not continue to expand. At the same time, it also has not dropped back below 2400.
From this price action, the market appears to be entering a new short-term consolidation and digestion phase.
In terms of trading ideas today, look at 2490–2500 to the upside. If there is a breakout with increased volume above 2490, and a pullback confirms it does not break, then a long setup could target 2535, with further attention on the previous high.
To the downside, watch 2400–2388. If price continues to range around 2450 and then moves lower to retest 2400, as long as 2400 can hold, you can still wait for a stabilization and rebound.
Overall, the bulls still need more time to repair. It’s not yet the right moment to look for a trend reversal. First, see whether ETH can truly reclaim 2500 and hold it.

2026.8.31 ETH intraday thoughts:
Yesterday, ETH surged from around 2535 and then pulled back. It subsequently moved lower continuously, finally breaking below 2500 and 2450, with the low reaching 2388 early this morning. The price has rebounded to around 2415, but it still hasn’t regained the key moving averages.
In the short term, the outlook is that this is still a pullback. Now 2400 is the battleground between bulls and bears; 2423–2465 is the rebound resistance zone.
So today, don’t rush to bottom-fish just because 2388 has seen a rebound. Keep an eye on whether 2400 holds. If it holds, watch the rebound; if 2465 is reclaimed, the structure will be repaired. If 2388 breaks down, continue to follow the trend and look for further downside.
Yesterday, ETH surged from around 2535 and then pulled back. It subsequently moved lower continuously, finally breaking below 2500 and 2450, with the low reaching 2388 early this morning. The price has rebounded to around 2415, but it still hasn’t regained the key moving averages.
In the short term, the outlook is that this is still a pullback. Now 2400 is the battleground between bulls and bears; 2423–2465 is the rebound resistance zone.
So today, don’t rush to bottom-fish just because 2388 has seen a rebound. Keep an eye on whether 2400 holds. If it holds, watch the rebound; if 2465 is reclaimed, the structure will be repaired. If 2388 breaks down, continue to follow the trend and look for further downside.

2026.8.30 ETH intraday ideas:
After ETH rebounded from 2405, it hasn't truly reclaimed 2500 yet. It’s currently around 2450, and the short-term trend remains relatively weak.
From the 1-hour structure, the most important level right now is 2400-2410.
If around 2460 the price keeps getting pressured, and then it breaks back below 2405 again, then yesterday's low may be retested. After breaking, watch for around 2360.
At the moment, 2450 is in the middle zone. It’s better to wait for a breakout or a pullback confirmation before taking a position, rather than hard-guessing the direction here.
After ETH rebounded from 2405, it hasn't truly reclaimed 2500 yet. It’s currently around 2450, and the short-term trend remains relatively weak.
From the 1-hour structure, the most important level right now is 2400-2410.
If around 2460 the price keeps getting pressured, and then it breaks back below 2405 again, then yesterday's low may be retested. After breaking, watch for around 2360.
At the moment, 2450 is in the middle zone. It’s better to wait for a breakout or a pullback confirmation before taking a position, rather than hard-guessing the direction here.

2026.8.29 ETH intraday market
ETH surged to 2566 last night, but did not continue making new highs. Then a very clear high-volume long bearish candle appeared, dropping directly from around 2500 to 2405.
This indicates that there has already been clear selling pressure in the 2500–2566 range above, and based on the following K-lines, although the price rebounded from 2405, the rebound strength is not strong!
So we’ll first look at the rebound from 2400. The first target is 2460–2480. After a breakout, then look at 2500.
If 2400 is effectively broken to the downside later, it would mean EMA200 has also been lost, and then the downside could further extend to 2360 → 2320
ETH surged to 2566 last night, but did not continue making new highs. Then a very clear high-volume long bearish candle appeared, dropping directly from around 2500 to 2405.
This indicates that there has already been clear selling pressure in the 2500–2566 range above, and based on the following K-lines, although the price rebounded from 2405, the rebound strength is not strong!
So we’ll first look at the rebound from 2400. The first target is 2460–2480. After a breakout, then look at 2500.
If 2400 is effectively broken to the downside later, it would mean EMA200 has also been lost, and then the downside could further extend to 2360 → 2320

2026.8.28 ETH intraday ideas
ETH today continues to trade in a tight range around 2500. After a push up to 2547 and then a pullback, the price did not break down further. Instead, it keeps changing hands at high levels.
The prior upswing has already formed the trend. Now, for several consecutive days, it has been consolidating around 2500, which seems more like it is digesting the earlier profits.
I believe that as long as the EMA20 around 2460 is not effectively broken to the downside, the 4H uptrend structure remains intact.
At the moment, I actually wouldn’t be in a hurry to look for shorts. If there is a breakout above 2547 on increased volume, and a subsequent pullback confirms it does not break, then the next targets would be 2600 → 2700.
ETH today continues to trade in a tight range around 2500. After a push up to 2547 and then a pullback, the price did not break down further. Instead, it keeps changing hands at high levels.
The prior upswing has already formed the trend. Now, for several consecutive days, it has been consolidating around 2500, which seems more like it is digesting the earlier profits.
I believe that as long as the EMA20 around 2460 is not effectively broken to the downside, the 4H uptrend structure remains intact.
At the moment, I actually wouldn’t be in a hurry to look for shorts. If there is a breakout above 2547 on increased volume, and a subsequent pullback confirms it does not break, then the next targets would be 2600 → 2700.

Brother Sun is really a genius—he’s not even listening to the meeting; he’s just busy gossiping.


2026.8.27 ETH intraday thoughts
After the earlier spike and high at 2547, there was no continuous selloff—instead, price repeatedly oscillated in the 2450–2510 range. The overall lows are still trending higher. Currently ETH has returned to around 2500, with the current price about 2502.
If there is a breakout with increased volume above the 2547 prior high, then this sideways consolidation can be understood as accumulation before the breakout, and the short-term upside room will open up further.
On the other hand, if 2500 keeps failing to hold and price continues to pull back lower, then my first support level to watch will be around the EMA20 near 2460.
So whether it’s a pullback that bottoms out near 2460, or a high-volume breakout above 2547, both are relatively better choices for going long in the short term!
After the earlier spike and high at 2547, there was no continuous selloff—instead, price repeatedly oscillated in the 2450–2510 range. The overall lows are still trending higher. Currently ETH has returned to around 2500, with the current price about 2502.
If there is a breakout with increased volume above the 2547 prior high, then this sideways consolidation can be understood as accumulation before the breakout, and the short-term upside room will open up further.
On the other hand, if 2500 keeps failing to hold and price continues to pull back lower, then my first support level to watch will be around the EMA20 near 2460.
So whether it’s a pullback that bottoms out near 2460, or a high-volume breakout above 2547, both are relatively better choices for going long in the short term!
2026.8.26 ETH intraday outlook
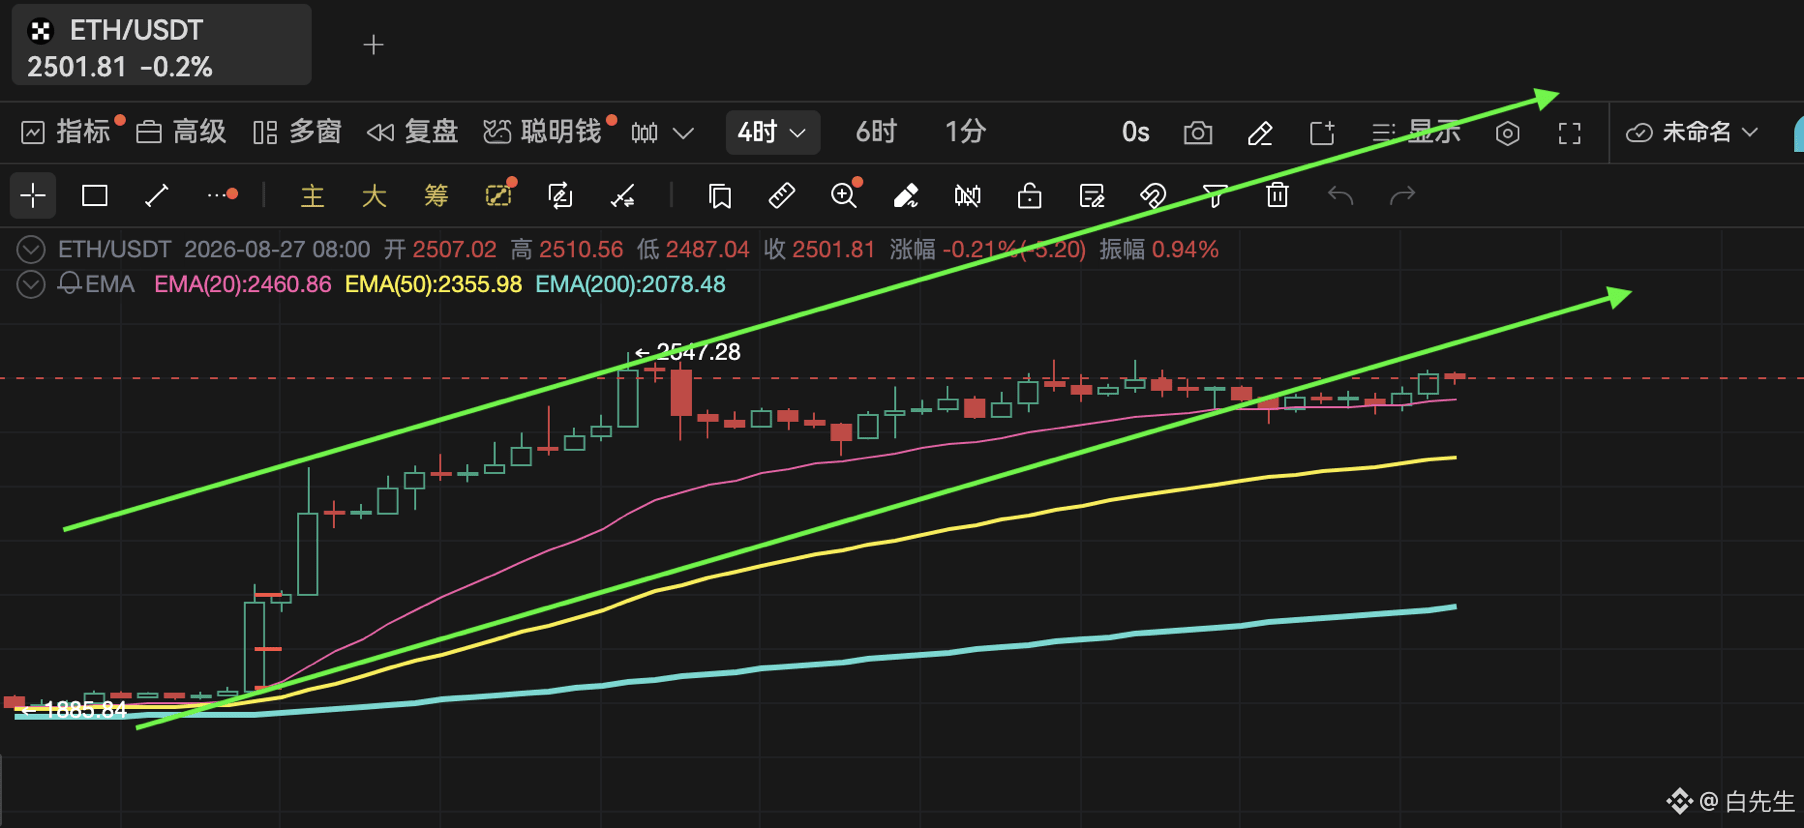
ETH has broken below 2500 and is currently pulling back to around 2460.
Yesterday we said 2500 is the short-term battleground between bulls and bears. Now that price has fallen back below 2500 again, it means the bulls have not yet completed the breakout for the moment.
However, from the 4H structure, we still cannot directly define this as a trend reversal. Next, focus on 2460–2440: the first support.
If price can stabilize and stop the decline there, and then reclaim 2500, there is still a chance to test 2547 again.
If the 4H breaks below 2440 and the rebound fails to get back above 2500, then the pullback may extend further. Downside targets: 2400 → 2380.
ETH has broken below 2500 and is currently pulling back to around 2460.
Yesterday we said 2500 is the short-term battleground between bulls and bears. Now that price has fallen back below 2500 again, it means the bulls have not yet completed the breakout for the moment.
However, from the 4H structure, we still cannot directly define this as a trend reversal. Next, focus on 2460–2440: the first support.
If price can stabilize and stop the decline there, and then reclaim 2500, there is still a chance to test 2547 again.
If the 4H breaks below 2440 and the rebound fails to get back above 2500, then the pullback may extend further. Downside targets: 2400 → 2380.

ETH yesterday after a 4H pullback failed to continue breaking down, and then resumed strength; today it has come to around 2515.
At the moment, focus on two key levels:
2500: the short-term boundary between bulls and bears
2547: prior high resistance
If above 2500 it can continue to hold steadily and break through 2547 with increased volume, then this time won’t be just a simple rebound—there is a chance to open up further upside room. In the short term, look for 2600 → 2650.
At the moment, focus on two key levels:
2500: the short-term boundary between bulls and bears
2547: prior high resistance
If above 2500 it can continue to hold steadily and break through 2547 with increased volume, then this time won’t be just a simple rebound—there is a chance to open up further upside room. In the short term, look for 2600 → 2650.
白先生
·
--
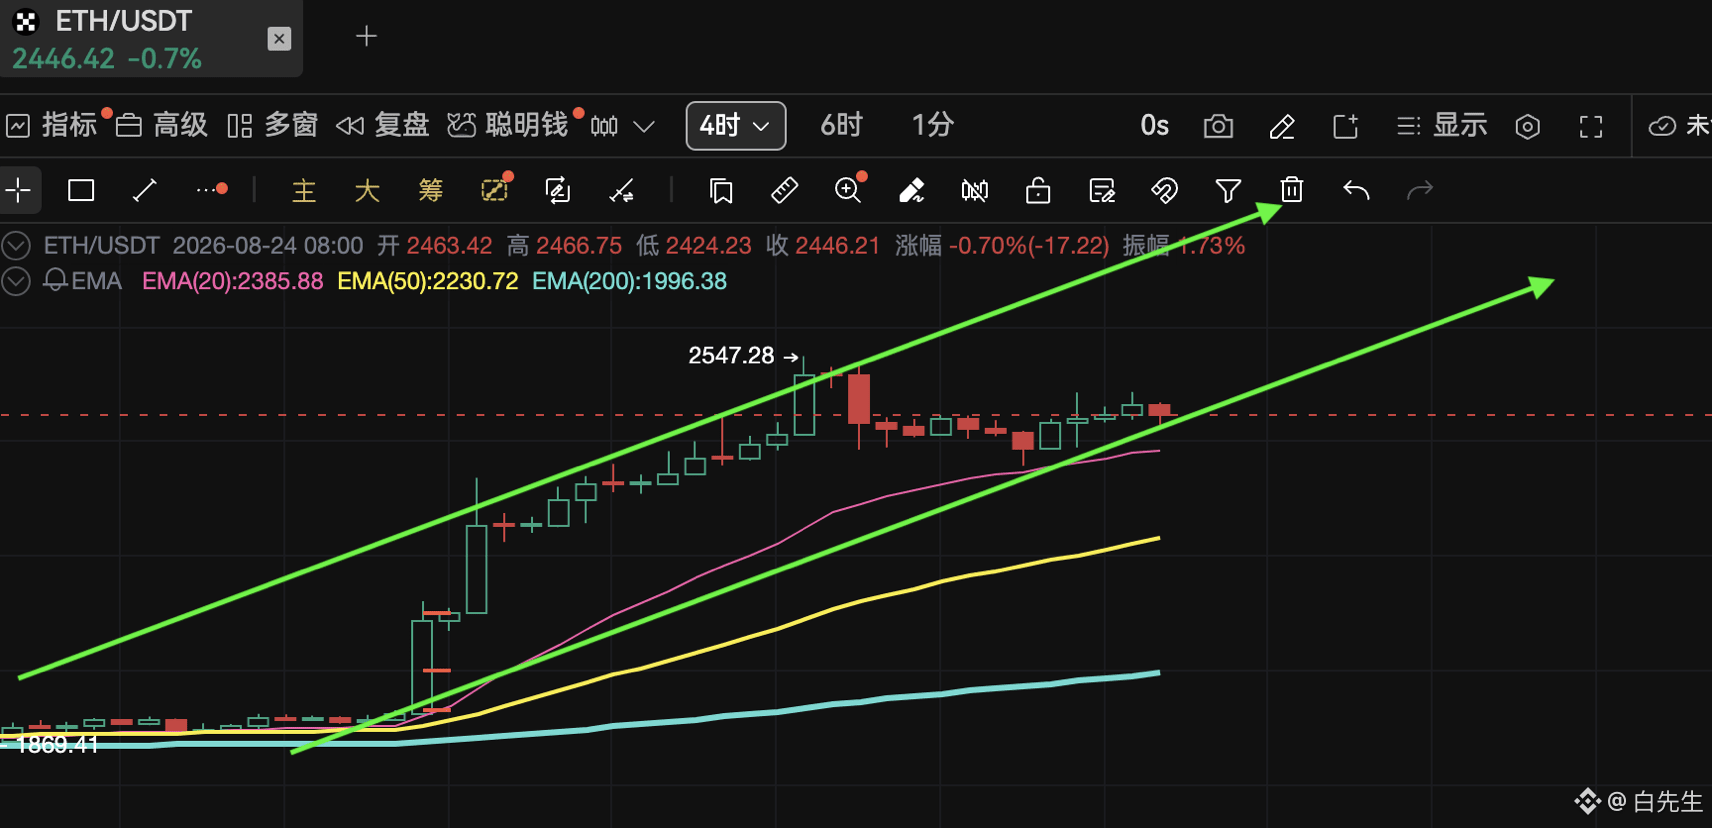
Yesterday I said $ETH to watch and see if it can hold around 2400. Today, I looked: after a pullback, it didn’t keep accelerating downward. Instead, it moved sideways and digested in the 2420–2460 area. After the low point, it started to rise again—there are signs it might be stabilizing!
So for this move, I’m more inclined to expect strength above 2460, and for it to keep improving. If it breaks above 2547 on increased volume, then basically we can continue to look toward around 2600!
So for this move, I’m more inclined to expect strength above 2460, and for it to keep improving. If it breaks above 2547 on increased volume, then basically we can continue to look toward around 2600!
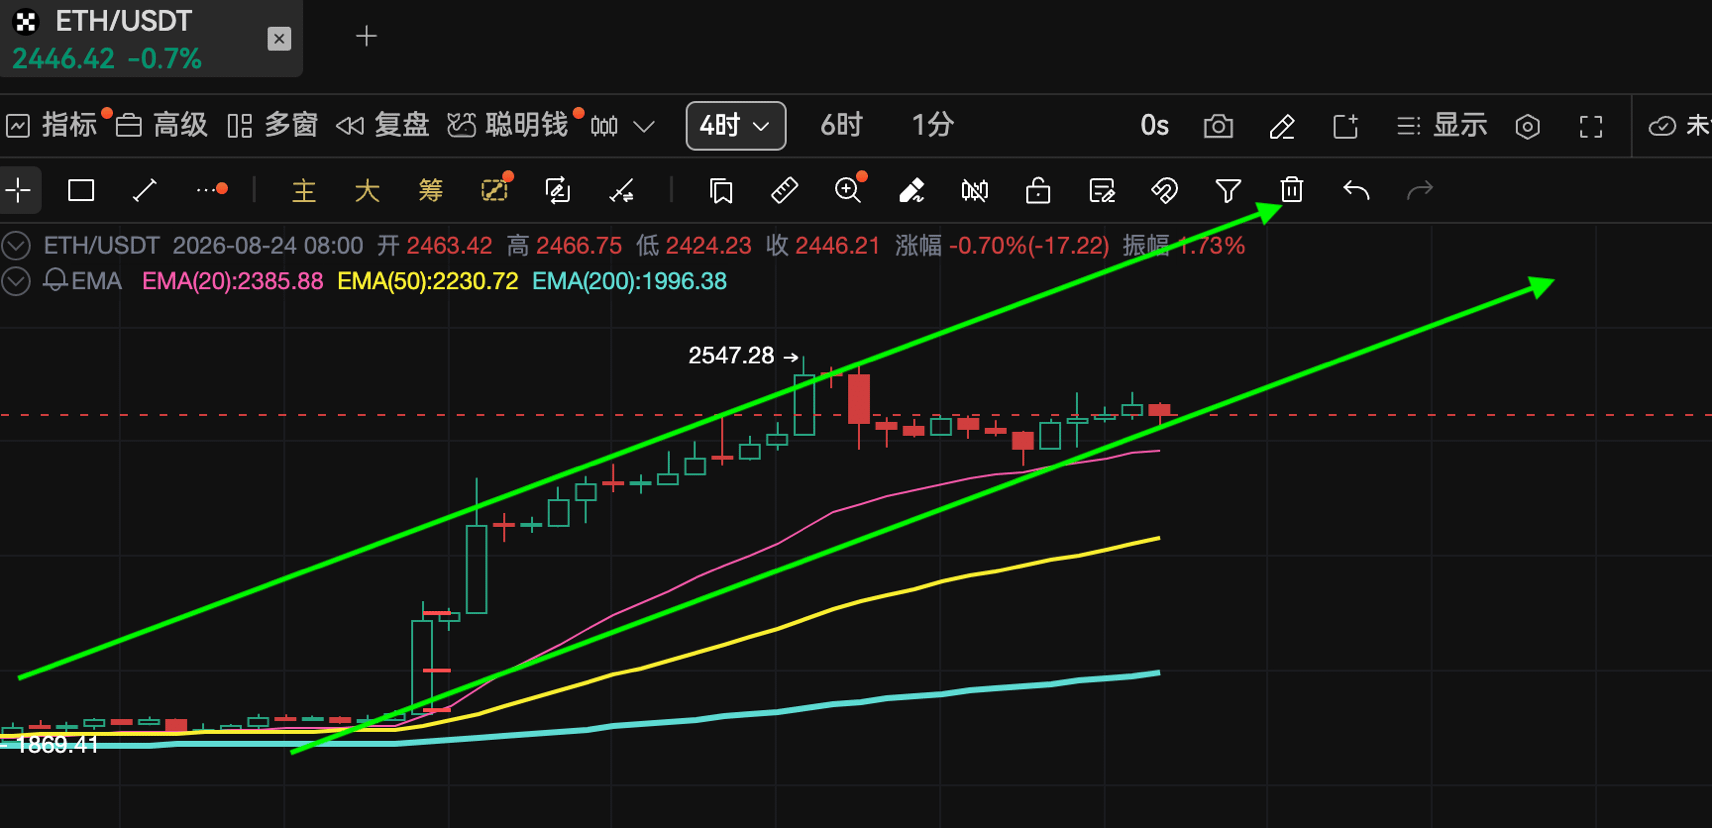
Yesterday I said $ETH to watch and see if it can hold around 2400. Today, I looked: after a pullback, it didn’t keep accelerating downward. Instead, it moved sideways and digested in the 2420–2460 area. After the low point, it started to rise again—there are signs it might be stabilizing!
So for this move, I’m more inclined to expect strength above 2460, and for it to keep improving. If it breaks above 2547 on increased volume, then basically we can continue to look toward around 2600!
So for this move, I’m more inclined to expect strength above 2460, and for it to keep improving. If it breaks above 2547 on increased volume, then basically we can continue to look toward around 2600!
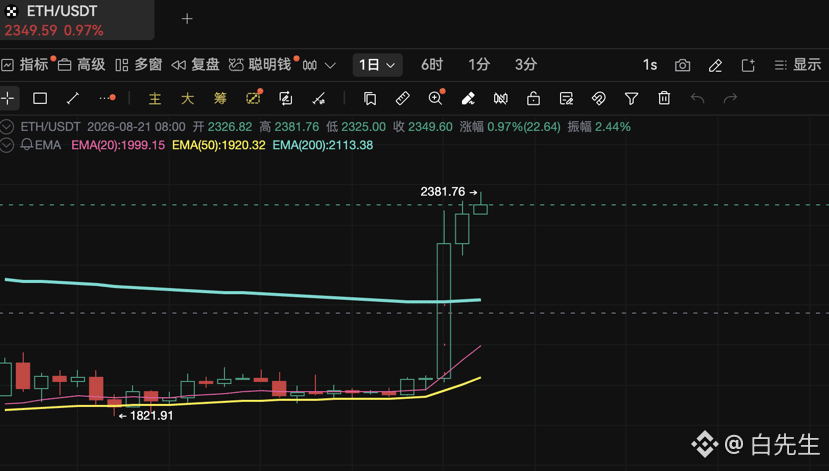
Today, ETH came around 2500. This is not just a breakout above the 200-day line—it’s already three consecutive green candles. Especially in the future, if it pulls back to 2200–2300, or even—at the extreme—back to around 2119 near the 200-day line, as long as it can regain strong support/holding, then from a long-term perspective, this kind of pullback is actually an opportunity to redeploy for the long term.
Looking at the short term: from around 2000 to 2500, the rise has already been very substantial. If it continues with a breakout on increasing volume above 2547, then 2600 will become the next round-number level. If later it retraces from around 2500 back to 2380–2400, but on the 4H chart a fresh stop-falling/stabilization structure appears, then it would actually be a pretty comfortable spot to go long in line with the trend!
So whether long term or short term, there’s no reason to go short. The trend is here. What to do next is simply wait for the market to offer a better price!
Looking at the short term: from around 2000 to 2500, the rise has already been very substantial. If it continues with a breakout on increasing volume above 2547, then 2600 will become the next round-number level. If later it retraces from around 2500 back to 2380–2400, but on the 4H chart a fresh stop-falling/stabilization structure appears, then it would actually be a pretty comfortable spot to go long in line with the trend!
So whether long term or short term, there’s no reason to go short. The trend is here. What to do next is simply wait for the market to offer a better price!

Brothers, we E-guards can finally stand up and make a move at last!
➤ Let’s share a few technical details with the brothers:
🌟 Since ETH broke above the 200-day line two days ago, the daily chart is about to form three consecutive bullish days. It’s currently around 2349, and there’s a fairly clear gap from the 200-day line. This suggests it’s not just a simple pierce-through—after breaking, price is continuing to extend upward. As long as subsequent daily candles can hold above the 200-day line, the earlier bearish structure will basically be broken!
🌟 Three consecutive bullish days by itself is not a sell/short signal, but it does mean the cost-effectiveness of chasing on the short-term is declining. Now that ETH is already far away from the 200-day line, if it keeps rallying continuously, a fast pullback could happen at any time to digest the profit-taking.
🌟 The next round-number levels at 2400 and 2500 are relatively difficult to break in the short term. However, if 2380 can be broken effectively and the pullback doesn’t fail, then this trend move could continue to extend upward.
So from a trader’s perspective, right now the most comfortable trade isn’t chasing because you see good news—it’s waiting for the first decent pullback, then getting in!
➤ Let’s share a few technical details with the brothers:
🌟 Since ETH broke above the 200-day line two days ago, the daily chart is about to form three consecutive bullish days. It’s currently around 2349, and there’s a fairly clear gap from the 200-day line. This suggests it’s not just a simple pierce-through—after breaking, price is continuing to extend upward. As long as subsequent daily candles can hold above the 200-day line, the earlier bearish structure will basically be broken!
🌟 Three consecutive bullish days by itself is not a sell/short signal, but it does mean the cost-effectiveness of chasing on the short-term is declining. Now that ETH is already far away from the 200-day line, if it keeps rallying continuously, a fast pullback could happen at any time to digest the profit-taking.
🌟 The next round-number levels at 2400 and 2500 are relatively difficult to break in the short term. However, if 2380 can be broken effectively and the pullback doesn’t fail, then this trend move could continue to extend upward.
So from a trader’s perspective, right now the most comfortable trade isn’t chasing because you see good news—it’s waiting for the first decent pullback, then getting in!
2026.8.20 ETH intraday trading ideas:
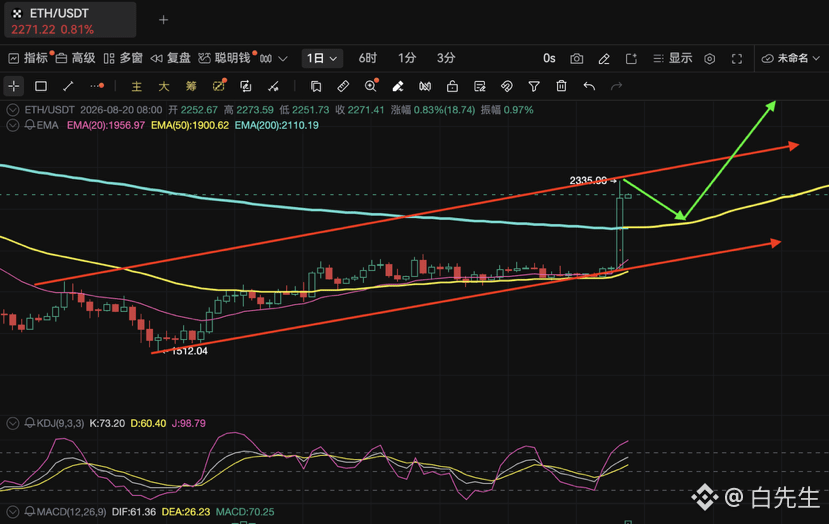
Yesterday we were still watching the pre-1938 high. But last night a single strong bullish candle stood tall (all the way through), and today the momentum keeps accelerating—breaking through the 200-day moving average directly. We’re already around 2260.
The previous resistance levels have been broken one after another, which suggests that the bulls have moved from a range/sideways breakout into a trend-acceleration phase.
At this point, it’s not ideal to chase price directly. Today, focus on 2200–2250 and whether, after the breakout, the 200-day line can turn from resistance into support.
In other words: if price pulls back from the highs but can hold steady around 2200, you can continue to follow the trend for a long bias. The short-term targets are first to look for 2300 → 2350.
If price spikes higher and then quickly drops back below 2200, pay attention to the strength of the pullback. If it falls further back below the 200-day line, that would suggest this breakout may have been a false breakout—then we need to reassess. This possibility exists, but for now there are no signs of it!
Yesterday we were still watching the pre-1938 high. But last night a single strong bullish candle stood tall (all the way through), and today the momentum keeps accelerating—breaking through the 200-day moving average directly. We’re already around 2260.
The previous resistance levels have been broken one after another, which suggests that the bulls have moved from a range/sideways breakout into a trend-acceleration phase.
At this point, it’s not ideal to chase price directly. Today, focus on 2200–2250 and whether, after the breakout, the 200-day line can turn from resistance into support.
In other words: if price pulls back from the highs but can hold steady around 2200, you can continue to follow the trend for a long bias. The short-term targets are first to look for 2300 → 2350.
If price spikes higher and then quickly drops back below 2200, pay attention to the strength of the pullback. If it falls further back below the 200-day line, that would suggest this breakout may have been a false breakout—then we need to reassess. This possibility exists, but for now there are no signs of it!

Log in to explore more content