
MAYA_
40.8k Posts

MAYA_
 Square Verified+
Alhamdulillah always and forever.
Frequent Trader
3.9 Years
1.1K+ Following
42.6K+ Followers
199.3K+ Liked
Posts
All
Quotes
Videos
Live
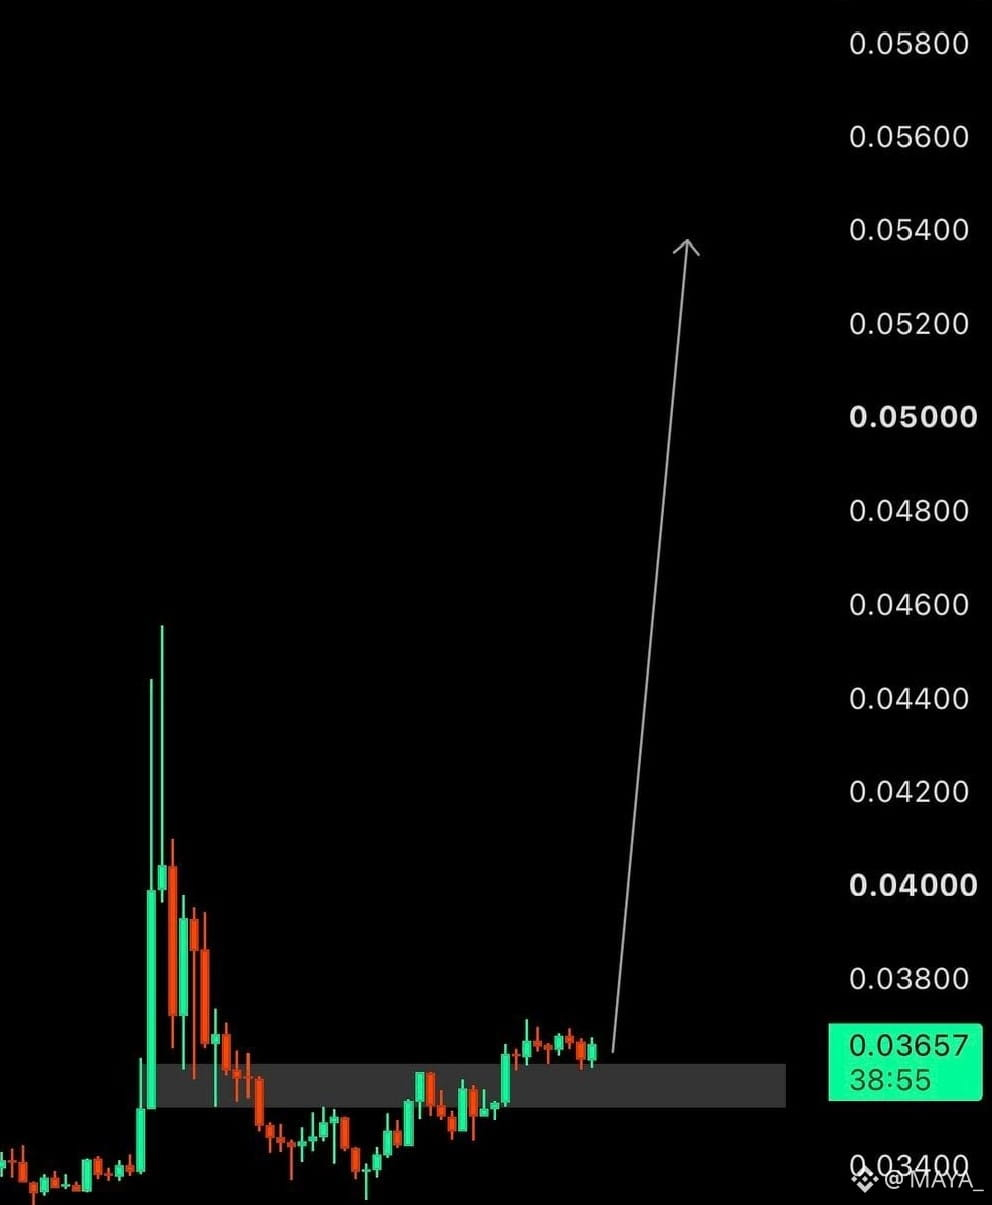
$TNSR is starting to consolidate right above its key support zone after that recent sharp pull back. Momentum seems to be slowly picking up as buyers defend this demand level around 0.036. If the breakout narrative gains traction, we could see a quick retest toward higher levels, though tight stop losses are essential here. DYOR as market conditions stay volatile.
Trading Setup 🚀🚀🚀
Entry: 0.03657 TP1: 0.04200 TP2: 0.05400 Stop Loss: 0.03400
Trading Setup 🚀🚀🚀
Entry: 0.03657 TP1: 0.04200 TP2: 0.05400 Stop Loss: 0.03400
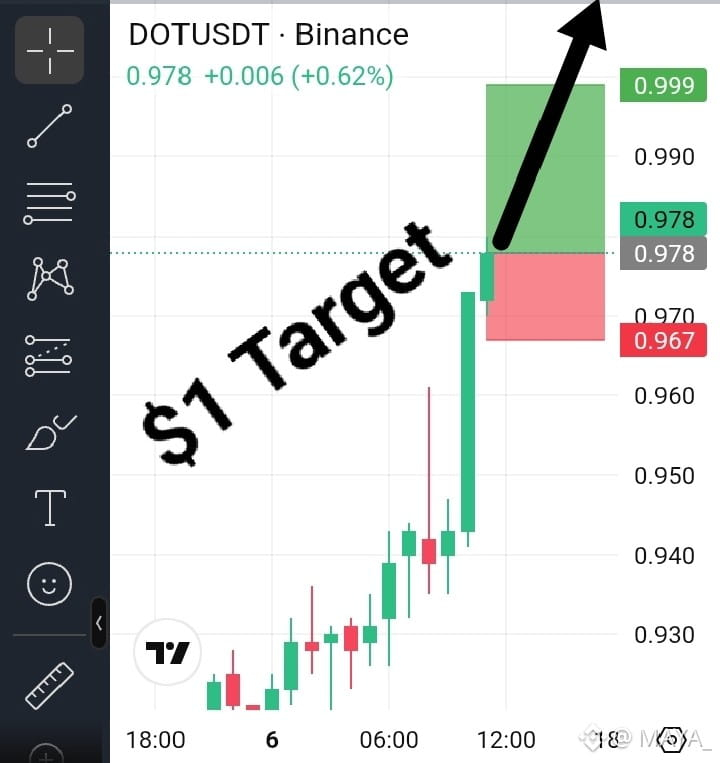
$DOT is showing massive momentum on the hourly chart, printing a clean breakout green candle and flirting right around the $0.978 resistance level. Volume is stepping in strong, indicating buyers are in full control and eyeing that psychological $1 milestone. If this momentum holds without a sharp rejection, we could see a quick push past $0.999, though chasing vertical moves always carries pullback risk. Not financial advice, keep your stop tight and stay sharp.
Trading Setup : long🚀🚀🚀
Entry: 0.978
TP1: 0.988
TP2: 0.999
TP3 : 1+
Stop Loss: 0.967.
Trading Setup : long🚀🚀🚀
Entry: 0.978
TP1: 0.988
TP2: 0.999
TP3 : 1+
Stop Loss: 0.967.
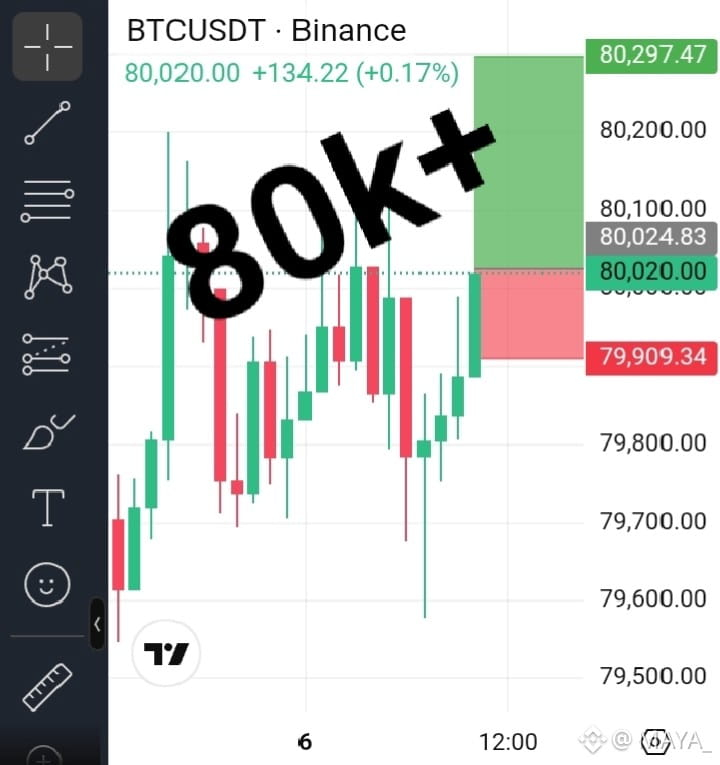
wow $BTC 80k 💥💥💥
BTC is quietly pushing back above 80k after absorbing all that sell pressure near the range lows. Buyers are stepping in as momentum turns bullish on the lower timeframe. If liquidity stays solid, we might see a quick squeeze toward recent highs, but keep an eye on risk since volatility is still high. Not financial advice, do your own research.
Trading Setup : Long
Entry: 80,020
TP1: 80,150
TP2: 80,297
Stop Loss: 79,909.
BTC is quietly pushing back above 80k after absorbing all that sell pressure near the range lows. Buyers are stepping in as momentum turns bullish on the lower timeframe. If liquidity stays solid, we might see a quick squeeze toward recent highs, but keep an eye on risk since volatility is still high. Not financial advice, do your own research.
Trading Setup : Long
Entry: 80,020
TP1: 80,150
TP2: 80,297
Stop Loss: 79,909.
#Near
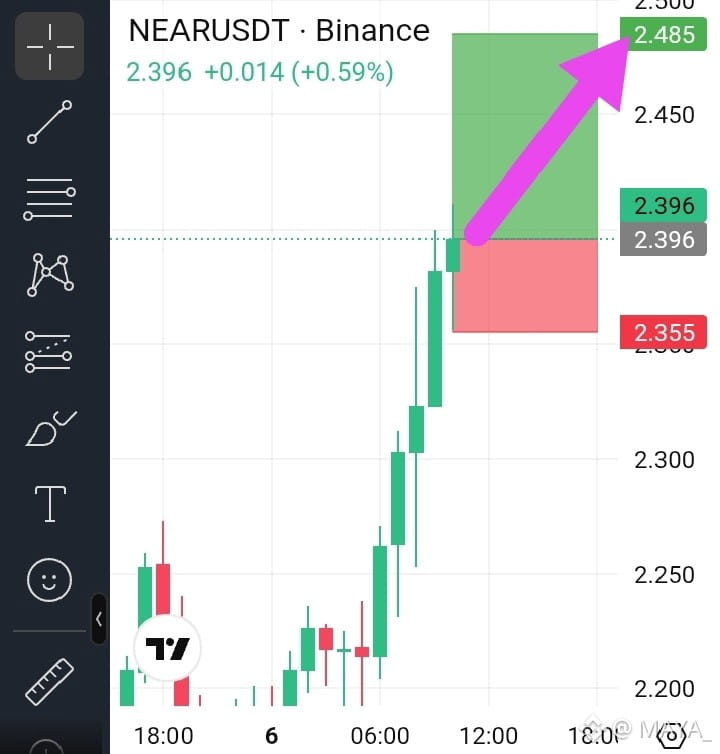
Trade Setup : LONG.🚀💥
Entry: 2.396
TP1: 2.450
TP2: 2.485
Stop Loss: 2.355
$NEAR is moving fast after reclaiming the 2.30 area, and the momentum is hard to ignore. Price is now around 2.396 after a strong push, with volume reaching 30M+ NEAR. The interesting part is whether buyers can keep this move alive or if this becomes another liquidity grab near the recent high. I’d rather watch the reaction than chase it.
Trade Setup : LONG.🚀💥
Entry: 2.396
TP1: 2.450
TP2: 2.485
Stop Loss: 2.355
$NEAR is moving fast after reclaiming the 2.30 area, and the momentum is hard to ignore. Price is now around 2.396 after a strong push, with volume reaching 30M+ NEAR. The interesting part is whether buyers can keep this move alive or if this becomes another liquidity grab near the recent high. I’d rather watch the reaction than chase it.
#ARB
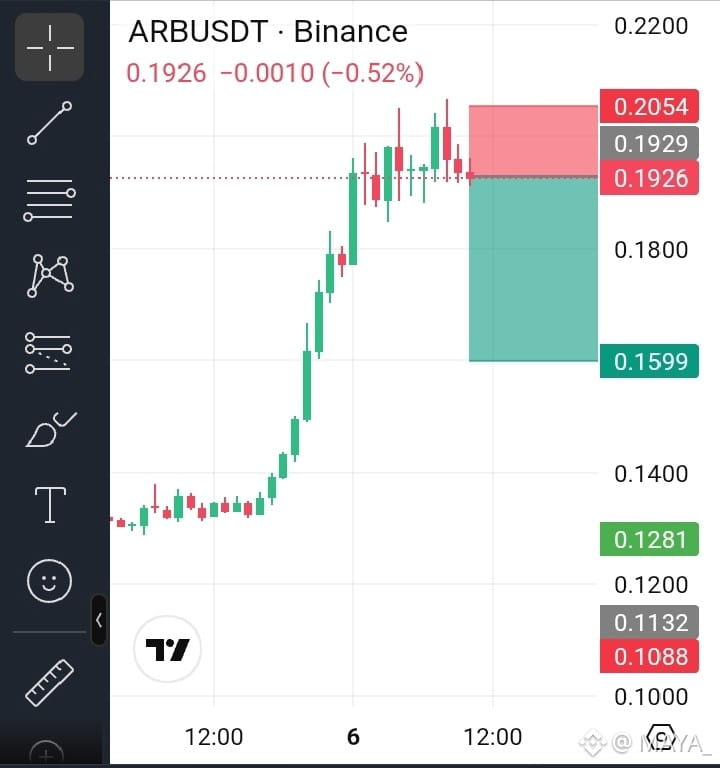
Trade Setup : SHORT
Entry: 0.1929
TP1: 0.1800
TP2: 0.1599
Stop Loss: 0.2054.
$ARB looks overheated after a sharp +43% move, with 24h volume around 624M ARB. Price is now stalling near 0.193 after pushing into the 0.20 area. Momentum is still strong, but this is where liquidity can get tricky. I’m watching for rejection before chasing. If sellers step in, a pullback toward the lower levels looks possible.
Trade Setup : SHORT
Entry: 0.1929
TP1: 0.1800
TP2: 0.1599
Stop Loss: 0.2054.
$ARB looks overheated after a sharp +43% move, with 24h volume around 624M ARB. Price is now stalling near 0.193 after pushing into the 0.20 area. Momentum is still strong, but this is where liquidity can get tricky. I’m watching for rejection before chasing. If sellers step in, a pullback toward the lower levels looks possible.
#ZECHitsANewAllTimeHigh
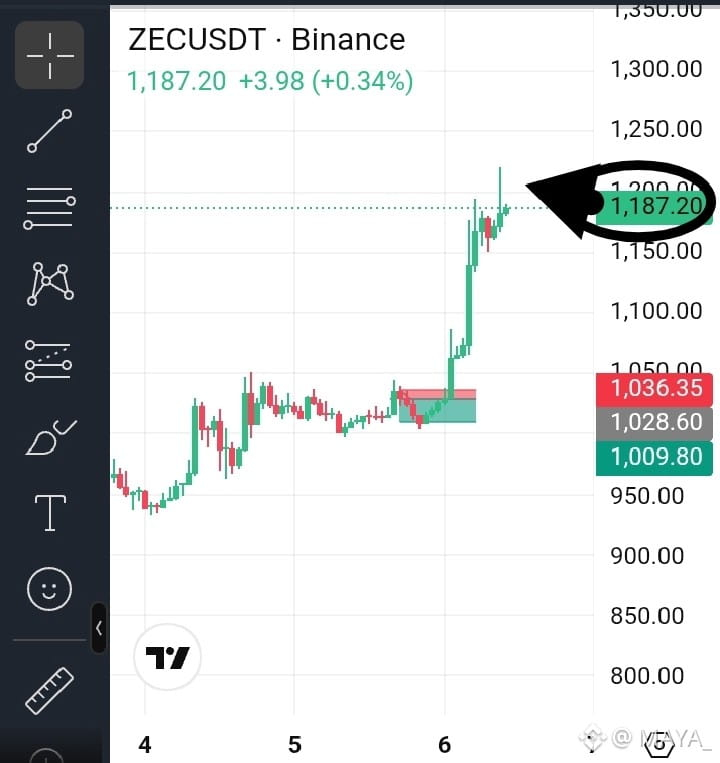
How did $ZEC get here so quickly? Looking at the chart feels a bit strange..... because the bounce didn't look all that strong when it first started.
Then, as the price gradually climbed, it paused near that crucial Fibonacci level. That’s exactly where my attention is fixed. Usually, the market becomes indecisive at a point like this—will there be a breakout, or was the initial bounce just a move to sweep liquidity?
But ZEC didn't stop this time. Instead, it pushed past the hesitation around that level and hit a new all-time high. One thought comes to mind here... those who got scared and exited earlier are likely just watching the chart now. Meanwhile, for many who were waiting for the breakout, entering the market doesn't feel easy anymore. Everyone turns bullish after a new high is set, yet that is precisely when the market sometimes pulls its most unpredictable moves.
There’s another aspect, too: seeing a move like this makes you think, "Maybe there won't be a pullback this time." That very thought can be dangerous.
I’d rather see how long ZEC holds above the new high. Is the reaction above the Fibonacci level demonstrating genuine strength, or will it eventually turn out to be nothing more than a well-crafted trap?
Because hitting a new high is one thing..... sustaining it is a completely different story.
How did $ZEC get here so quickly? Looking at the chart feels a bit strange..... because the bounce didn't look all that strong when it first started.
Then, as the price gradually climbed, it paused near that crucial Fibonacci level. That’s exactly where my attention is fixed. Usually, the market becomes indecisive at a point like this—will there be a breakout, or was the initial bounce just a move to sweep liquidity?
But ZEC didn't stop this time. Instead, it pushed past the hesitation around that level and hit a new all-time high. One thought comes to mind here... those who got scared and exited earlier are likely just watching the chart now. Meanwhile, for many who were waiting for the breakout, entering the market doesn't feel easy anymore. Everyone turns bullish after a new high is set, yet that is precisely when the market sometimes pulls its most unpredictable moves.
There’s another aspect, too: seeing a move like this makes you think, "Maybe there won't be a pullback this time." That very thought can be dangerous.
I’d rather see how long ZEC holds above the new high. Is the reaction above the Fibonacci level demonstrating genuine strength, or will it eventually turn out to be nothing more than a well-crafted trap?
Because hitting a new high is one thing..... sustaining it is a completely different story.
#OP
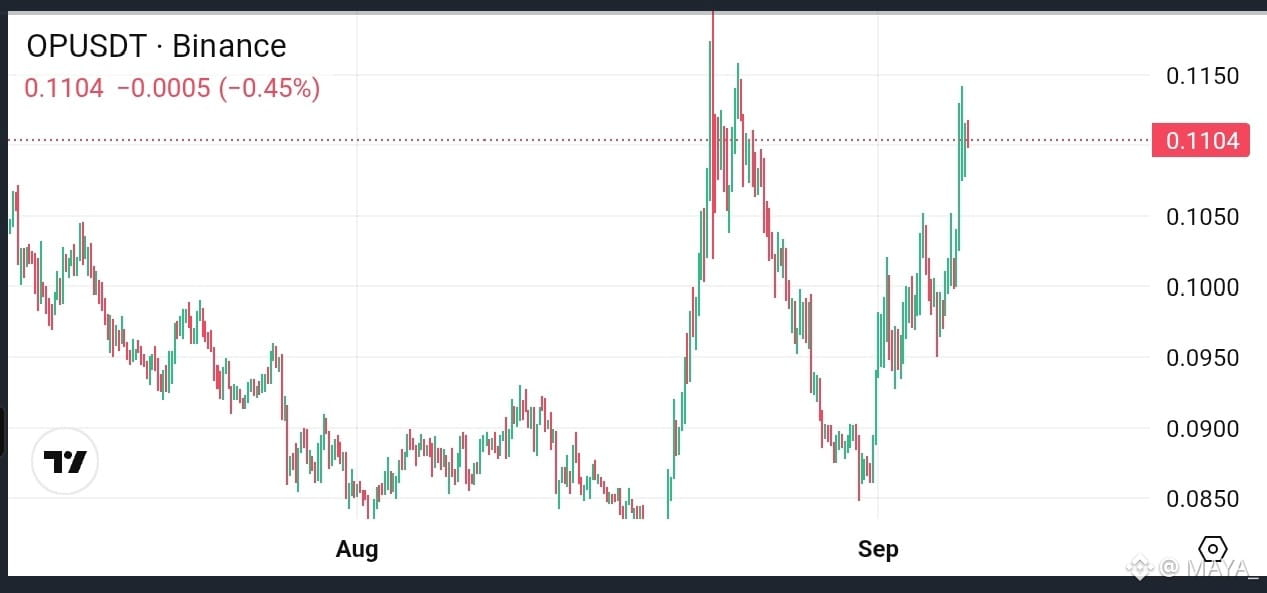
$OP is back at the 0.108–0.111 zone, and this area is getting interesting again. It was strong support back in May-June before the breakdown. Price lost it, fell to 0.068, recovered, and now we’re testing the same zone from below around 0.1109.
The main thing I’m watching is 0.113. If OP gets a clean 4H close above it, I’d consider that a real sign the zone is flipping back into support. Then 0.14 and 0.18 come into focus.
Until that happens, though, this is still resistance. I wouldn’t chase the move here.
$OP is back at the 0.108–0.111 zone, and this area is getting interesting again. It was strong support back in May-June before the breakdown. Price lost it, fell to 0.068, recovered, and now we’re testing the same zone from below around 0.1109.
The main thing I’m watching is 0.113. If OP gets a clean 4H close above it, I’d consider that a real sign the zone is flipping back into support. Then 0.14 and 0.18 come into focus.
Until that happens, though, this is still resistance. I wouldn’t chase the move here.
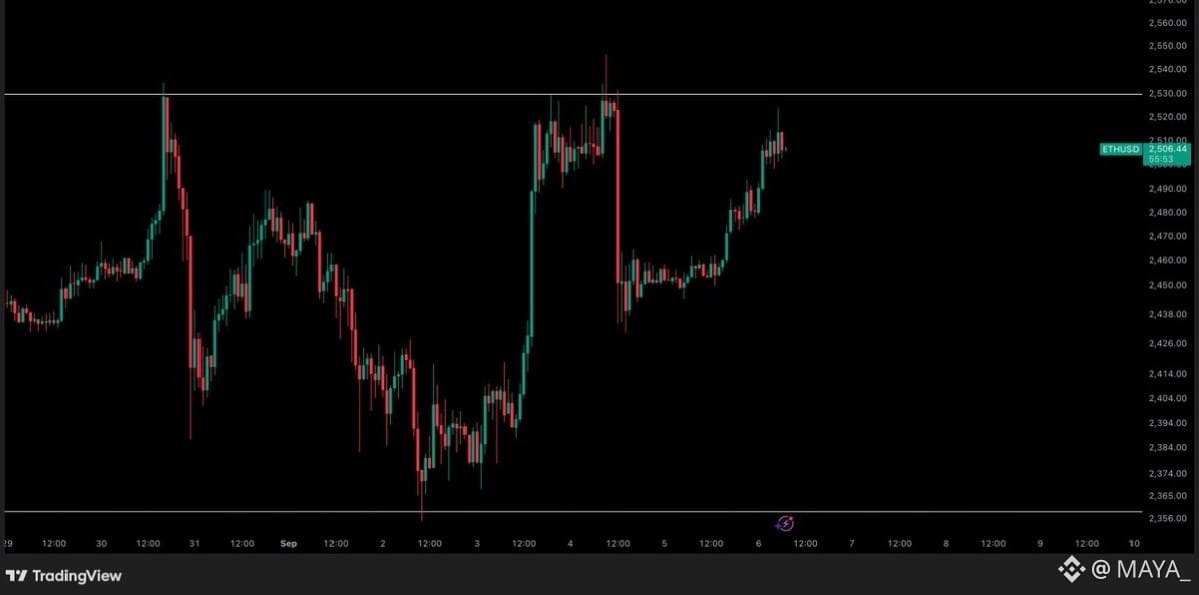
$ETH - that gap got filled yesterday, pretty much as expected.
Honestly, this was a nice move to catch. The reaction around the gap was clean, and the setup played out without needing to overcomplicate it. Sometimes the best trades are simply about waiting for the level to come into play and letting price do its thing.
Honestly, this was a nice move to catch. The reaction around the gap was clean, and the setup played out without needing to overcomplicate it. Sometimes the best trades are simply about waiting for the level to come into play and letting price do its thing.
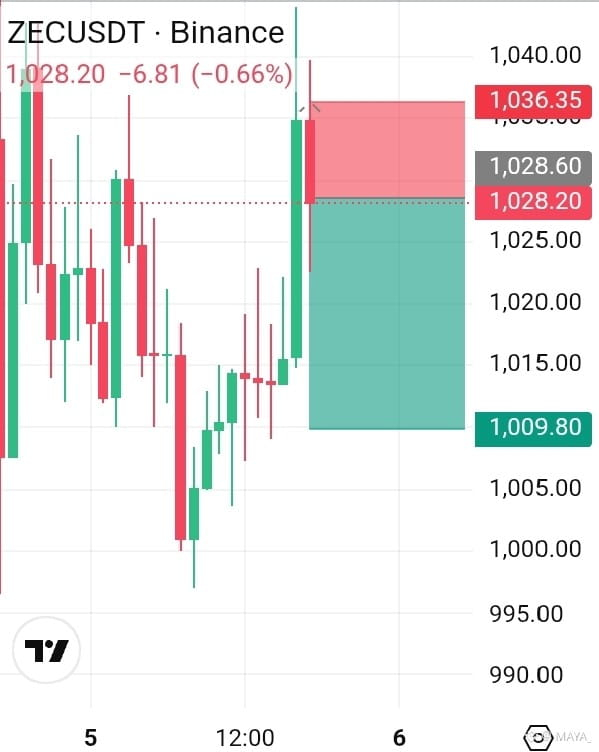
$ZEC /USDT SELL SETUP 📉
Entry 1: 1028
Entry 2: 1040
Take Profit Targets:
📈TP1: 1030
📈TP2: 1015
📈TP3: 1000
Stop Loss: 1070
Leverage : Cross 50X
Trade safely & manage your risk.
Entry 1: 1028
Entry 2: 1040
Take Profit Targets:
📈TP1: 1030
📈TP2: 1015
📈TP3: 1000
Stop Loss: 1070
Leverage : Cross 50X
Trade safely & manage your risk.
Verified
#LululemonTumbles20%OnWeakGuidance
20% drop in Lululemon’s stock made me think the story was simply about weak guidance. But the more I looked at the headline, the more one thing stood out to me: guidance can change how the market looks at a company’s near-term position very quickly.
The interesting part is that the reaction is much larger than the headline itself might suggest. A 20% move means investors were not just reacting to a small change in expectations. At least, that’s how I read the market’s immediate response. And this is where I find the situation interesting. When guidance comes in weaker than expected, the focus naturally shifts from what a company has already achieved to what people think comes next. Suddenly, previous performance matters a little less, while the outlook becomes the main thing everyone is watching.
I also think it’s easy to look at a move like this and immediately assume the market has decided something permanently. But that’s probably too simple. A sharp reaction tells us what the market thinks about the information right now, not necessarily what the longer-term picture will look like.
Still, a 20% decline is difficult to ignore.
It makes me wonder how much of the move is really about Lululemon itself and how much is about expectations that had already been built into the stock before the guidance changed.
That distinction matters.
Because sometimes the surprising part isn't the bad number itself. It’s realizing how much confidence was already sitting in the price beforehand.
Maybe that’s the part worth watching here, not just that Lululemon fell 20%, but what the market was expecting before the guidance changed.
20% drop in Lululemon’s stock made me think the story was simply about weak guidance. But the more I looked at the headline, the more one thing stood out to me: guidance can change how the market looks at a company’s near-term position very quickly.
The interesting part is that the reaction is much larger than the headline itself might suggest. A 20% move means investors were not just reacting to a small change in expectations. At least, that’s how I read the market’s immediate response. And this is where I find the situation interesting. When guidance comes in weaker than expected, the focus naturally shifts from what a company has already achieved to what people think comes next. Suddenly, previous performance matters a little less, while the outlook becomes the main thing everyone is watching.
I also think it’s easy to look at a move like this and immediately assume the market has decided something permanently. But that’s probably too simple. A sharp reaction tells us what the market thinks about the information right now, not necessarily what the longer-term picture will look like.
Still, a 20% decline is difficult to ignore.
It makes me wonder how much of the move is really about Lululemon itself and how much is about expectations that had already been built into the stock before the guidance changed.
That distinction matters.
Because sometimes the surprising part isn't the bad number itself. It’s realizing how much confidence was already sitting in the price beforehand.
Maybe that’s the part worth watching here, not just that Lululemon fell 20%, but what the market was expecting before the guidance changed.
LULUUS-17.82%
#bitcoin
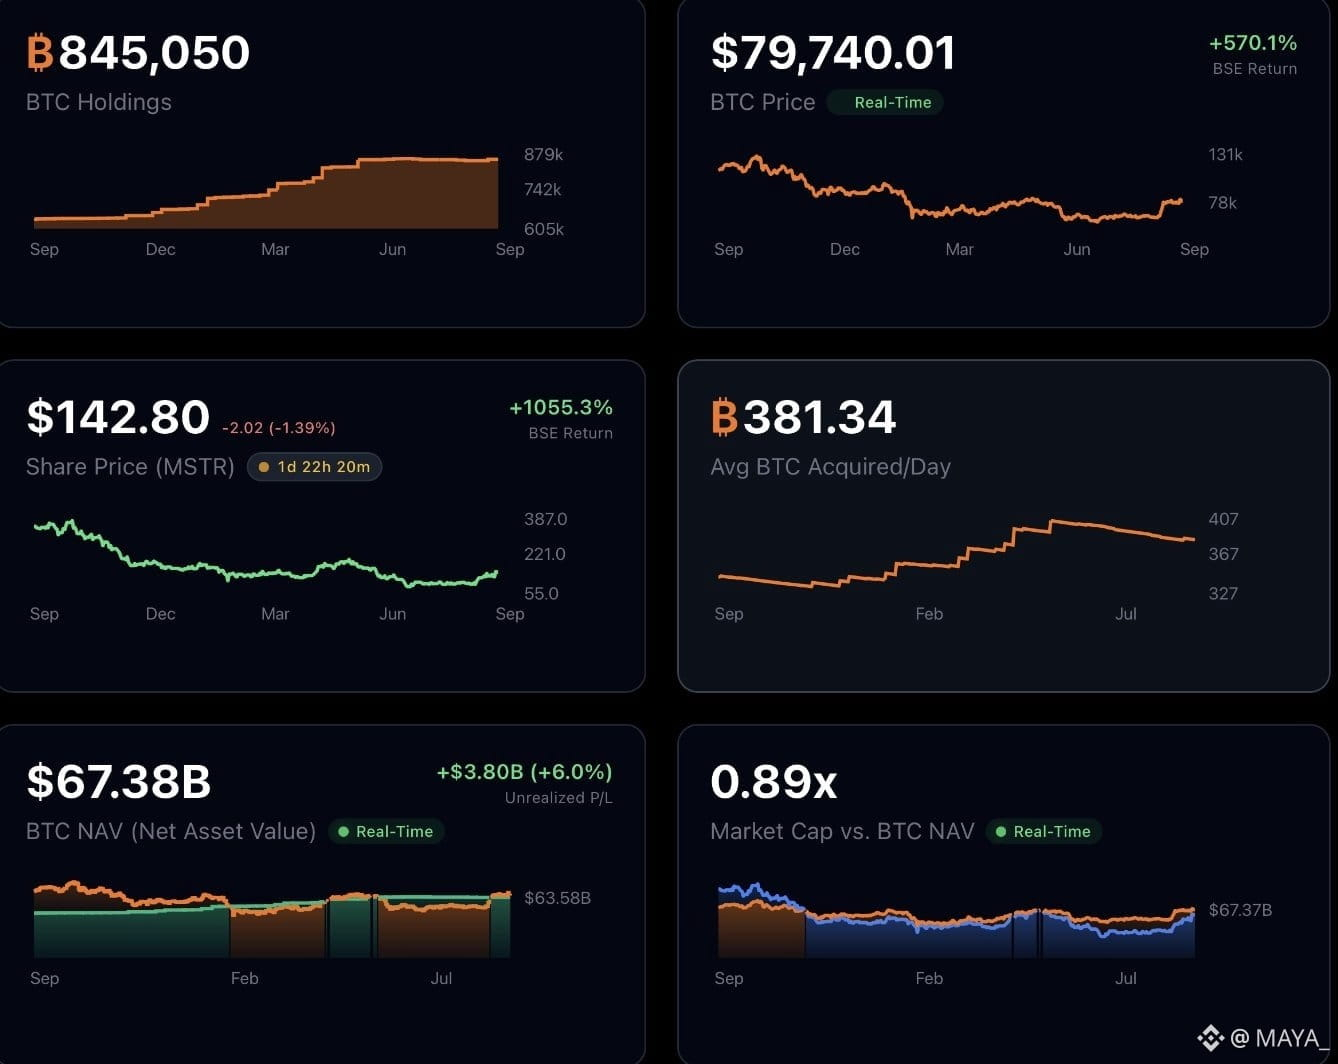
Michael Saylor’s #strategy is now sitting on roughly $3.8 billion in unrealized profits from its Bitcoin holdings.
That number is honestly hard to ignore.
The interesting part isn’t just the profit itself, but how quickly the position can change when Bitcoin moves. A strong BTC rally can add billions to the paper gains, while a sharp correction can take a big chunk of that value away just as quickly.
Still, being billions in profit on BTC gives Strategy a very different position in the market.
It makes me wonder how much longer companies will continue treating Bitcoin as a treasury asset rather than simply an investment.
Michael Saylor’s #strategy is now sitting on roughly $3.8 billion in unrealized profits from its Bitcoin holdings.
That number is honestly hard to ignore.
The interesting part isn’t just the profit itself, but how quickly the position can change when Bitcoin moves. A strong BTC rally can add billions to the paper gains, while a sharp correction can take a big chunk of that value away just as quickly.
Still, being billions in profit on BTC gives Strategy a very different position in the market.
It makes me wonder how much longer companies will continue treating Bitcoin as a treasury asset rather than simply an investment.
#USWeeklyInitialJoblessClaimsRiseTo206000
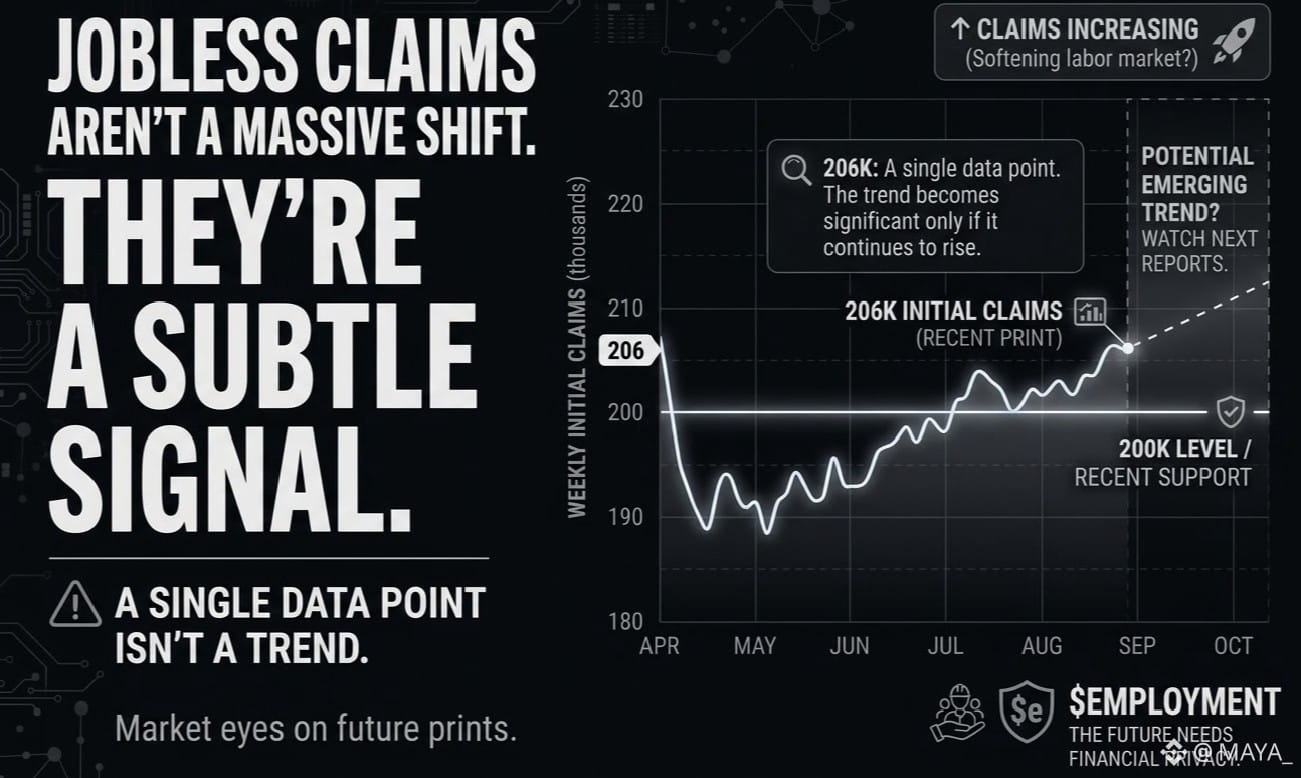
US weekly initial jobless claims came in at 206,000. While this figure doesn't represent a massive shift, it does hint at a potential emerging trend.
Jobless claims are a key indicator, yet 206,000 isn't an extreme level from which to draw sweeping conclusions just yet. I view this as a minor signal within the broader economic picture. If the number of claims continues to rise in the next report, it will become more significant, as it would suggest that the softening in the labor market is not merely temporary but a genuine shift.
This is precisely the interesting aspect for the market. If the labor market cools, expectations regarding future monetary policy could change, potentially influencing risk assets. However, this isn't a major headline-grabbing story right now; 206,000 is just a single data point, not the entire trend. I’ll be keeping a close eye on the figures over the coming weeks—that is where the picture will become clear.
US weekly initial jobless claims came in at 206,000. While this figure doesn't represent a massive shift, it does hint at a potential emerging trend.
Jobless claims are a key indicator, yet 206,000 isn't an extreme level from which to draw sweeping conclusions just yet. I view this as a minor signal within the broader economic picture. If the number of claims continues to rise in the next report, it will become more significant, as it would suggest that the softening in the labor market is not merely temporary but a genuine shift.
This is precisely the interesting aspect for the market. If the labor market cools, expectations regarding future monetary policy could change, potentially influencing risk assets. However, this isn't a major headline-grabbing story right now; 206,000 is just a single data point, not the entire trend. I’ll be keeping a close eye on the figures over the coming weeks—that is where the picture will become clear.
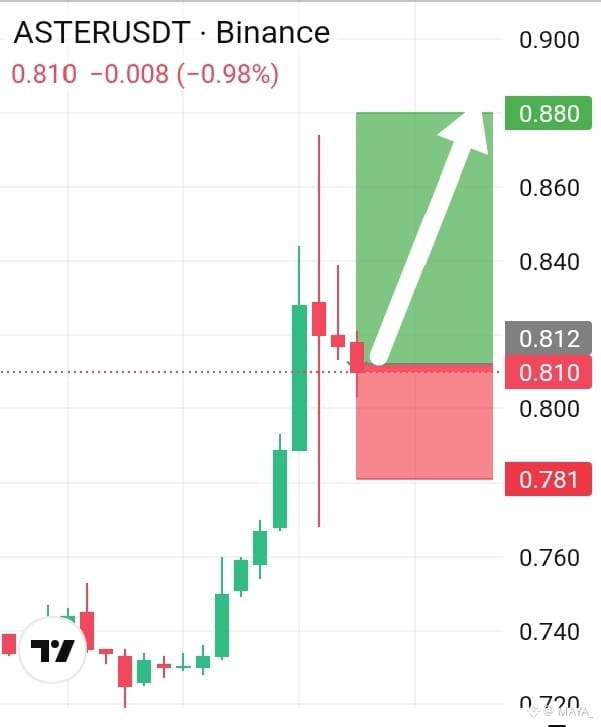
Trading setup: Long 🚀💥
Entry: 0.805 - 0.812
TP1: 0.845
TP2: 0.880
Stop Loss: 0.781.
$ASTER Momentum: Strong bullish Consolidating after pullback. ASTER showed impressive strength pulling back from the 0.874 high and finding quick support near 0.800. If bulls maintain this base, a retest of the high looks very likely.
How high do you think $ASTER can go on this run?
Entry: 0.805 - 0.812
TP1: 0.845
TP2: 0.880
Stop Loss: 0.781.
$ASTER Momentum: Strong bullish Consolidating after pullback. ASTER showed impressive strength pulling back from the 0.874 high and finding quick support near 0.800. If bulls maintain this base, a retest of the high looks very likely.
How high do you think $ASTER can go on this run?

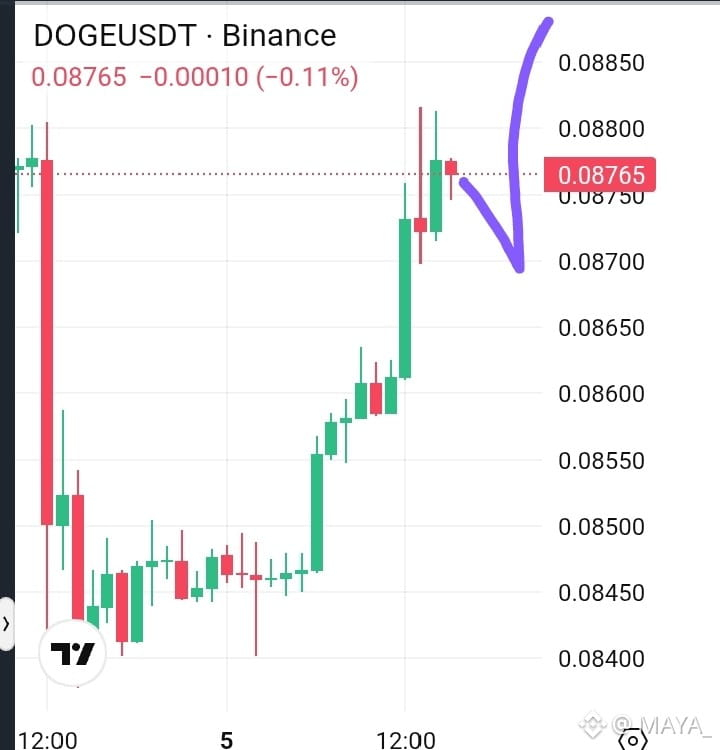
Trading setup: Long 💥
Entry: 0.0872 - 0.0876
TP1: 0.0885
TP2: 0.0898
Stop Loss: 0.0858.
$DOGE Momentum: Pumping / Resisting near local high $DOGE pushing strong after a nice recovery from 0.084 support. Might pause briefly around 0.088 resistance before the next move.
👉 What do you think, can we cross 0.090 today?
Entry: 0.0872 - 0.0876
TP1: 0.0885
TP2: 0.0898
Stop Loss: 0.0858.
$DOGE Momentum: Pumping / Resisting near local high $DOGE pushing strong after a nice recovery from 0.084 support. Might pause briefly around 0.088 resistance before the next move.
👉 What do you think, can we cross 0.090 today?
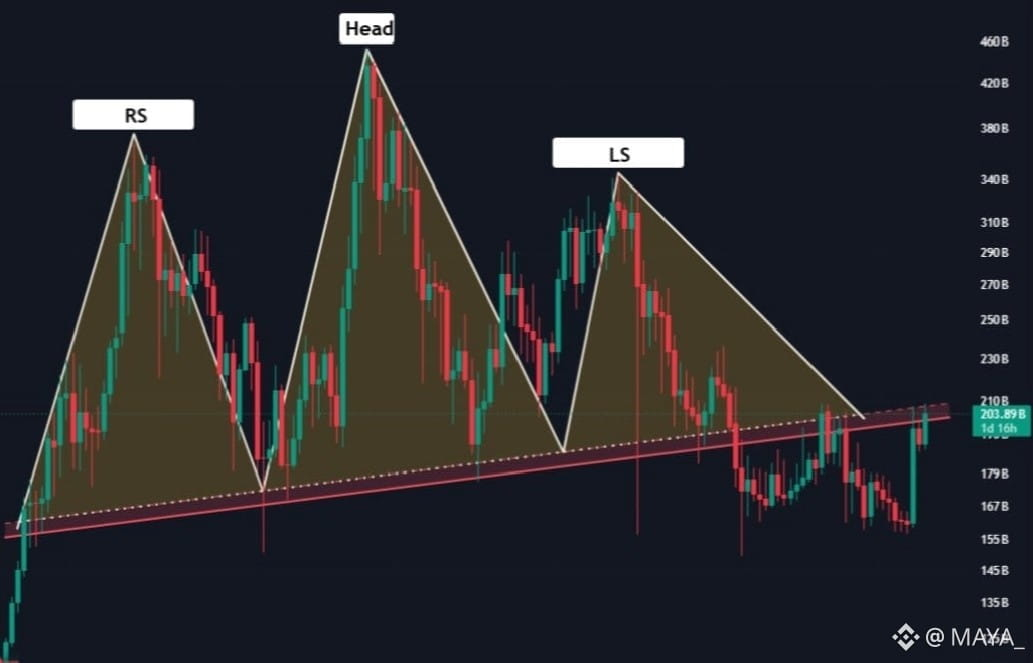
#Altcoinmarketcap is sitting at a pretty important level right now. $210B area could decide what comes next. If we get a weekly close above it, that would be a big sign that the long altcoin downtrend may finally be ending.
Until then, I’m watching this level closely.
Until then, I’m watching this level closely.
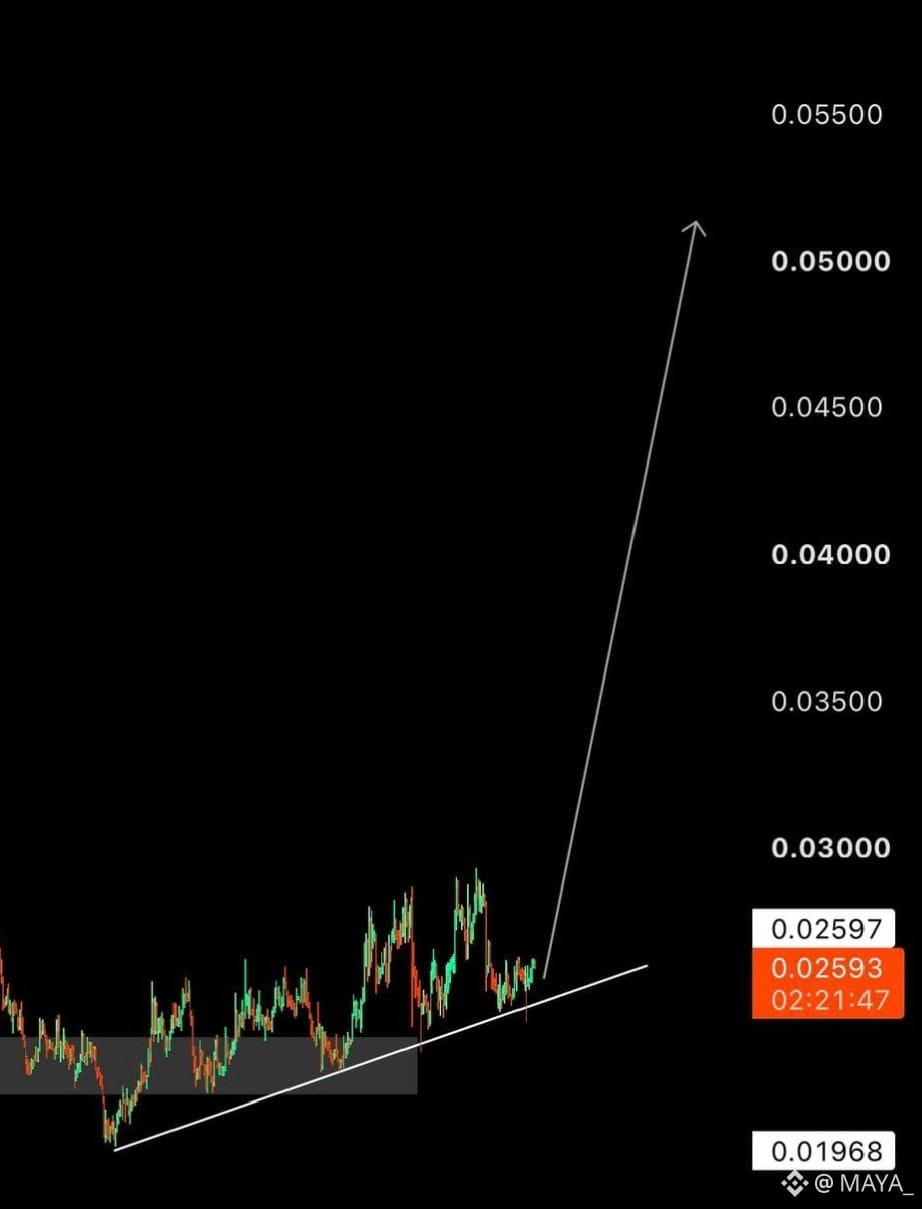
$STBL All in long🚀
Big candle is coming💥
Trading setup : Long
Entry: 0.0255 - 0.0260
TP1: 0.0350
TP2: 0.0500
Stop Loss: 0.0235.
STBL is sitting right on a solid trendline support zone around 0.0259, and you can feel the volume starting to build up. If this higher-low structure holds, we might see a decent momentum push towards the upper levels. Just remember the market is still tricky, so stay sharp and don't over-leverage.
Big candle is coming💥
Trading setup : Long
Entry: 0.0255 - 0.0260
TP1: 0.0350
TP2: 0.0500
Stop Loss: 0.0235.
STBL is sitting right on a solid trendline support zone around 0.0259, and you can feel the volume starting to build up. If this higher-low structure holds, we might see a decent momentum push towards the upper levels. Just remember the market is still tricky, so stay sharp and don't over-leverage.
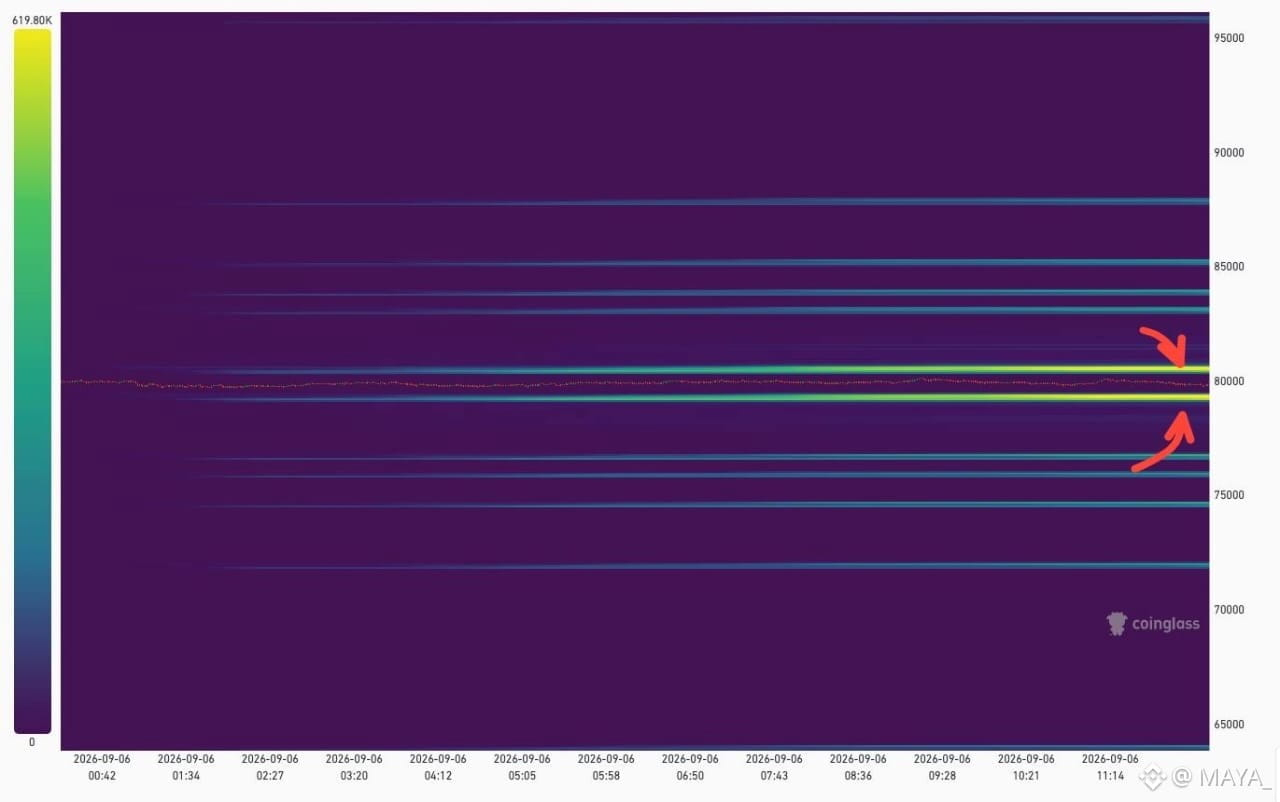
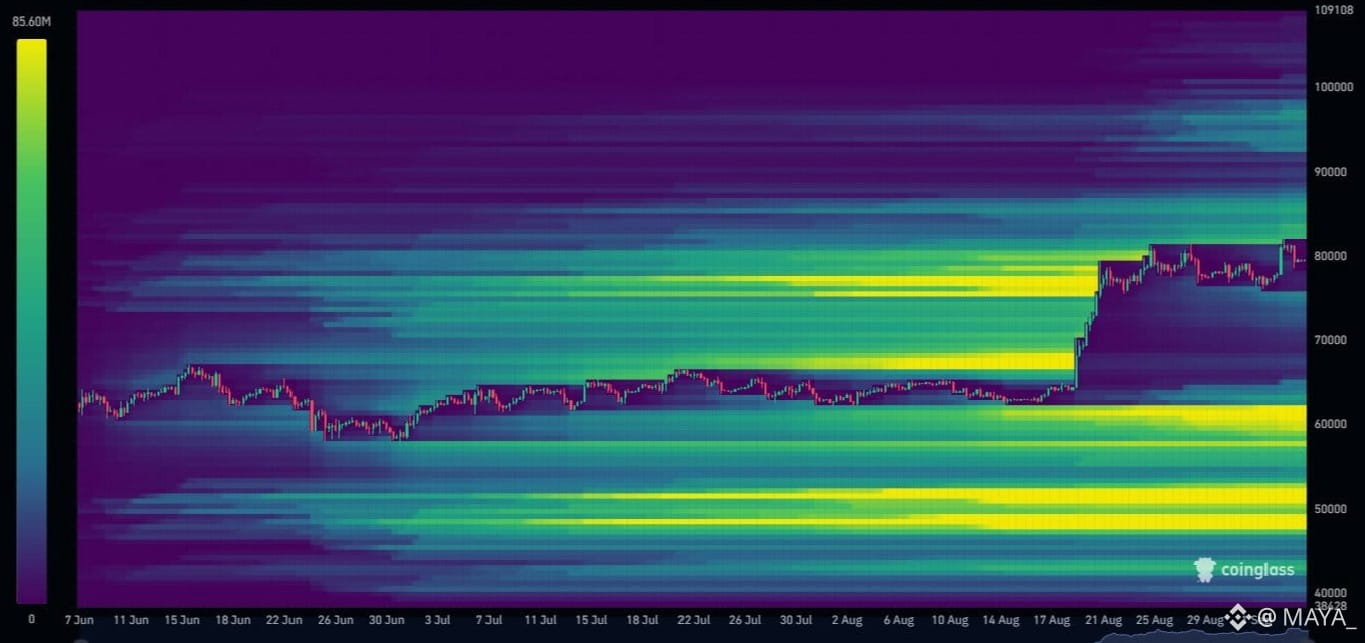
Looking at the current BTC setup, one thing that really stands out to me is the amount of liquidity sitting below the price.
There seems to be a pretty big pool between $60K and $50K. That doesn’t necessarily mean BTC is going there, but it’s definitely an area worth keeping in mind. The interesting part is what happens next. If the market suddenly gets a strong catalyst, that liquidity could become very important. Maybe we get some unexpected news, maybe the market simply decides to test those levels.
Either way, I’m watching that $60K–$50K zone closely. Something about the amount of liquidity there feels worth paying attention to.
$BTC
There seems to be a pretty big pool between $60K and $50K. That doesn’t necessarily mean BTC is going there, but it’s definitely an area worth keeping in mind. The interesting part is what happens next. If the market suddenly gets a strong catalyst, that liquidity could become very important. Maybe we get some unexpected news, maybe the market simply decides to test those levels.
Either way, I’m watching that $60K–$50K zone closely. Something about the amount of liquidity there feels worth paying attention to.
$BTC
#CryptoUpdate
🚨 It’s been a massive week for crypto.
Honestly, there was a lot of major activity in the crypto space this week.
Bitcoin hit a four-month high, reaching $82,300.
ETFs saw inflows of approximately $986.8 million in BTC this week.
Total crypto market cap hit a new high, surpassing the October peak.
Coinbase launched 24/7 leveraged stock trading in the US.
G20 nations reached a consensus on establishing clear regulations for crypto and stablecoins.
Russia implemented new crypto regulations.
There was hype around new all-time highs (ATH), and ZCash hit $1,000 for the first time in a decade.
Twenty-one global banks, including Bank of America and Goldman Sachs, are exploring crypto stablecoins.
The London Stock Exchange is taking steps to trade its top 100 stocks on the blockchain.
So many major events in just one week—the market is generating significant interest and momentum.
🚨 It’s been a massive week for crypto.
Honestly, there was a lot of major activity in the crypto space this week.
Bitcoin hit a four-month high, reaching $82,300.
ETFs saw inflows of approximately $986.8 million in BTC this week.
Total crypto market cap hit a new high, surpassing the October peak.
Coinbase launched 24/7 leveraged stock trading in the US.
G20 nations reached a consensus on establishing clear regulations for crypto and stablecoins.
Russia implemented new crypto regulations.
There was hype around new all-time highs (ATH), and ZCash hit $1,000 for the first time in a decade.
Twenty-one global banks, including Bank of America and Goldman Sachs, are exploring crypto stablecoins.
The London Stock Exchange is taking steps to trade its top 100 stocks on the blockchain.
So many major events in just one week—the market is generating significant interest and momentum.

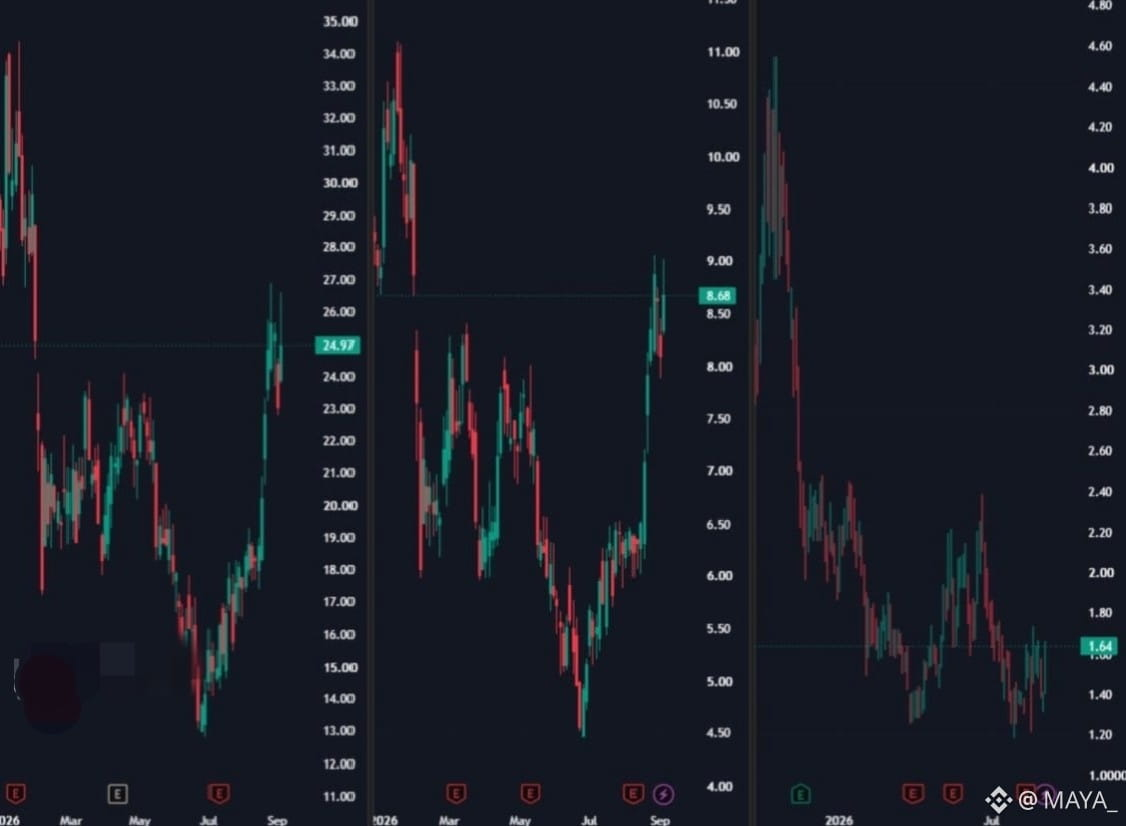
$ETH Treasury companies are starting to show some really strong momentum, and BitMine is standing out in particular. If this trend keeps going, it could mean more capital gradually moving into Ethereum. That kind of steady liquidity flow would obviously be interesting for ETH, especially if demand continues to build.
Log in to explore more content