
#net
net
8,470 views
126 Discussing
Hot
Latest


·
--
Bullish
$NET Breakout Is Building... Buyers Pushing Higher
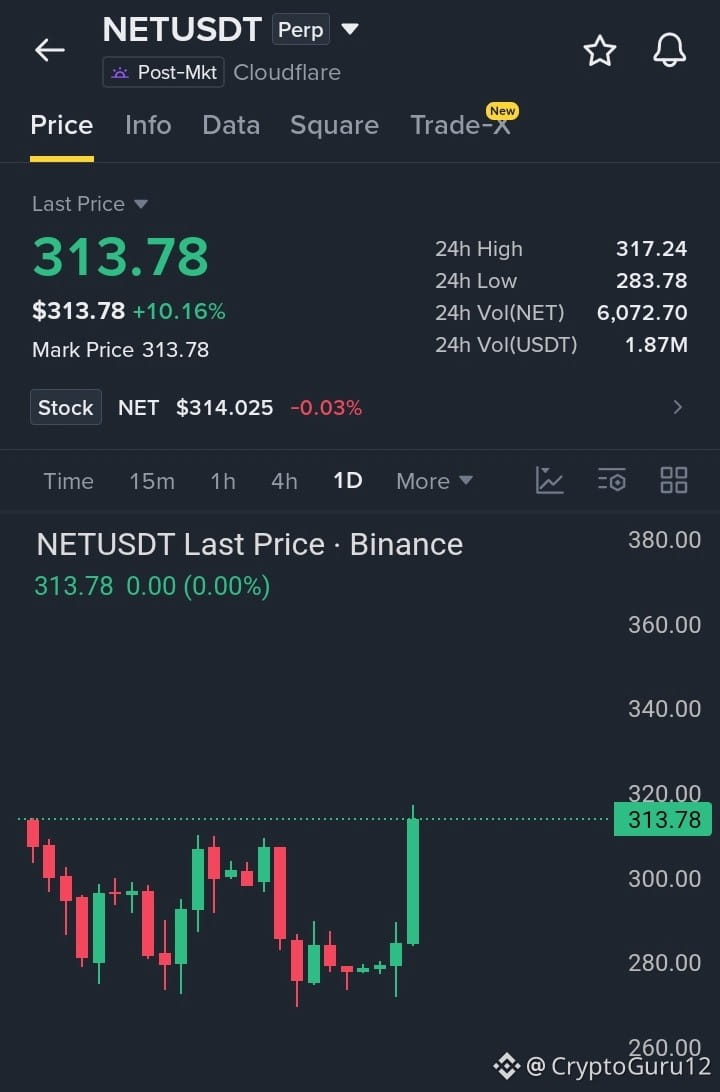
#NET is showing strong bullish momentum on the 1D chart after bouncing from the $275–$285 support zone. The latest candle has pushed price to around $314 and is testing the previous resistance near $317–$320.
A clean daily close above $320 could open the way toward the next upside levels. If price pulls back, the $300 area is the first key support to watch.
Entry: $305–$314
TP1: $320
TP2: $330
TP3: $345
SL: $298
BUY
{future}(NETUSDT)
{future}(ZECUSDT)
$IOST
{future}(IOSTUSDT)
$NET Breakout Is Building... Buyers Pushing Higher
#NET is showing strong bullish momentum on the 1D chart after bouncing from the $275–$285 support zone. The latest candle has pushed price to around $314 and is testing the previous resistance near $317–$320.
A clean daily close above $320 could open the way toward the next upside levels. If price pulls back, the $300 area is the first key support to watch.
Entry: $305–$314
TP1: $320
TP2: $330
TP3: $345
SL: $298
BUY
$IOST
#NET is showing strong bullish momentum on the 1D chart after bouncing from the $275–$285 support zone. The latest candle has pushed price to around $314 and is testing the previous resistance near $317–$320.
A clean daily close above $320 could open the way toward the next upside levels. If price pulls back, the $300 area is the first key support to watch.
Entry: $305–$314
TP1: $320
TP2: $330
TP3: $345
SL: $298
BUY
$IOST
1
428

🚀🦈 $NET PRIMED FOR X20 LONG SURGE – LIQUIDITY SWEEP IN PLAY
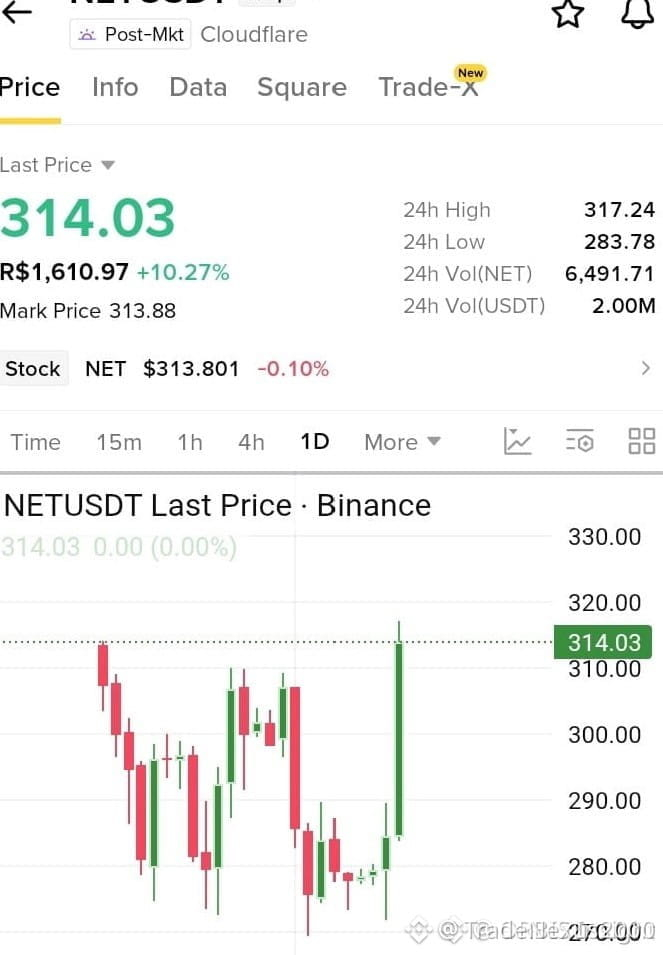
📊 The $NET chart is compressing like a tightly wound spring, a classic institutional accumulation pattern. Recent order block at the current price has absorbed sell pressure repeatedly, signaling a high‑probability breakout zone. 🦈 Smart money appears to be loading positions, ready to thrust the market upward with a leveraged thrust. ⚡ Volume spikes on the 4‑hour frame confirm the demand surge, while the price sits just above a key demand zone 📌 that historically flips into strong support.
💬 Is the spring ready to release, or will we see a short‑cover rally first? 👇
⚠️ Not financial advice. Always manage your risk. 🛡️
🏷️ #NET #LongSetup #Leverage #SmartMoney #Crypto
🚀 💎
🚀🦈 $NET PRIMED FOR X20 LONG SURGE – LIQUIDITY SWEEP IN PLAY
📊 The $NET chart is compressing like a tightly wound spring, a classic institutional accumulation pattern. Recent order block at the current price has absorbed sell pressure repeatedly, signaling a high‑probability breakout zone. 🦈 Smart money appears to be loading positions, ready to thrust the market upward with a leveraged thrust. ⚡ Volume spikes on the 4‑hour frame confirm the demand surge, while the price sits just above a key demand zone 📌 that historically flips into strong support.
💬 Is the spring ready to release, or will we see a short‑cover rally first? 👇
⚠️ Not financial advice. Always manage your risk. 🛡️
🏷️ #NET #LongSetup #Leverage #SmartMoney #Crypto
🚀 💎
📊 The $NET chart is compressing like a tightly wound spring, a classic institutional accumulation pattern. Recent order block at the current price has absorbed sell pressure repeatedly, signaling a high‑probability breakout zone. 🦈 Smart money appears to be loading positions, ready to thrust the market upward with a leveraged thrust. ⚡ Volume spikes on the 4‑hour frame confirm the demand surge, while the price sits just above a key demand zone 📌 that historically flips into strong support.
💬 Is the spring ready to release, or will we see a short‑cover rally first? 👇
⚠️ Not financial advice. Always manage your risk. 🛡️
🏷️ #NET #LongSetup #Leverage #SmartMoney #Crypto
🚀 💎
23

·
--
🚀 $NET READY TO SHATTER RESISTANCE WITH X20 LONG SURGE! 💥
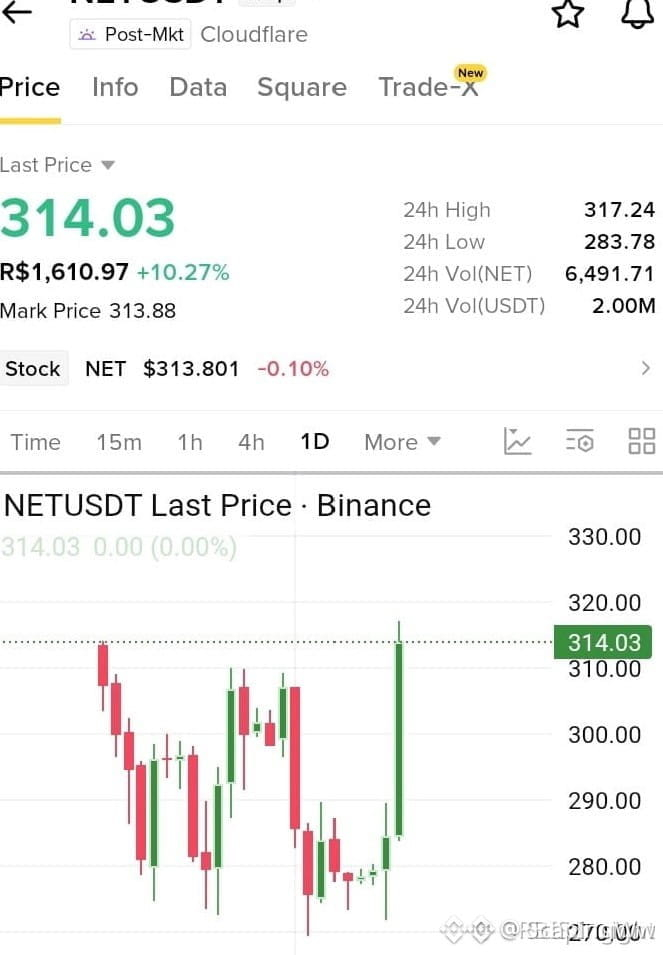
The chart is coiled tighter than a spring, and smart money is stacking $NET like a shark in a feeding frenzy. 🦈 Every pull‑back has been devoured, leaving a pristine launchpad for a x20 long blast.
Volume spikes on the 4‑hour are screaming liquidity, while the order block at the recent low is primed to explode. 📊⚡ If the bulls break the ceiling, we could see a sky‑high rally that wipes out short‑side panic.
Timing is everything—miss the wave and you’ll be left watching the sky from the ground. 💥💬 Are you ready to flip the script or stay on the sidelines? 👇
⚠️ Not financial advice. Always manage your risk. 🛡️
🏷️ #NET #LongSetup #Leverage #Crypto #BullRun
🔥 💎
🚀 $NET READY TO SHATTER RESISTANCE WITH X20 LONG SURGE! 💥
The chart is coiled tighter than a spring, and smart money is stacking $NET like a shark in a feeding frenzy. 🦈 Every pull‑back has been devoured, leaving a pristine launchpad for a x20 long blast.
Volume spikes on the 4‑hour are screaming liquidity, while the order block at the recent low is primed to explode. 📊⚡ If the bulls break the ceiling, we could see a sky‑high rally that wipes out short‑side panic.
Timing is everything—miss the wave and you’ll be left watching the sky from the ground. 💥💬 Are you ready to flip the script or stay on the sidelines? 👇
⚠️ Not financial advice. Always manage your risk. 🛡️
🏷️ #NET #LongSetup #Leverage #Crypto #BullRun
🔥 💎
The chart is coiled tighter than a spring, and smart money is stacking $NET like a shark in a feeding frenzy. 🦈 Every pull‑back has been devoured, leaving a pristine launchpad for a x20 long blast.
Volume spikes on the 4‑hour are screaming liquidity, while the order block at the recent low is primed to explode. 📊⚡ If the bulls break the ceiling, we could see a sky‑high rally that wipes out short‑side panic.
Timing is everything—miss the wave and you’ll be left watching the sky from the ground. 💥💬 Are you ready to flip the script or stay on the sidelines? 👇
⚠️ Not financial advice. Always manage your risk. 🛡️
🏷️ #NET #LongSetup #Leverage #Crypto #BullRun
🔥 💎
20

·
--
🚀 $NET POISED FOR LEVERAGED LONG SURGE! 🦈
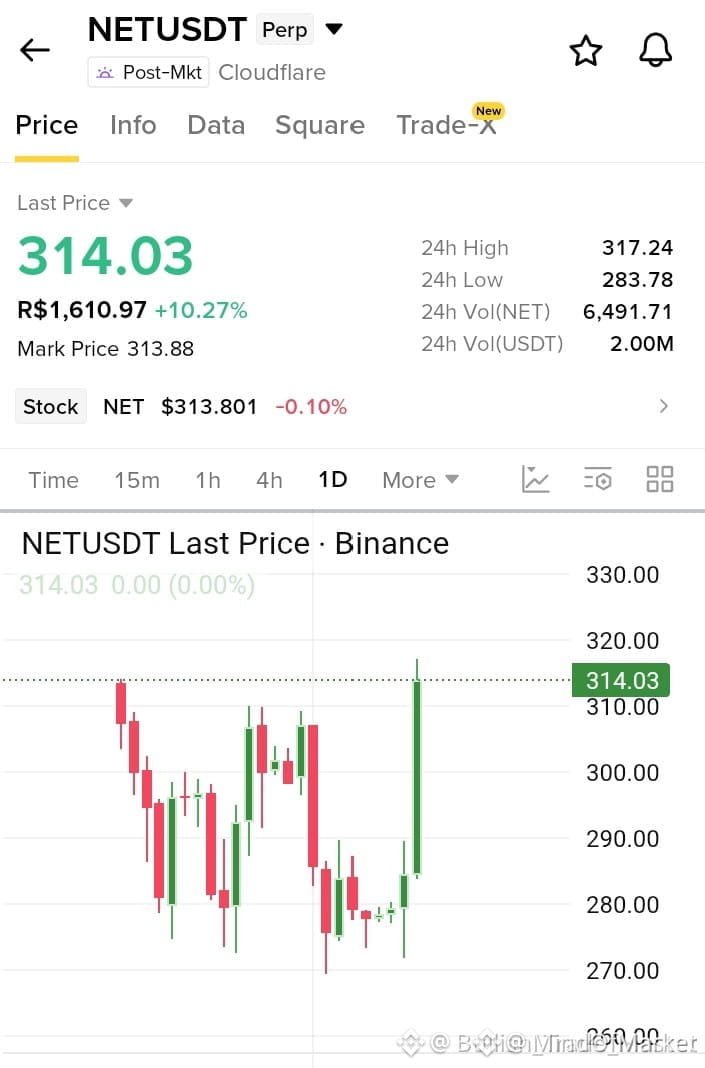
📊 Smart money has been quietly building a demand block around $NET , and the 20x leverage window amplifies that institutional bias. ⚡ The recent order flow shows a decisive liquidity sweep, leaving a clean gap for buyers to step in. 📌 With the broader market trending higher, $NET ’s structure flips bullish, offering a high‑conviction entry for disciplined traders.
💡 The setup aligns with a tight risk‑to‑reward profile; a modest stop protects capital while the upside potential remains compelling. 🤔 How are you positioning for the next liquidity grab on $NET ? 💬
⚠️ Not financial advice. Always manage your risk. 🛡️
🏷️ #NET #LongSetup #Leverage #SmartMoney #Crypto
🔥 💎
🚀 $NET POISED FOR LEVERAGED LONG SURGE! 🦈
📊 Smart money has been quietly building a demand block around $NET , and the 20x leverage window amplifies that institutional bias. ⚡ The recent order flow shows a decisive liquidity sweep, leaving a clean gap for buyers to step in. 📌 With the broader market trending higher, $NET ’s structure flips bullish, offering a high‑conviction entry for disciplined traders.
💡 The setup aligns with a tight risk‑to‑reward profile; a modest stop protects capital while the upside potential remains compelling. 🤔 How are you positioning for the next liquidity grab on $NET ? 💬
⚠️ Not financial advice. Always manage your risk. 🛡️
🏷️ #NET #LongSetup #Leverage #SmartMoney #Crypto
🔥 💎
📊 Smart money has been quietly building a demand block around $NET , and the 20x leverage window amplifies that institutional bias. ⚡ The recent order flow shows a decisive liquidity sweep, leaving a clean gap for buyers to step in. 📌 With the broader market trending higher, $NET ’s structure flips bullish, offering a high‑conviction entry for disciplined traders.
💡 The setup aligns with a tight risk‑to‑reward profile; a modest stop protects capital while the upside potential remains compelling. 🤔 How are you positioning for the next liquidity grab on $NET ? 💬
⚠️ Not financial advice. Always manage your risk. 🛡️
🏷️ #NET #LongSetup #Leverage #SmartMoney #Crypto
🔥 💎
24

🚀 $NET READY TO SKYROCKET ON 20X LEVERAGE SURGE! 💥
📊 Smart‑money is loading a massive order block around $NET , and the liquidity pool is thinning fast. 🦈 Every pullback has been devoured, leaving a clean runway for bulls to flip the tape. ⚡ Volume spikes on the 4‑hour chart confirm the pressure is shifting from sellers to aggressive buyers.
💎 With 20X leverage, the upside curve sharpens dramatically, but the margin window narrows. Keep an eye on the next resistance break; a single candle could ignite a cascade of bids. 📈
💬 Are you stacking $NET on the next wave or waiting for the pullback? 👇
⚠️ Not financial advice. Always manage your risk. 🛡️
🏷️ #NET #LongSetup #Leverage #Crypto #Bullish
🔥 💎
🚀 $NET READY TO SKYROCKET ON 20X LEVERAGE SURGE! 💥
📊 Smart‑money is loading a massive order block around $NET , and the liquidity pool is thinning fast. 🦈 Every pullback has been devoured, leaving a clean runway for bulls to flip the tape. ⚡ Volume spikes on the 4‑hour chart confirm the pressure is shifting from sellers to aggressive buyers.
💎 With 20X leverage, the upside curve sharpens dramatically, but the margin window narrows. Keep an eye on the next resistance break; a single candle could ignite a cascade of bids. 📈
💬 Are you stacking $NET on the next wave or waiting for the pullback? 👇
⚠️ Not financial advice. Always manage your risk. 🛡️
🏷️ #NET #LongSetup #Leverage #Crypto #Bullish
🔥 💎
📊 Smart‑money is loading a massive order block around $NET , and the liquidity pool is thinning fast. 🦈 Every pullback has been devoured, leaving a clean runway for bulls to flip the tape. ⚡ Volume spikes on the 4‑hour chart confirm the pressure is shifting from sellers to aggressive buyers.
💎 With 20X leverage, the upside curve sharpens dramatically, but the margin window narrows. Keep an eye on the next resistance break; a single candle could ignite a cascade of bids. 📈
💬 Are you stacking $NET on the next wave or waiting for the pullback? 👇
⚠️ Not financial advice. Always manage your risk. 🛡️
🏷️ #NET #LongSetup #Leverage #Crypto #Bullish
🔥 💎
46
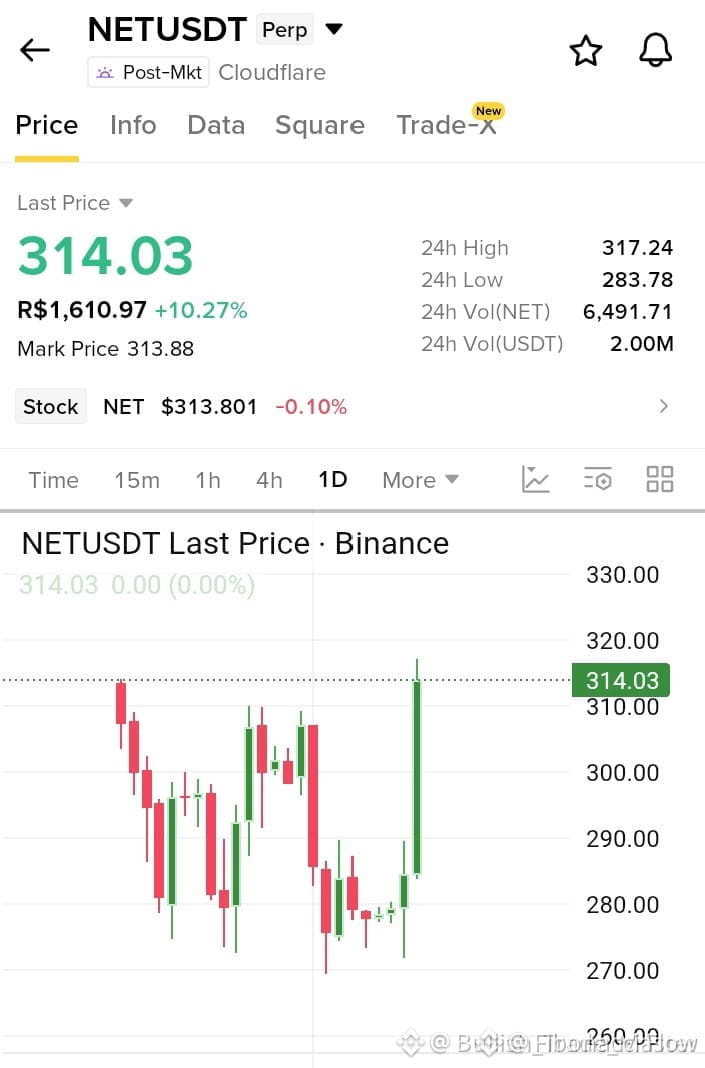
🚀 $NET SURGES PAST $320, READY FOR $345 SKYWARD! 🟢
Entry: 305-314 ⚡
Target: 320/330/345 🚀
Stop Loss: 298 ⚠️
📊 Buyers have ripped the 1D chart off the $275‑$285 base, catapulting $NET to $314 and now eyeing the $317‑$320 ceiling. ⚡ A clean daily close above $320 would flip that resistance into fresh demand, opening the ladder to $330 and the $345 climax. 🌊 If the rally stalls, the $300 zone stands as the first safety net, but liquidity is already draining from the lower hands.
💬 Are you loading up at $305 or waiting for that clean 320 close? 👇
⚠️ Not financial advice. Always manage your risk. 🛡️
🏷️ #NET #LongSetup #Breakout #Crypto
🔥 💎
🚀 $NET SURGES PAST $320, READY FOR $345 SKYWARD! 🟢
Entry: 305-314 ⚡
Target: 320/330/345 🚀
Stop Loss: 298 ⚠️
📊 Buyers have ripped the 1D chart off the $275‑$285 base, catapulting $NET to $314 and now eyeing the $317‑$320 ceiling. ⚡ A clean daily close above $320 would flip that resistance into fresh demand, opening the ladder to $330 and the $345 climax. 🌊 If the rally stalls, the $300 zone stands as the first safety net, but liquidity is already draining from the lower hands.
💬 Are you loading up at $305 or waiting for that clean 320 close? 👇
⚠️ Not financial advice. Always manage your risk. 🛡️
🏷️ #NET #LongSetup #Breakout #Crypto
🔥 💎
Entry: 305-314 ⚡
Target: 320/330/345 🚀
Stop Loss: 298 ⚠️
📊 Buyers have ripped the 1D chart off the $275‑$285 base, catapulting $NET to $314 and now eyeing the $317‑$320 ceiling. ⚡ A clean daily close above $320 would flip that resistance into fresh demand, opening the ladder to $330 and the $345 climax. 🌊 If the rally stalls, the $300 zone stands as the first safety net, but liquidity is already draining from the lower hands.
💬 Are you loading up at $305 or waiting for that clean 320 close? 👇
⚠️ Not financial advice. Always manage your risk. 🛡️
🏷️ #NET #LongSetup #Breakout #Crypto
🔥 💎
54
·
--
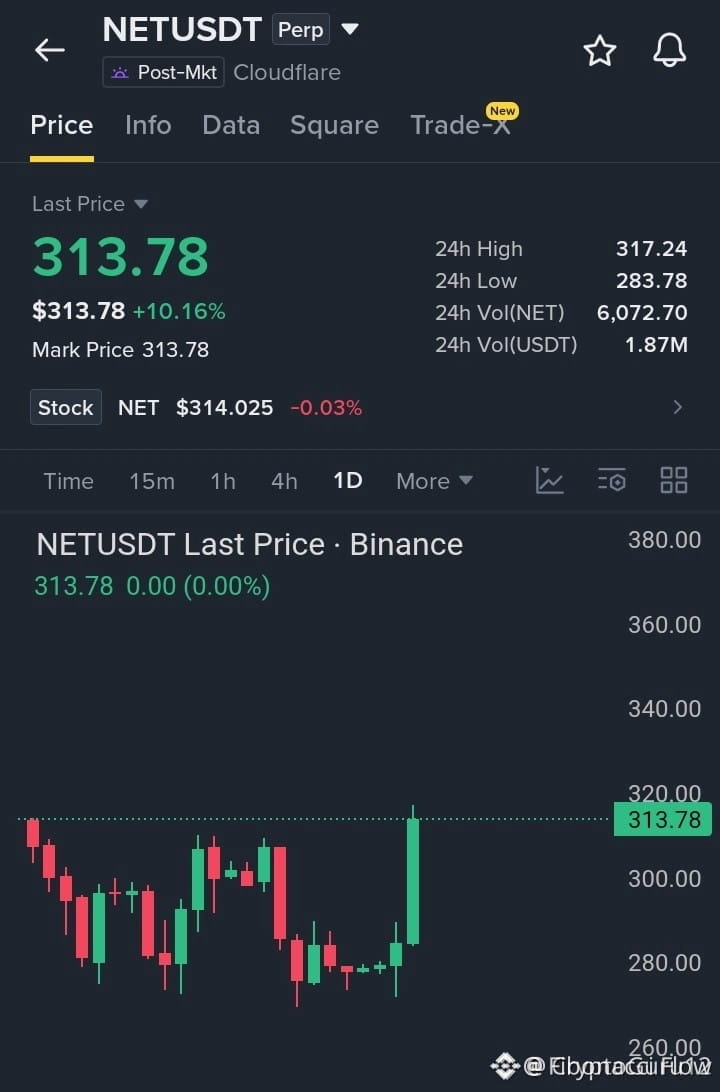
🚀 $NET BREAKING THROUGH RESISTANCE, EYES ON $320 CLIMB! 📈
Entry: 305-314 ⚡
Target: 320 🚀
Stop Loss: 298 ⚠️
📊 The 1D chart shows a classic liquidity sweep: buyers absorbed the $275‑$285 demand zone and thrust price to $314, testing the $317‑$320 order block. 🌊 A clean close above $320 signals smart‑money accumulation and clears the path to the next upside tier. 📌 Should the market pull back, the $300 area acts as the first defensive line, but the bias remains aggressively bullish.
💬 Are you positioning $NET for a breakout beyond $320? 👇
⚠️ Not financial advice. Always manage your risk. 🛡️
🏷️ #NET #LongSetup #Breakout #Crypto
🔥 💎
🚀 $NET BREAKING THROUGH RESISTANCE, EYES ON $320 CLIMB! 📈
Entry: 305-314 ⚡
Target: 320 🚀
Stop Loss: 298 ⚠️
📊 The 1D chart shows a classic liquidity sweep: buyers absorbed the $275‑$285 demand zone and thrust price to $314, testing the $317‑$320 order block. 🌊 A clean close above $320 signals smart‑money accumulation and clears the path to the next upside tier. 📌 Should the market pull back, the $300 area acts as the first defensive line, but the bias remains aggressively bullish.
💬 Are you positioning $NET for a breakout beyond $320? 👇
⚠️ Not financial advice. Always manage your risk. 🛡️
🏷️ #NET #LongSetup #Breakout #Crypto
🔥 💎
Entry: 305-314 ⚡
Target: 320 🚀
Stop Loss: 298 ⚠️
📊 The 1D chart shows a classic liquidity sweep: buyers absorbed the $275‑$285 demand zone and thrust price to $314, testing the $317‑$320 order block. 🌊 A clean close above $320 signals smart‑money accumulation and clears the path to the next upside tier. 📌 Should the market pull back, the $300 area acts as the first defensive line, but the bias remains aggressively bullish.
💬 Are you positioning $NET for a breakout beyond $320? 👇
⚠️ Not financial advice. Always manage your risk. 🛡️
🏷️ #NET #LongSetup #Breakout #Crypto
🔥 💎
38

·
--
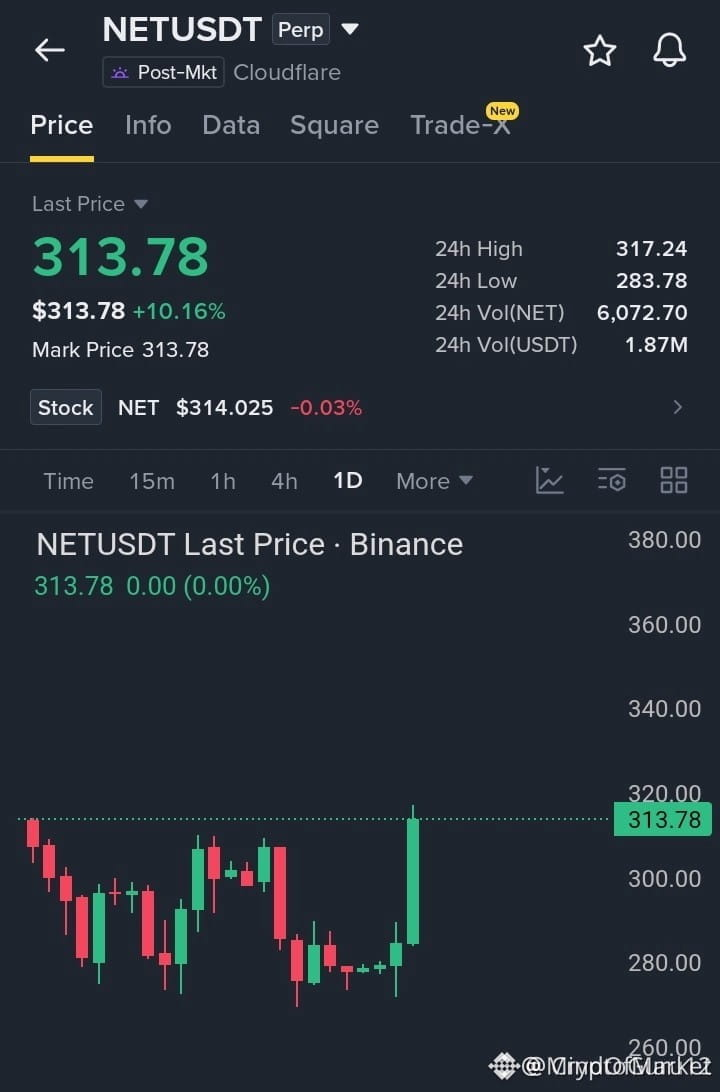
🔴 $NET PRIMED FOR A HARD SHORT SINK 🚨
Entry: 316.20-318.20 ⚡
Target: 310.40 / 302.60 / 295.00 🚀
Stop Loss: 321.50 ⚠️
📊 The market maker’s compression zone around 317 is a textbook liquidity pool, where smart money is loading short orders. 🦈 A decisive order block has been stamped, and the next wave of sell pressure is poised to drive $NET straight into the depth. ⚡ Volume on the 4H is expanding as the bearish momentum accelerates, confirming the inefficiency fill. 📌 With each tick below 317, the short narrative tightens, leaving longs exposed.
💬 Are you ready to ride the down‑trend or waiting for the next liquidity sweep? 👇
⚠️ Not financial advice. Always manage your risk. 🛡️
🏷️ #NET #ShortSetup #LiquidityHunt #Crypto
🦈 🔥
🔴 $NET PRIMED FOR A HARD SHORT SINK 🚨
Entry: 316.20-318.20 ⚡
Target: 310.40 / 302.60 / 295.00 🚀
Stop Loss: 321.50 ⚠️
📊 The market maker’s compression zone around 317 is a textbook liquidity pool, where smart money is loading short orders. 🦈 A decisive order block has been stamped, and the next wave of sell pressure is poised to drive $NET straight into the depth. ⚡ Volume on the 4H is expanding as the bearish momentum accelerates, confirming the inefficiency fill. 📌 With each tick below 317, the short narrative tightens, leaving longs exposed.
💬 Are you ready to ride the down‑trend or waiting for the next liquidity sweep? 👇
⚠️ Not financial advice. Always manage your risk. 🛡️
🏷️ #NET #ShortSetup #LiquidityHunt #Crypto
🦈 🔥
Entry: 316.20-318.20 ⚡
Target: 310.40 / 302.60 / 295.00 🚀
Stop Loss: 321.50 ⚠️
📊 The market maker’s compression zone around 317 is a textbook liquidity pool, where smart money is loading short orders. 🦈 A decisive order block has been stamped, and the next wave of sell pressure is poised to drive $NET straight into the depth. ⚡ Volume on the 4H is expanding as the bearish momentum accelerates, confirming the inefficiency fill. 📌 With each tick below 317, the short narrative tightens, leaving longs exposed.
💬 Are you ready to ride the down‑trend or waiting for the next liquidity sweep? 👇
⚠️ Not financial advice. Always manage your risk. 🛡️
🏷️ #NET #ShortSetup #LiquidityHunt #Crypto
🦈 🔥
13
·
--
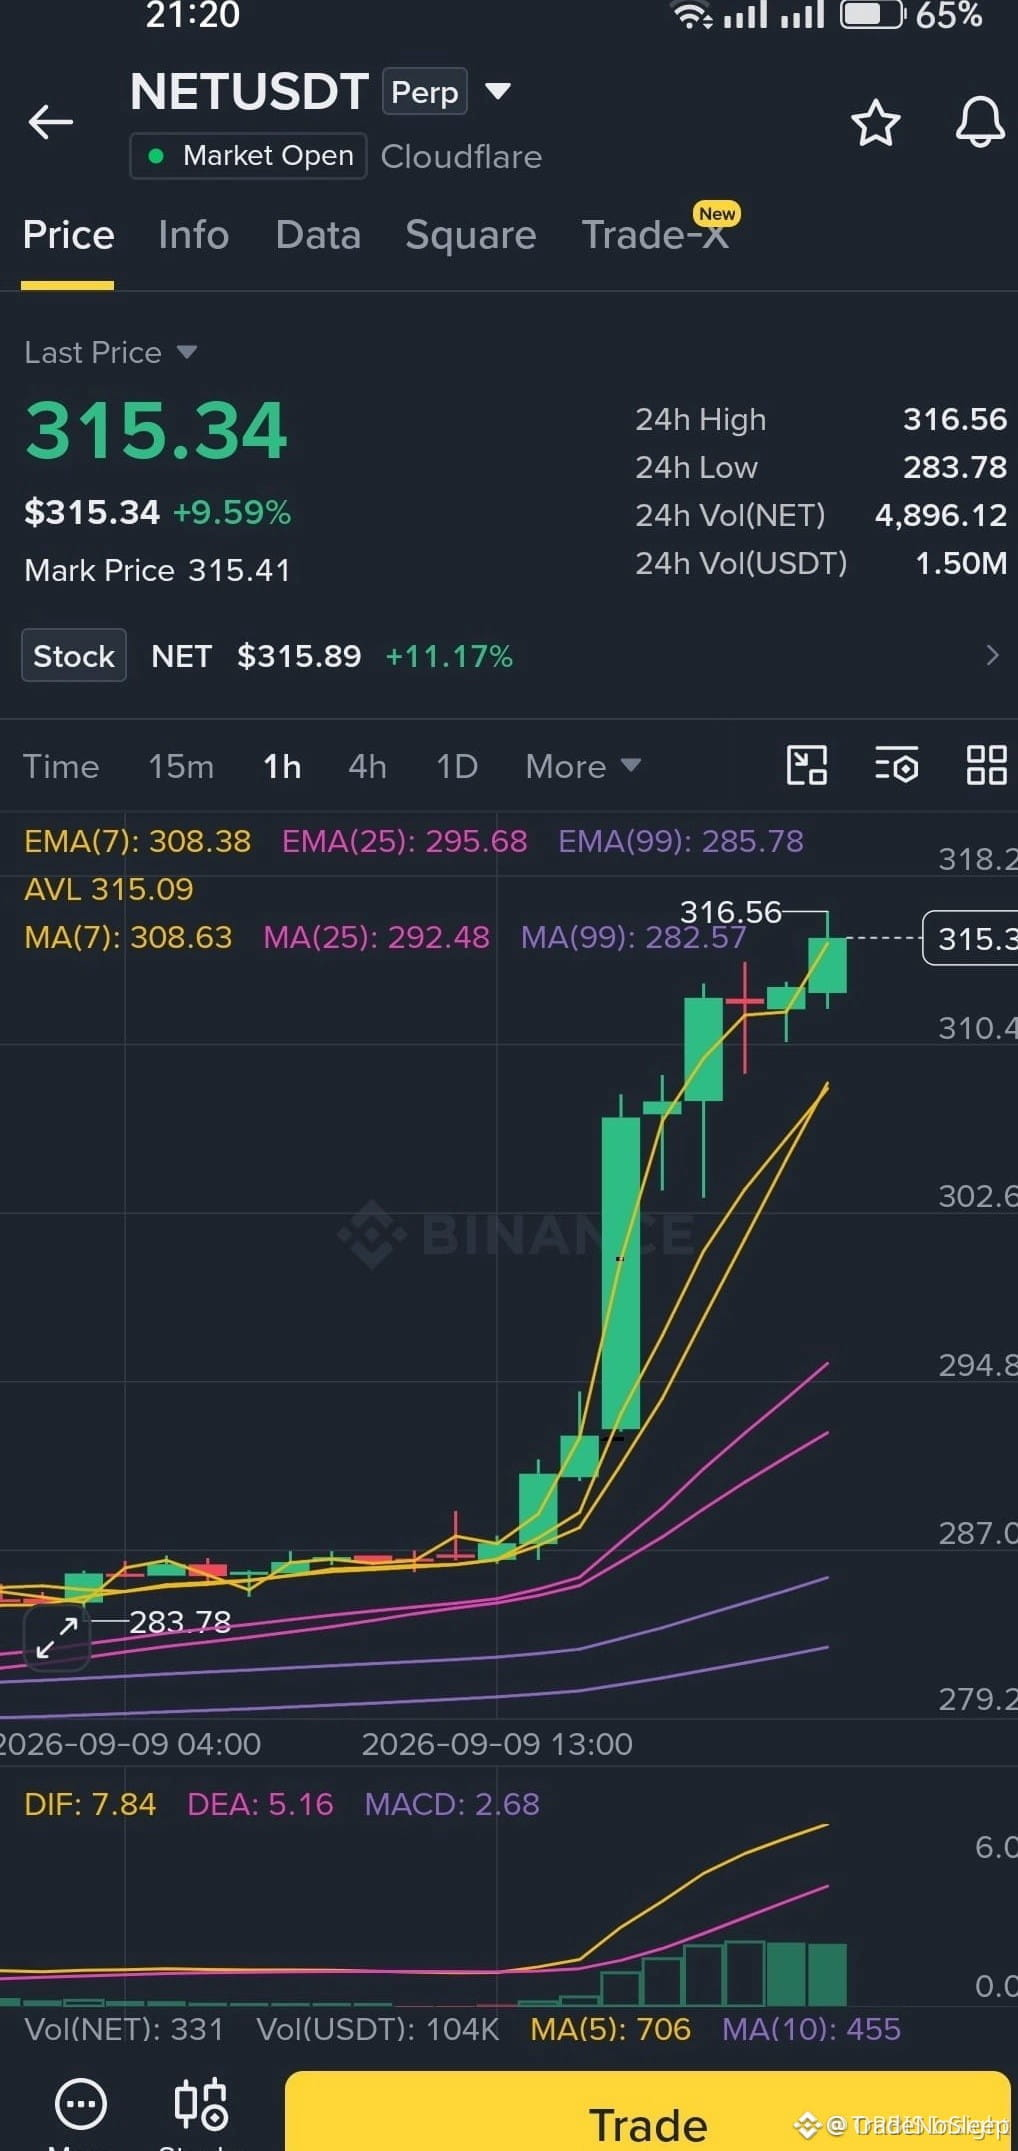
🚨 $NET ON THE ROPES – SHORT THRUST TO THE DEEP! 🔴
Entry: 316.20-318.20 ⚡
Target: 310.40 / 302.60 / 295.00 🚀
Stop Loss: 321.50 ⚠️
🦈 The smart money is loading the kill‑zone, squeezing the $NET chart tighter than a vice. Volume spikes on the 4H are flashing red, and every bullish attempt is getting slashed at the 318‑321 band. 📊 As the longs chase a phantom peak, the bears are primed to dump the next wave straight to the floor, turning the candle‑wick into a free‑fall.
💡 This isn’t a swing‑trade tease; it’s a full‑scale liquidation play. The liquidity pool below 310 is a magnet for stop‑loss hunters, and the next candle could trigger a cascade. 🤔 Ready to ride the descent or watching from the sidelines? 👇
⚠️ Not financial advice. Always manage your risk. 🛡️
🏷️ #NET #ShortSetup #LiquiditySweep #Crypto
🔥 🦈
🚨 $NET ON THE ROPES – SHORT THRUST TO THE DEEP! 🔴
Entry: 316.20-318.20 ⚡
Target: 310.40 / 302.60 / 295.00 🚀
Stop Loss: 321.50 ⚠️
🦈 The smart money is loading the kill‑zone, squeezing the $NET chart tighter than a vice. Volume spikes on the 4H are flashing red, and every bullish attempt is getting slashed at the 318‑321 band. 📊 As the longs chase a phantom peak, the bears are primed to dump the next wave straight to the floor, turning the candle‑wick into a free‑fall.
💡 This isn’t a swing‑trade tease; it’s a full‑scale liquidation play. The liquidity pool below 310 is a magnet for stop‑loss hunters, and the next candle could trigger a cascade. 🤔 Ready to ride the descent or watching from the sidelines? 👇
⚠️ Not financial advice. Always manage your risk. 🛡️
🏷️ #NET #ShortSetup #LiquiditySweep #Crypto
🔥 🦈
Entry: 316.20-318.20 ⚡
Target: 310.40 / 302.60 / 295.00 🚀
Stop Loss: 321.50 ⚠️
🦈 The smart money is loading the kill‑zone, squeezing the $NET chart tighter than a vice. Volume spikes on the 4H are flashing red, and every bullish attempt is getting slashed at the 318‑321 band. 📊 As the longs chase a phantom peak, the bears are primed to dump the next wave straight to the floor, turning the candle‑wick into a free‑fall.
💡 This isn’t a swing‑trade tease; it’s a full‑scale liquidation play. The liquidity pool below 310 is a magnet for stop‑loss hunters, and the next candle could trigger a cascade. 🤔 Ready to ride the descent or watching from the sidelines? 👇
⚠️ Not financial advice. Always manage your risk. 🛡️
🏷️ #NET #ShortSetup #LiquiditySweep #Crypto
🔥 🦈
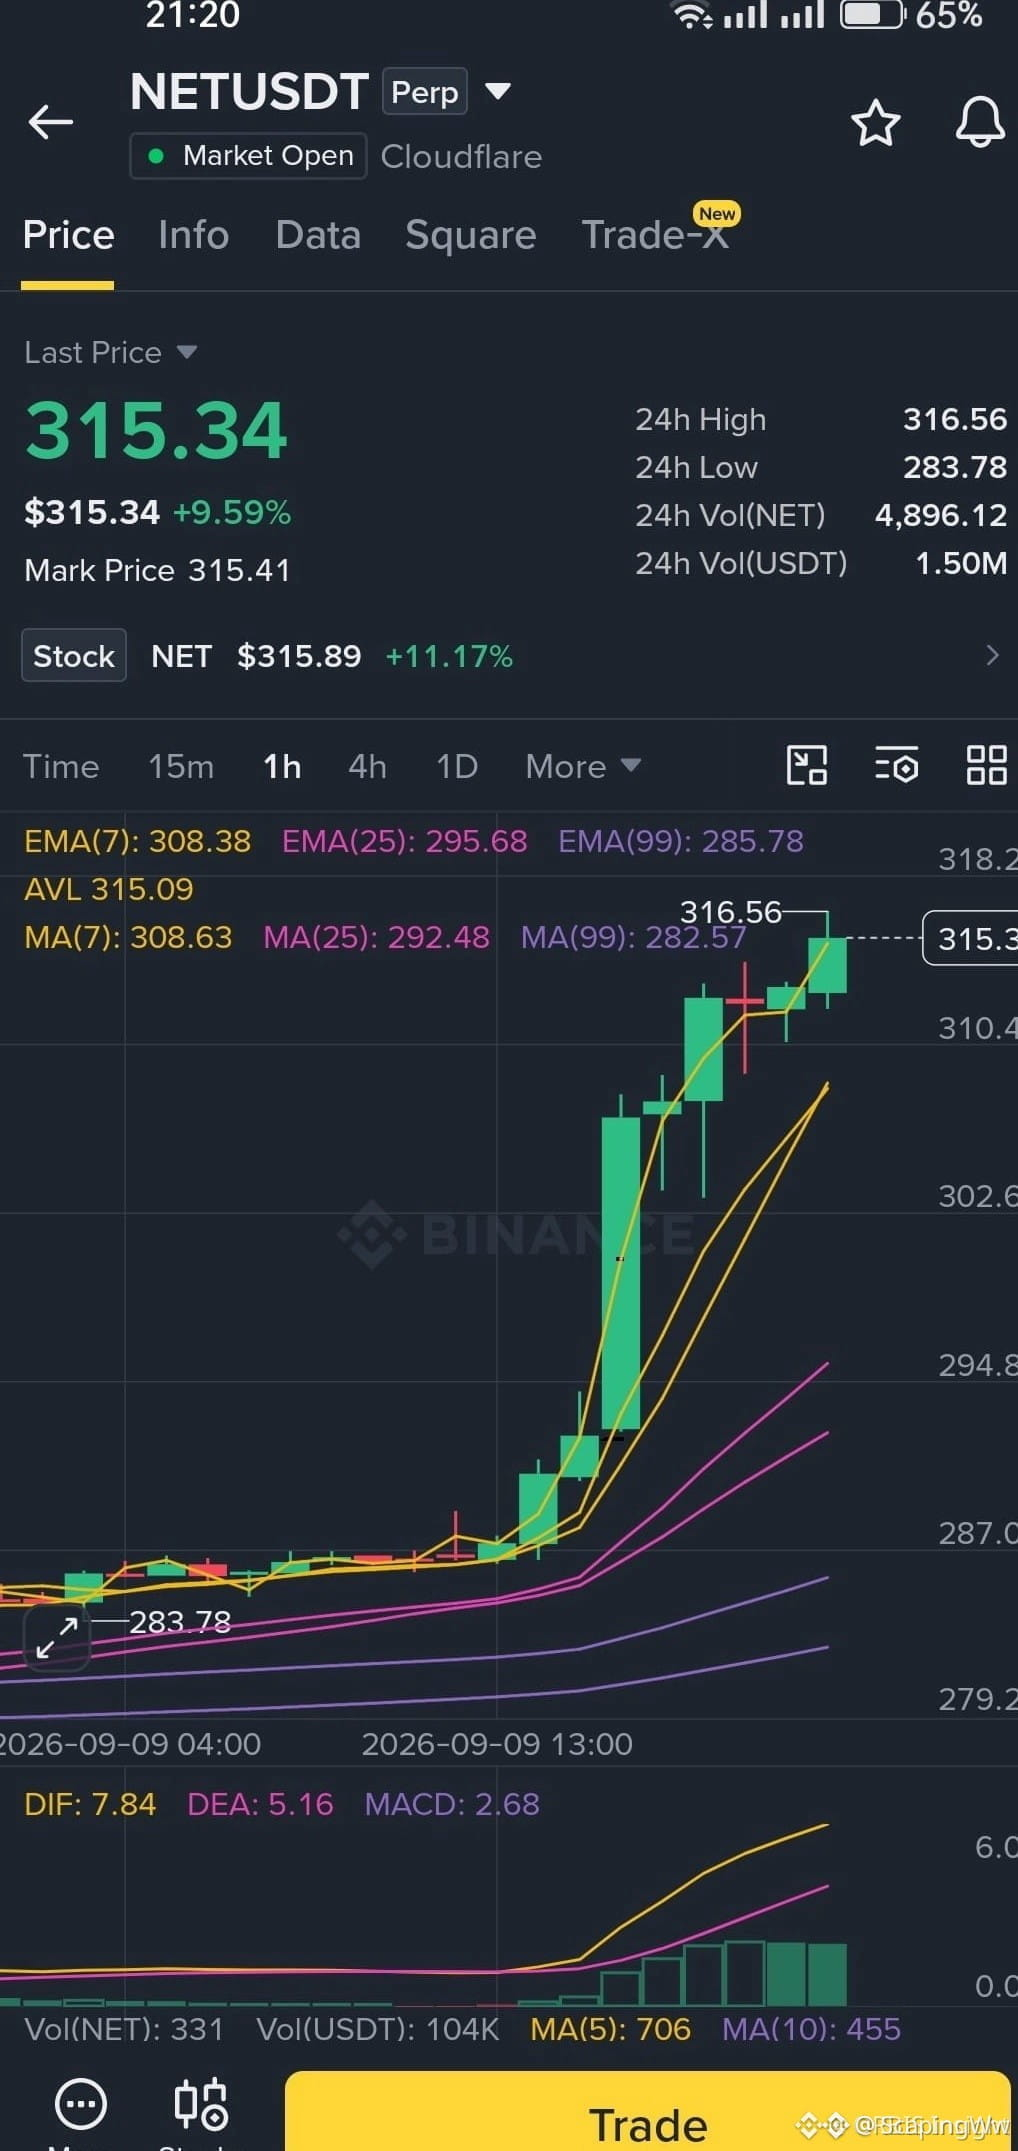
8

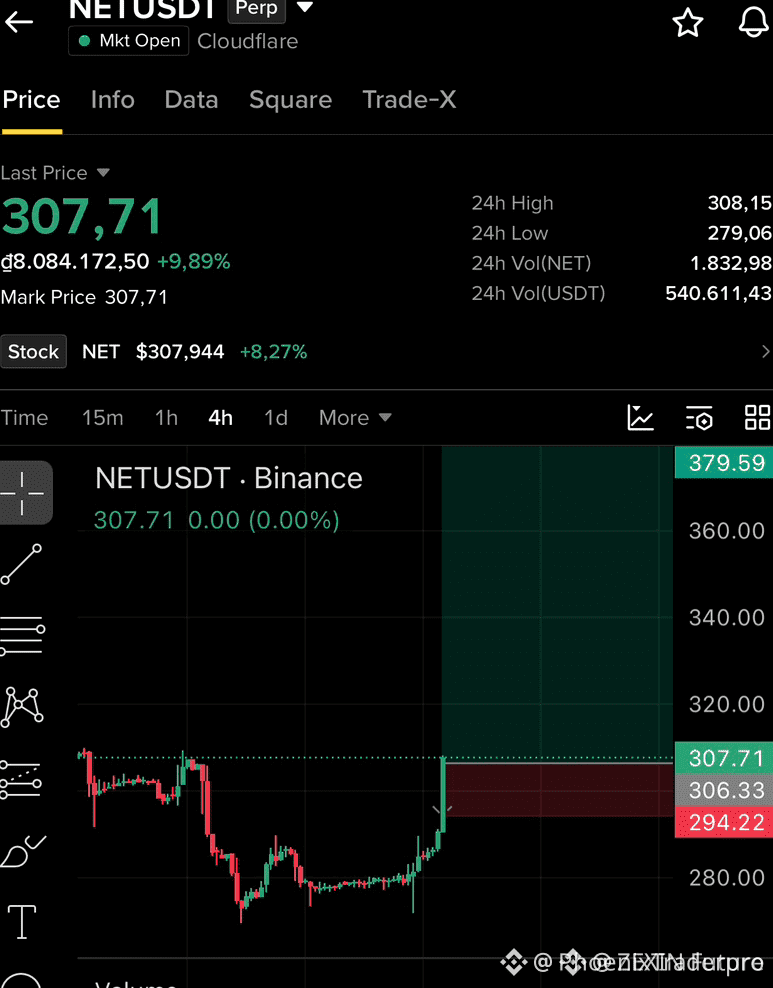
🚀 $NET ROARING INTO A PRINTING PRESS BREAKOUT! 💥
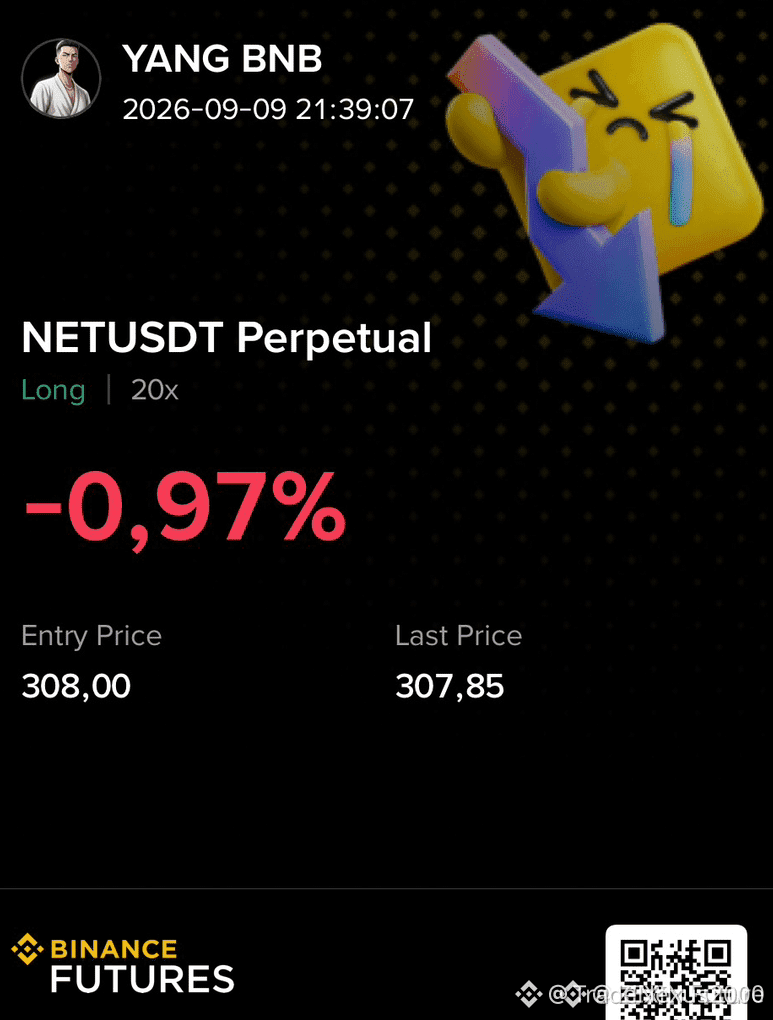
Entry: 307.71 ⚡
Target: 379.59 🚀
Stop Loss: 294.22 ⚠️
Smart money is already stacking $NET at the 307.71 zone, flipping the order block into a fresh printing press. 📊 Volume is spiking and the liquidity pool below 294 is screaming for a sweep.
The next resistance sits at 379.59, primed for a high‑velocity ride. ⚡ Watch the order‑flow wall; a break could catapult the price to new highs. 💡💬 Are you ready to ride the wave or waiting for the next liquidity trap? 👇
⚠️ Not financial advice. Always manage your risk. 🛡️
🏷️ #NET #LongSetup #Breakout #Crypto
🔥 💎
🚀 $NET ROARING INTO A PRINTING PRESS BREAKOUT! 💥
Entry: 307.71 ⚡
Target: 379.59 🚀
Stop Loss: 294.22 ⚠️
Smart money is already stacking $NET at the 307.71 zone, flipping the order block into a fresh printing press. 📊 Volume is spiking and the liquidity pool below 294 is screaming for a sweep.
The next resistance sits at 379.59, primed for a high‑velocity ride. ⚡ Watch the order‑flow wall; a break could catapult the price to new highs. 💡💬 Are you ready to ride the wave or waiting for the next liquidity trap? 👇
⚠️ Not financial advice. Always manage your risk. 🛡️
🏷️ #NET #LongSetup #Breakout #Crypto
🔥 💎
Entry: 307.71 ⚡
Target: 379.59 🚀
Stop Loss: 294.22 ⚠️
Smart money is already stacking $NET at the 307.71 zone, flipping the order block into a fresh printing press. 📊 Volume is spiking and the liquidity pool below 294 is screaming for a sweep.
The next resistance sits at 379.59, primed for a high‑velocity ride. ⚡ Watch the order‑flow wall; a break could catapult the price to new highs. 💡💬 Are you ready to ride the wave or waiting for the next liquidity trap? 👇
⚠️ Not financial advice. Always manage your risk. 🛡️
🏷️ #NET #LongSetup #Breakout #Crypto
🔥 💎
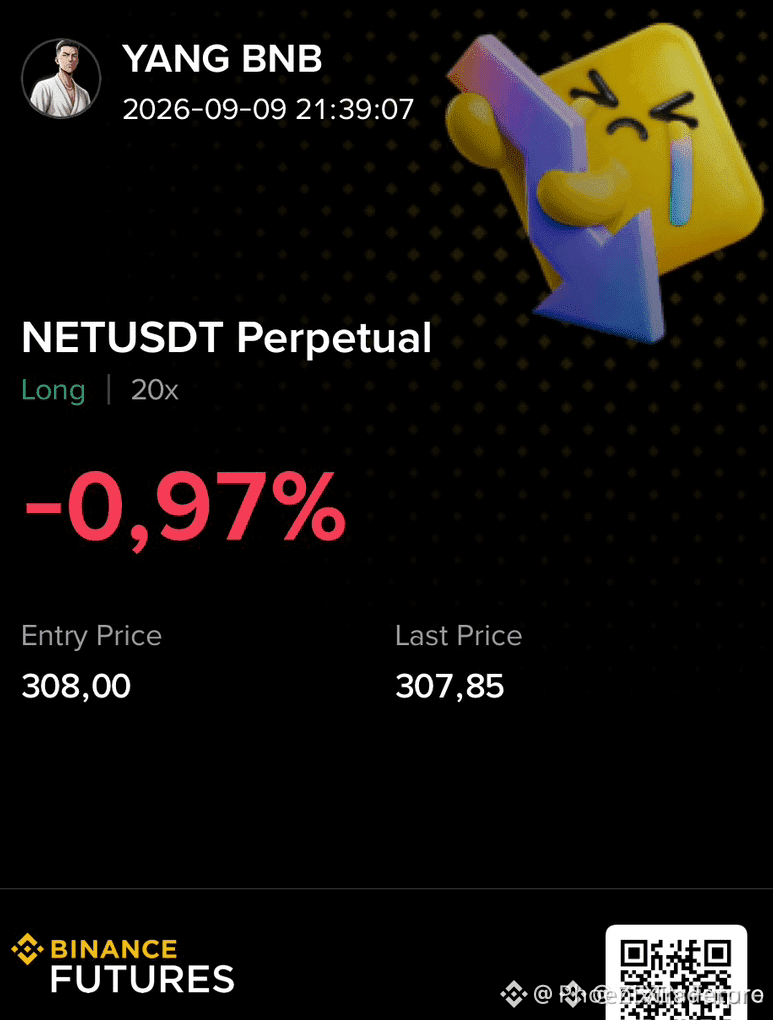
70
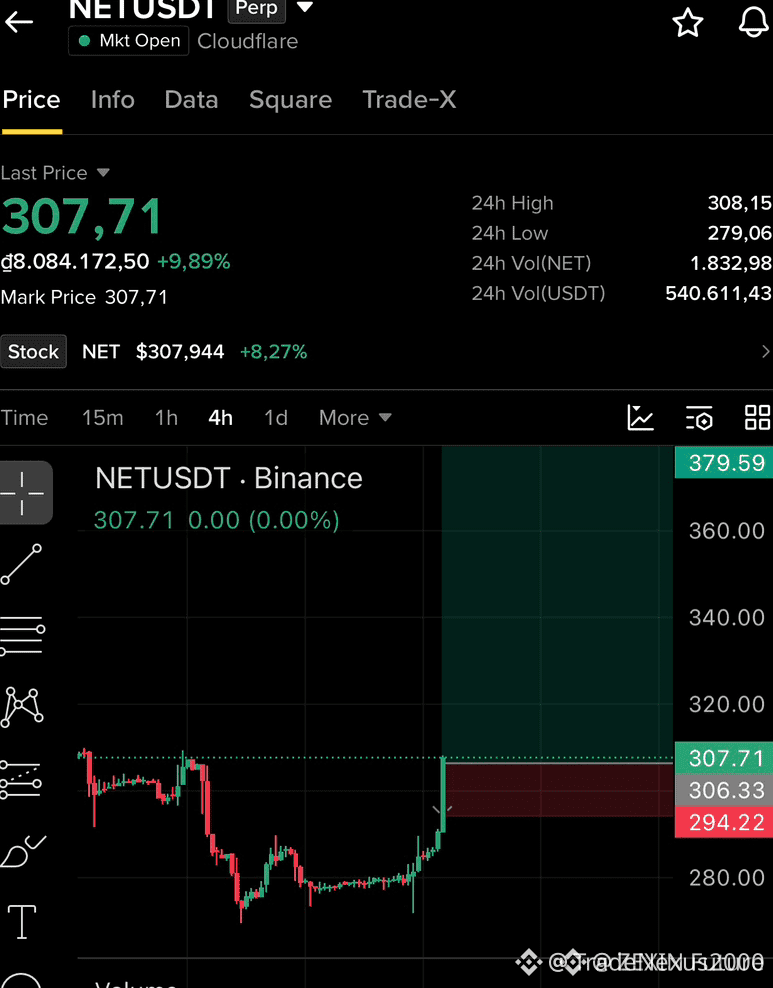
🚀 $NET UNLEASHES A MONEY‑PRINTING MACHINE! 🟢
Entry: 307.71 ⚡
Target: 379.59 🚀
Stop Loss: 294.22 ⚠️
📊 The order block anchored at 307.71 has already absorbed three rounds of seller pressure, signalling a deep smart‑money accumulation zone. 🌊 Liquidity hunters are being forced to the downside, leaving a pristine buying corridor that the next wave can ride with minimal friction. ⚡ Volume on the 4H chart is expanding, and the RSI is carving a bullish divergence, underscoring a potent inefficiency fill.
💡 With a risk‑to‑reward near 1:2.5, this setup rewards disciplined entries and disciplined exits. 🤔 Are you ready to ride the $NET surge or watching from the sidelines? 💬
⚠️ Not financial advice. Always manage your risk. 🛡️
🏷️ #NET #LongSetup #LiquiditySweep #HighRROpportunity #Crypto
🔥 💎
🚀 $NET UNLEASHES A MONEY‑PRINTING MACHINE! 🟢
Entry: 307.71 ⚡
Target: 379.59 🚀
Stop Loss: 294.22 ⚠️
📊 The order block anchored at 307.71 has already absorbed three rounds of seller pressure, signalling a deep smart‑money accumulation zone. 🌊 Liquidity hunters are being forced to the downside, leaving a pristine buying corridor that the next wave can ride with minimal friction. ⚡ Volume on the 4H chart is expanding, and the RSI is carving a bullish divergence, underscoring a potent inefficiency fill.
💡 With a risk‑to‑reward near 1:2.5, this setup rewards disciplined entries and disciplined exits. 🤔 Are you ready to ride the $NET surge or watching from the sidelines? 💬
⚠️ Not financial advice. Always manage your risk. 🛡️
🏷️ #NET #LongSetup #LiquiditySweep #HighRROpportunity #Crypto
🔥 💎
Entry: 307.71 ⚡
Target: 379.59 🚀
Stop Loss: 294.22 ⚠️
📊 The order block anchored at 307.71 has already absorbed three rounds of seller pressure, signalling a deep smart‑money accumulation zone. 🌊 Liquidity hunters are being forced to the downside, leaving a pristine buying corridor that the next wave can ride with minimal friction. ⚡ Volume on the 4H chart is expanding, and the RSI is carving a bullish divergence, underscoring a potent inefficiency fill.
💡 With a risk‑to‑reward near 1:2.5, this setup rewards disciplined entries and disciplined exits. 🤔 Are you ready to ride the $NET surge or watching from the sidelines? 💬
⚠️ Not financial advice. Always manage your risk. 🛡️
🏷️ #NET #LongSetup #LiquiditySweep #HighRROpportunity #Crypto
🔥 💎
99

·
--
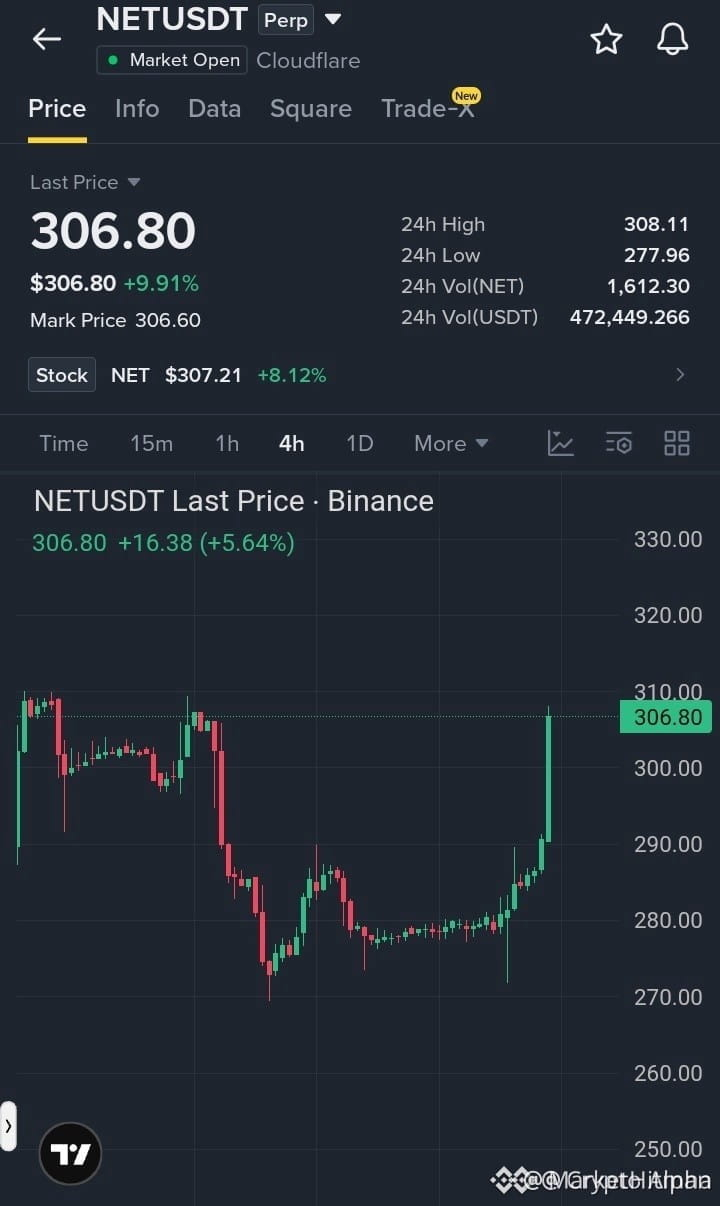
🚀 $NET BREAKS $280‑$290 ZONE, RACING TOWARD $310 RESISTANCE 🦈
Entry: 300-307 ⚡
Target: 312/320/330 🚀
Stop Loss: 292 ⚠️
The 4H chart reveals a pristine order block at $300‑$307 where smart‑money has been gobbling liquidity, and volume spikes underline the bullish thrust. 📊 A decisive close above $310 would unleash a liquidity sweep, paving the way for the next rungs at $312, $320 and $330 while the $292 stop keeps risk razor‑sharp. ⚡
💬 Do you anticipate $NET blasting past $310 or taking a breather for a second pull? 👇
⚠️ Not financial advice. Always manage your risk. 🛡️
🏷️ #NET #LongSetup #Breakout #Crypto
🔥 💎
🚀 $NET BREAKS $280‑$290 ZONE, RACING TOWARD $310 RESISTANCE 🦈
Entry: 300-307 ⚡
Target: 312/320/330 🚀
Stop Loss: 292 ⚠️
The 4H chart reveals a pristine order block at $300‑$307 where smart‑money has been gobbling liquidity, and volume spikes underline the bullish thrust. 📊 A decisive close above $310 would unleash a liquidity sweep, paving the way for the next rungs at $312, $320 and $330 while the $292 stop keeps risk razor‑sharp. ⚡
💬 Do you anticipate $NET blasting past $310 or taking a breather for a second pull? 👇
⚠️ Not financial advice. Always manage your risk. 🛡️
🏷️ #NET #LongSetup #Breakout #Crypto
🔥 💎
Entry: 300-307 ⚡
Target: 312/320/330 🚀
Stop Loss: 292 ⚠️
The 4H chart reveals a pristine order block at $300‑$307 where smart‑money has been gobbling liquidity, and volume spikes underline the bullish thrust. 📊 A decisive close above $310 would unleash a liquidity sweep, paving the way for the next rungs at $312, $320 and $330 while the $292 stop keeps risk razor‑sharp. ⚡
💬 Do you anticipate $NET blasting past $310 or taking a breather for a second pull? 👇
⚠️ Not financial advice. Always manage your risk. 🛡️
🏷️ #NET #LongSetup #Breakout #Crypto
🔥 💎
53

🚀 $NET BREAKOUT THRUSTING TOWARD $310 RESISTANCE! 💥
Entry: 300‑307 ⚡
Target: 312 🎯
Target: 320 🎯
Target: 330 🎯
Stop Loss: 292 ⚠️
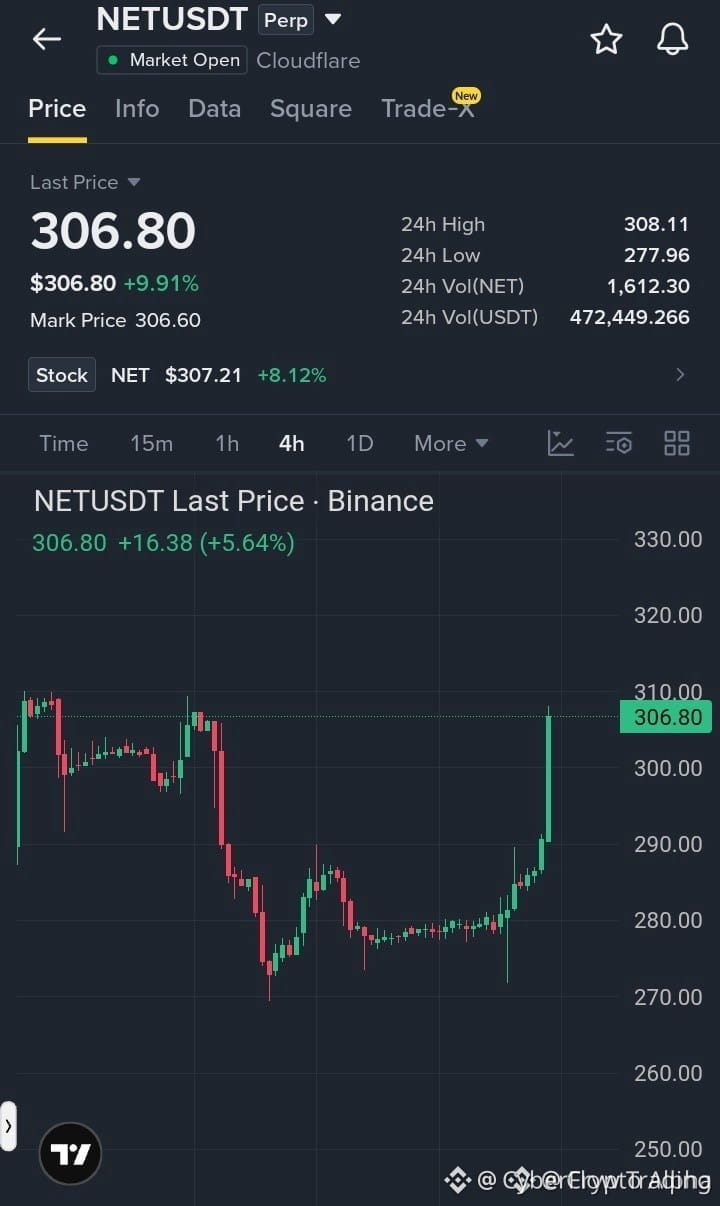
📊 The $280‑$290 box finally shattered, and $NET is cruising at $306.80 on the 4H with buying pressure roaring like a freight train. ⚡ Momentum spikes and aggressive order flow suggest smart money is loading the next leg.
🦈 $310 sits as a thin liquidity wall; a clean pierce could unleash a wave toward the 312‑330 corridor, where each level aligns with fresh demand zones. 📈
💬 Are you positioning your bids before the $310 ceiling cracks? 👇
⚠️ Not financial advice. Always manage your risk. 🛡️
🏷️ #NET #LongSetup #Breakout #Crypto
🔥 💎
🚀 $NET BREAKOUT THRUSTING TOWARD $310 RESISTANCE! 💥
Entry: 300‑307 ⚡
Target: 312 🎯
Target: 320 🎯
Target: 330 🎯
Stop Loss: 292 ⚠️
📊 The $280‑$290 box finally shattered, and $NET is cruising at $306.80 on the 4H with buying pressure roaring like a freight train. ⚡ Momentum spikes and aggressive order flow suggest smart money is loading the next leg.
🦈 $310 sits as a thin liquidity wall; a clean pierce could unleash a wave toward the 312‑330 corridor, where each level aligns with fresh demand zones. 📈
💬 Are you positioning your bids before the $310 ceiling cracks? 👇
⚠️ Not financial advice. Always manage your risk. 🛡️
🏷️ #NET #LongSetup #Breakout #Crypto
🔥 💎
Entry: 300‑307 ⚡
Target: 312 🎯
Target: 320 🎯
Target: 330 🎯
Stop Loss: 292 ⚠️
📊 The $280‑$290 box finally shattered, and $NET is cruising at $306.80 on the 4H with buying pressure roaring like a freight train. ⚡ Momentum spikes and aggressive order flow suggest smart money is loading the next leg.
🦈 $310 sits as a thin liquidity wall; a clean pierce could unleash a wave toward the 312‑330 corridor, where each level aligns with fresh demand zones. 📈
💬 Are you positioning your bids before the $310 ceiling cracks? 👇
⚠️ Not financial advice. Always manage your risk. 🛡️
🏷️ #NET #LongSetup #Breakout #Crypto
🔥 💎
38

·
--
🦈 $NET RIPPLES INTO LONG ZONE ON 20X LEVERAGE 🚀
📊 Smart money has been quietly building a demand block over the past sessions, repeatedly absorbing sell pressure while the order flow hints at a liquidity sweep below. The recent bullish imbalance aligns with a classic institutional accumulation pattern, and the 20X leverage backdrop amplifies the upside potential for disciplined longs. $VVV and $USELESS are merely market noise, while $NET ’s structure tells a different story. 💡 Expect a retest of the block before a potential thrust toward the next resistance corridor.
💬 How are you positioning your leverage on this emerging long bias? 👇
⚠️ Not financial advice. Always manage your risk. 🛡️
🏷️ #NET #LongSetup #SmartMoney #Leverage #Crypto
🚀 ⚡
🦈 $NET RIPPLES INTO LONG ZONE ON 20X LEVERAGE 🚀
📊 Smart money has been quietly building a demand block over the past sessions, repeatedly absorbing sell pressure while the order flow hints at a liquidity sweep below. The recent bullish imbalance aligns with a classic institutional accumulation pattern, and the 20X leverage backdrop amplifies the upside potential for disciplined longs. $VVV and $USELESS are merely market noise, while $NET ’s structure tells a different story. 💡 Expect a retest of the block before a potential thrust toward the next resistance corridor.
💬 How are you positioning your leverage on this emerging long bias? 👇
⚠️ Not financial advice. Always manage your risk. 🛡️
🏷️ #NET #LongSetup #SmartMoney #Leverage #Crypto
🚀 ⚡
📊 Smart money has been quietly building a demand block over the past sessions, repeatedly absorbing sell pressure while the order flow hints at a liquidity sweep below. The recent bullish imbalance aligns with a classic institutional accumulation pattern, and the 20X leverage backdrop amplifies the upside potential for disciplined longs. $VVV and $USELESS are merely market noise, while $NET ’s structure tells a different story. 💡 Expect a retest of the block before a potential thrust toward the next resistance corridor.
💬 How are you positioning your leverage on this emerging long bias? 👇
⚠️ Not financial advice. Always manage your risk. 🛡️
🏷️ #NET #LongSetup #SmartMoney #Leverage #Crypto
🚀 ⚡
30

🚀 $NET READY TO RIDE THE 20X LEVERAGE SURGE! 🟢
🦈 Smart money is stacking long positions around $NET , and the order flow on the 4H chart shows a clean bullish bias. 📊 Volume spikes are aligning with a rising 20‑period EMA, suggesting buyers are flipping the script on recent sellers. ⚡ Momentum is gathering steam as the price tests the upper band of the recent range.
💡 With 20 X leverage, the upside potential is massive, but the swing can be sharp. 📈 Keep an eye on the next liquidity pool; a break above could trigger a cascade of buy‑side orders. 🤔 Are you loading up now or waiting for the next wave to crest? 👇
⚠️ Not financial advice. Always manage your risk. 🛡️
🏷️ #NET #LongSetup #20XLeverage #Crypto #Bullish
🔥 💎
🚀 $NET READY TO RIDE THE 20X LEVERAGE SURGE! 🟢
🦈 Smart money is stacking long positions around $NET , and the order flow on the 4H chart shows a clean bullish bias. 📊 Volume spikes are aligning with a rising 20‑period EMA, suggesting buyers are flipping the script on recent sellers. ⚡ Momentum is gathering steam as the price tests the upper band of the recent range.
💡 With 20 X leverage, the upside potential is massive, but the swing can be sharp. 📈 Keep an eye on the next liquidity pool; a break above could trigger a cascade of buy‑side orders. 🤔 Are you loading up now or waiting for the next wave to crest? 👇
⚠️ Not financial advice. Always manage your risk. 🛡️
🏷️ #NET #LongSetup #20XLeverage #Crypto #Bullish
🔥 💎
🦈 Smart money is stacking long positions around $NET , and the order flow on the 4H chart shows a clean bullish bias. 📊 Volume spikes are aligning with a rising 20‑period EMA, suggesting buyers are flipping the script on recent sellers. ⚡ Momentum is gathering steam as the price tests the upper band of the recent range.
💡 With 20 X leverage, the upside potential is massive, but the swing can be sharp. 📈 Keep an eye on the next liquidity pool; a break above could trigger a cascade of buy‑side orders. 🤔 Are you loading up now or waiting for the next wave to crest? 👇
⚠️ Not financial advice. Always manage your risk. 🛡️
🏷️ #NET #LongSetup #20XLeverage #Crypto #Bullish
🔥 💎
111

·
--
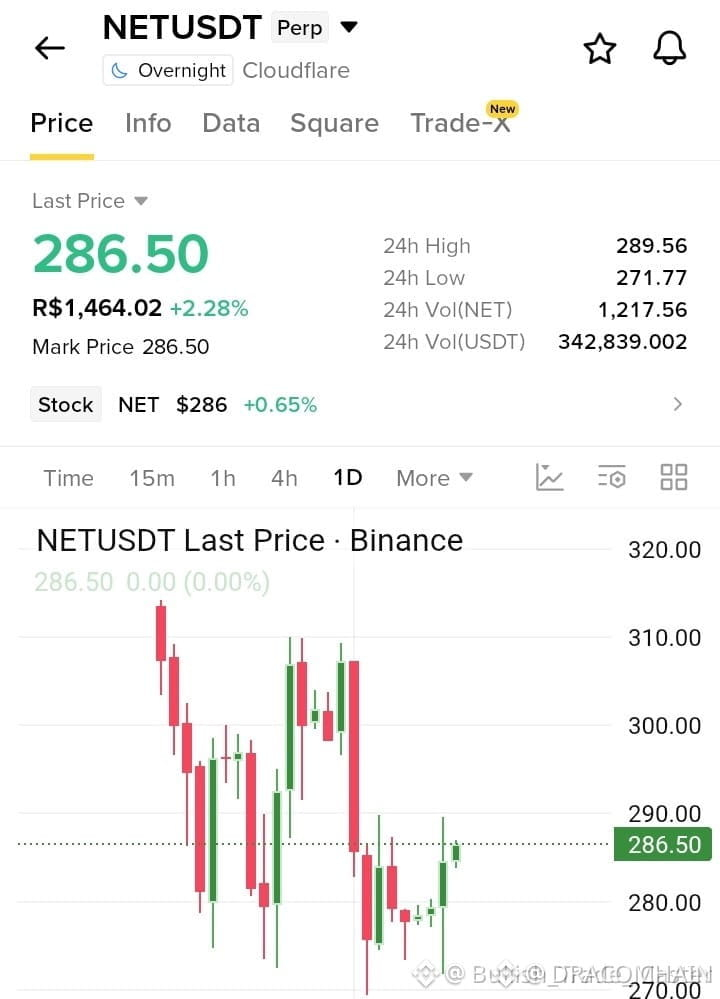
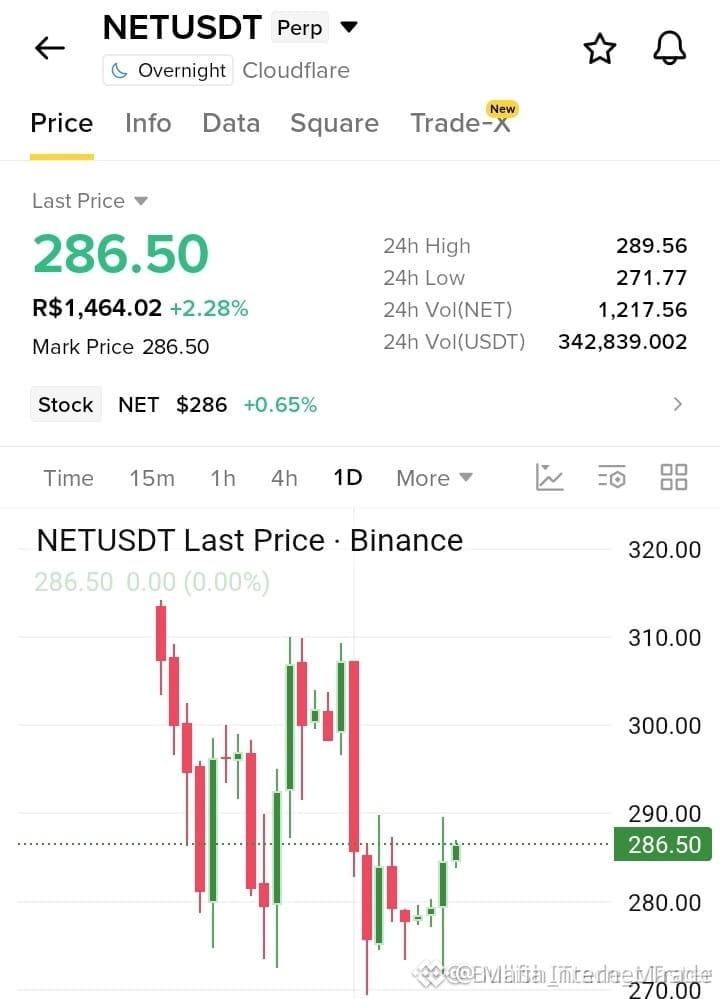
$NET #NET NETUSDT is not a traditional crypto coin. It is a USDT perpetual contract tracking Cloudflare (NYSE: NET). Binance launched the NETUSDT perpetual on August 17, 2026.
Current price: ~$285.27
24h change: +2.05%
24h range: ~$271.77–$289.56
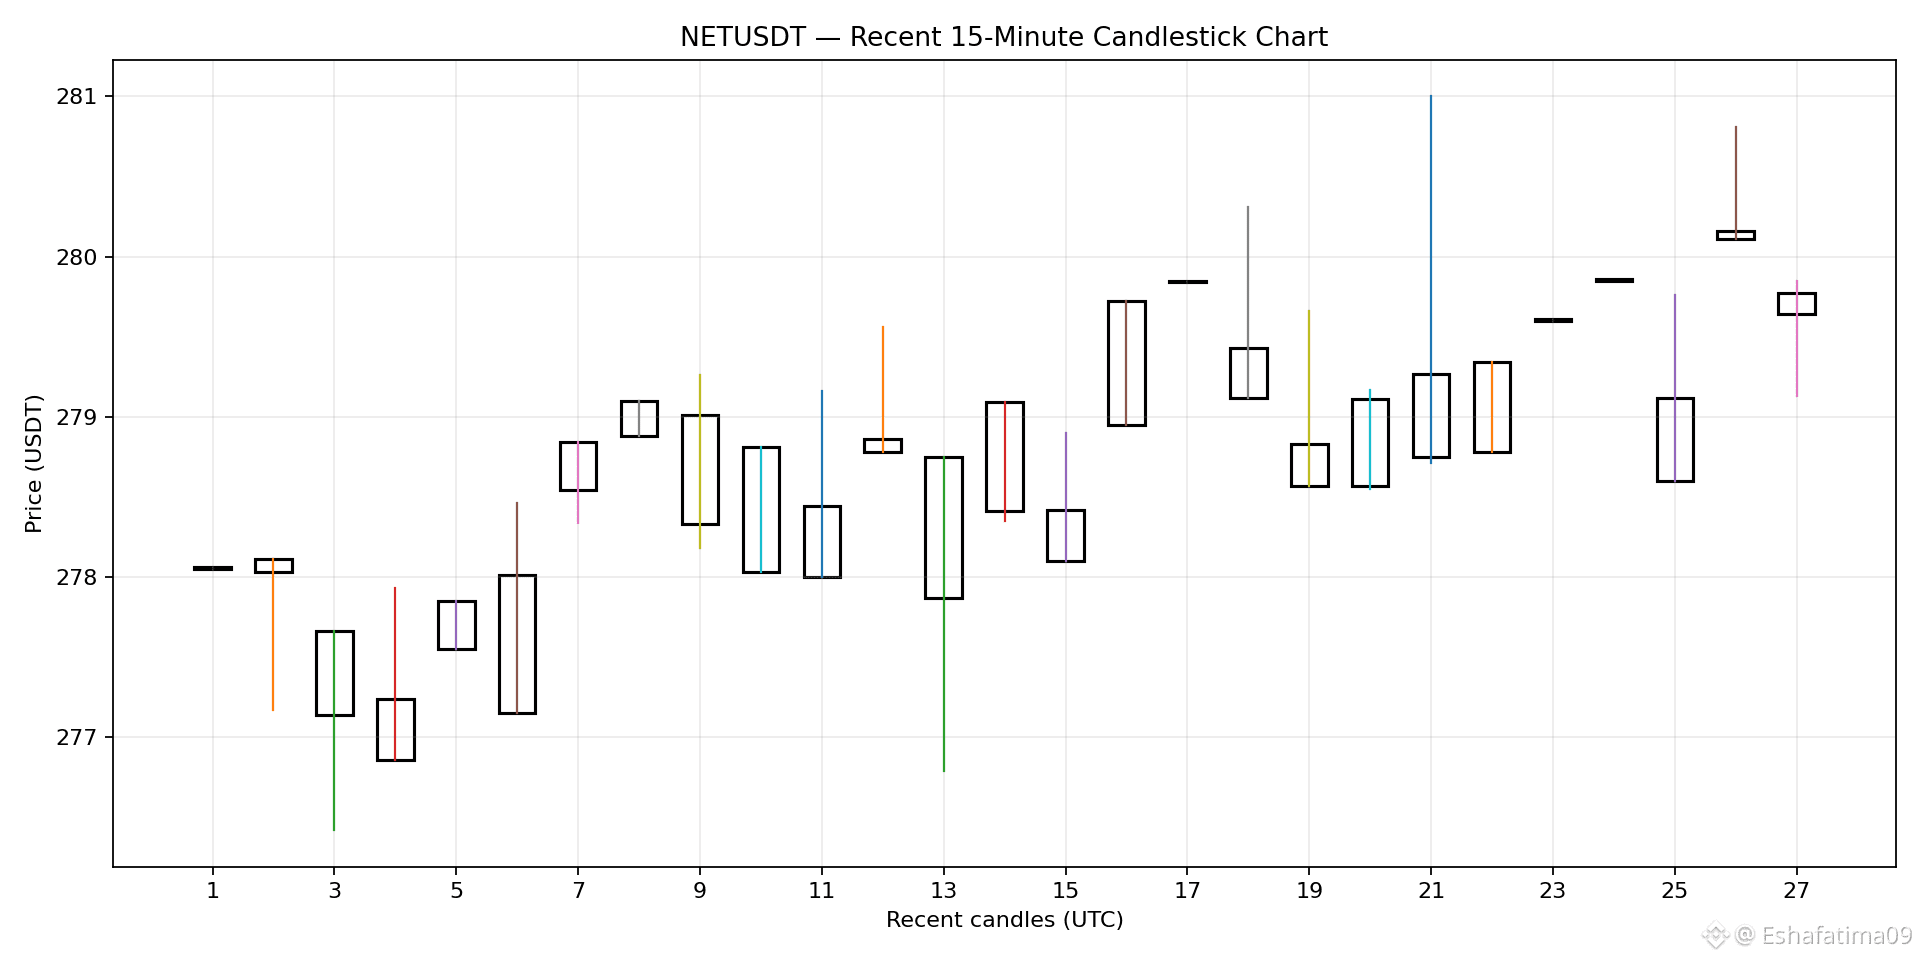
Short-term trend: Mildly bullish, but volatility remains high.
Resistance: ~$289–$290, then ~$300
Support: ~$280, followed by ~$272
Bias: 🟢 Bullish above $290; below $280, momentum could weaken.
#DowFallsOver600Points
#IranSaysItStruckTwoUSDestroyers
$NET #NET NETUSDT is not a traditional crypto coin. It is a USDT perpetual contract tracking Cloudflare (NYSE: NET). Binance launched the NETUSDT perpetual on August 17, 2026.
Current price: ~$285.27
24h change: +2.05%
24h range: ~$271.77–$289.56
Short-term trend: Mildly bullish, but volatility remains high.
Resistance: ~$289–$290, then ~$300
Support: ~$280, followed by ~$272
Bias: 🟢 Bullish above $290; below $280, momentum could weaken.
#DowFallsOver600Points
#IranSaysItStruckTwoUSDestroyers
Current price: ~$285.27
24h change: +2.05%
24h range: ~$271.77–$289.56
Short-term trend: Mildly bullish, but volatility remains high.
Resistance: ~$289–$290, then ~$300
Support: ~$280, followed by ~$272
Bias: 🟢 Bullish above $290; below $280, momentum could weaken.
#DowFallsOver600Points
#IranSaysItStruckTwoUSDestroyers
73

·
--
The old dog glanced at the data. In the past 24 hours, the price of $NET has jumped 10 points to 313.69, but the funding rate is firmly pinned at zero. Spot trading volume has surged to 2.08 million USD, yet the open interest (OI) in the leveraged market is only around 1230. Combined with the zero funding rate, this rally has a very light leveraged flavor.
The angle is M4_mover, meaning there’s unusual activity. But this move is a bit abnormal: price spikes hard, while funding is neutral. According to the iron rule of funding-rate direction, an up move together with a positive funding rate is a classic signal of crowded longs. Now the funding rate is zero, which suggests that leveraged long buyers aren’t really chasing the rally in large numbers. This 10-point surge is likely driven by direct spot buying rather than a perpetual-contract squeeze.
I didn’t compare against a secondary meme to gauge sector strength; looking at a single asset, $NET shows an independent spot行情 that’s decoupled from leverage sentiment.
My take is that this push lacks confirmation from the derivatives market, so the foundation isn’t solid. A zero funding rate during a rising trend isn’t a good sign—it means there’s no “fuel supply” from leveraged capital to keep the upside going. The strongest counter-evidence is this: institutions or large funds may be buying spot while hedging on the futures side, resulting in little net change in exposure, thereby suppressing the funding rate. In that case, prices rise but the funding rate doesn’t move—instead, it looks like a lock-up style build. But without specific OI increase/decrease data, this counter-evidence can’t be proven.
The second-order impact is: if spot buying suddenly dries up, and in a zero-funding environment there’s no liquidation/爆仓 momentum from either side to provide liquidity, then when price pulls back, support will be very thin. Those spot holders who just chased the rally will bear most of the cost.
As for actions, I’m not chasing right now. Price is up, but the derivatives indicators haven’t caught up—that’s not my cup of tea. The condition to add would be: the funding rate turns from zero to positive, and OI expands at the same time, indicating leveraged longs are stepping in to keep the行情 alive. For now, I’m choosing to watch.
The place where this view is most likely to be wrong is if $NET subsequently releases a specific source of news (e.g., a major partnership) that directly ignites spot demand and causes everything—including derivatives indicators—to be ignored as it keeps ripping higher. Then my structural analysis would fail in the short term.
Trading tag: #BinanceFutures #TradFi #USDⓈM #NET #NETUSDT $NET
The old dog glanced at the data. In the past 24 hours, the price of $NET has jumped 10 points to 313.69, but the funding rate is firmly pinned at zero. Spot trading volume has surged to 2.08 million USD, yet the open interest (OI) in the leveraged market is only around 1230. Combined with the zero funding rate, this rally has a very light leveraged flavor.
The angle is M4_mover, meaning there’s unusual activity. But this move is a bit abnormal: price spikes hard, while funding is neutral. According to the iron rule of funding-rate direction, an up move together with a positive funding rate is a classic signal of crowded longs. Now the funding rate is zero, which suggests that leveraged long buyers aren’t really chasing the rally in large numbers. This 10-point surge is likely driven by direct spot buying rather than a perpetual-contract squeeze.
I didn’t compare against a secondary meme to gauge sector strength; looking at a single asset, $NET shows an independent spot行情 that’s decoupled from leverage sentiment.
My take is that this push lacks confirmation from the derivatives market, so the foundation isn’t solid. A zero funding rate during a rising trend isn’t a good sign—it means there’s no “fuel supply” from leveraged capital to keep the upside going. The strongest counter-evidence is this: institutions or large funds may be buying spot while hedging on the futures side, resulting in little net change in exposure, thereby suppressing the funding rate. In that case, prices rise but the funding rate doesn’t move—instead, it looks like a lock-up style build. But without specific OI increase/decrease data, this counter-evidence can’t be proven.
The second-order impact is: if spot buying suddenly dries up, and in a zero-funding environment there’s no liquidation/爆仓 momentum from either side to provide liquidity, then when price pulls back, support will be very thin. Those spot holders who just chased the rally will bear most of the cost.
As for actions, I’m not chasing right now. Price is up, but the derivatives indicators haven’t caught up—that’s not my cup of tea. The condition to add would be: the funding rate turns from zero to positive, and OI expands at the same time, indicating leveraged longs are stepping in to keep the行情 alive. For now, I’m choosing to watch.
The place where this view is most likely to be wrong is if $NET subsequently releases a specific source of news (e.g., a major partnership) that directly ignites spot demand and causes everything—including derivatives indicators—to be ignored as it keeps ripping higher. Then my structural analysis would fail in the short term.
Trading tag: #BinanceFutures #TradFi #USDⓈM #NET #NETUSDT $NET
The angle is M4_mover, meaning there’s unusual activity. But this move is a bit abnormal: price spikes hard, while funding is neutral. According to the iron rule of funding-rate direction, an up move together with a positive funding rate is a classic signal of crowded longs. Now the funding rate is zero, which suggests that leveraged long buyers aren’t really chasing the rally in large numbers. This 10-point surge is likely driven by direct spot buying rather than a perpetual-contract squeeze.
I didn’t compare against a secondary meme to gauge sector strength; looking at a single asset, $NET shows an independent spot行情 that’s decoupled from leverage sentiment.
My take is that this push lacks confirmation from the derivatives market, so the foundation isn’t solid. A zero funding rate during a rising trend isn’t a good sign—it means there’s no “fuel supply” from leveraged capital to keep the upside going. The strongest counter-evidence is this: institutions or large funds may be buying spot while hedging on the futures side, resulting in little net change in exposure, thereby suppressing the funding rate. In that case, prices rise but the funding rate doesn’t move—instead, it looks like a lock-up style build. But without specific OI increase/decrease data, this counter-evidence can’t be proven.
The second-order impact is: if spot buying suddenly dries up, and in a zero-funding environment there’s no liquidation/爆仓 momentum from either side to provide liquidity, then when price pulls back, support will be very thin. Those spot holders who just chased the rally will bear most of the cost.
As for actions, I’m not chasing right now. Price is up, but the derivatives indicators haven’t caught up—that’s not my cup of tea. The condition to add would be: the funding rate turns from zero to positive, and OI expands at the same time, indicating leveraged longs are stepping in to keep the行情 alive. For now, I’m choosing to watch.
The place where this view is most likely to be wrong is if $NET subsequently releases a specific source of news (e.g., a major partnership) that directly ignites spot demand and causes everything—including derivatives indicators—to be ignored as it keeps ripping higher. Then my structural analysis would fail in the short term.
Trading tag: #BinanceFutures #TradFi #USDⓈM #NET #NETUSDT $NET
·
--
$NET In the past 24 hours, it surged more than 10%, hitting $312.61. Such a sudden rally usually sees funding rates get pushed higher, meaning longs pay the cost for their positions. But its funding rate is zero—so neither side has to pay the other. Combined with the open interest of 1,294.39, this rally hasn’t yet shown extreme one-sided pressure in either positions or funding costs.
My core view is that this kind of price spike paired with a neutral funding rate typically indicates that the rally’s main force isn’t being driven by hard pushing with high-leverage futures capital. Instead, spot or lower-leverage buying is more likely the driver. Price appreciation itself attracts attention, but funding being flat means either shorts haven’t entered at scale yet, or they’re also waiting—preparing to ambush at higher levels. This is a neutral-to-bullish signal, but it absolutely doesn’t mean the uptrend is solid.
The strongest counterpoint is: a funding rate of zero could also be a sign of insufficient momentum. If the bulls were truly overpowering, the funding rate should be pushed higher. This current zero-funding state looks more like both sides are probing, with the upward move lacking leveraged “fuel” to accelerate. Once price goes sideways or stalls, it can easily trigger a chain reaction of profit-taking.
The next second-order effect is that with funding neutral, both long and short positions have relatively low costs. That makes it more likely for capital to stay in the game and for volatility to remain. If price can hold steady on the current platform or break upward further, it could force the waiting shorts to take losses and close—potentially triggering another round of short-term push higher. But the other way around also holds: if price turns down, stop-losses for longs in a zero-funding environment also won’t be gentle, and the decline could be sharp.
Where is this view most likely wrong? In that I assumed spot is dominant. If subsequent data shows price rising but trading volume shrinking, or if there are large sell orders in futures contracts, that would indicate momentum may be fading. The invalidation conditions are also clear: if within the next 24 hours the $NET price can’t hold above the $300 level, or if the funding rate turns positive but price then goes nowhere, then the continuity of this rally becomes highly questionable—my thesis would fail.
Action-wise: at this position and with the current funding, I choose to observe. If price can break above the prior high on increased volume (the specific prior high wasn’t provided in the input; here it refers to the recent high-level zone), I’ll consider following the trend and testing a small long position. If price directly falls back and breaks below $300, I will completely give up tracking this move.
Trading tags: #BinanceFutures #TradFi #USDⓈM #NET #NETUSDT $NET
$NET In the past 24 hours, it surged more than 10%, hitting $312.61. Such a sudden rally usually sees funding rates get pushed higher, meaning longs pay the cost for their positions. But its funding rate is zero—so neither side has to pay the other. Combined with the open interest of 1,294.39, this rally hasn’t yet shown extreme one-sided pressure in either positions or funding costs.
My core view is that this kind of price spike paired with a neutral funding rate typically indicates that the rally’s main force isn’t being driven by hard pushing with high-leverage futures capital. Instead, spot or lower-leverage buying is more likely the driver. Price appreciation itself attracts attention, but funding being flat means either shorts haven’t entered at scale yet, or they’re also waiting—preparing to ambush at higher levels. This is a neutral-to-bullish signal, but it absolutely doesn’t mean the uptrend is solid.
The strongest counterpoint is: a funding rate of zero could also be a sign of insufficient momentum. If the bulls were truly overpowering, the funding rate should be pushed higher. This current zero-funding state looks more like both sides are probing, with the upward move lacking leveraged “fuel” to accelerate. Once price goes sideways or stalls, it can easily trigger a chain reaction of profit-taking.
The next second-order effect is that with funding neutral, both long and short positions have relatively low costs. That makes it more likely for capital to stay in the game and for volatility to remain. If price can hold steady on the current platform or break upward further, it could force the waiting shorts to take losses and close—potentially triggering another round of short-term push higher. But the other way around also holds: if price turns down, stop-losses for longs in a zero-funding environment also won’t be gentle, and the decline could be sharp.
Where is this view most likely wrong? In that I assumed spot is dominant. If subsequent data shows price rising but trading volume shrinking, or if there are large sell orders in futures contracts, that would indicate momentum may be fading. The invalidation conditions are also clear: if within the next 24 hours the $NET price can’t hold above the $300 level, or if the funding rate turns positive but price then goes nowhere, then the continuity of this rally becomes highly questionable—my thesis would fail.
Action-wise: at this position and with the current funding, I choose to observe. If price can break above the prior high on increased volume (the specific prior high wasn’t provided in the input; here it refers to the recent high-level zone), I’ll consider following the trend and testing a small long position. If price directly falls back and breaks below $300, I will completely give up tracking this move.
Trading tags: #BinanceFutures #TradFi #USDⓈM #NET #NETUSDT $NET
My core view is that this kind of price spike paired with a neutral funding rate typically indicates that the rally’s main force isn’t being driven by hard pushing with high-leverage futures capital. Instead, spot or lower-leverage buying is more likely the driver. Price appreciation itself attracts attention, but funding being flat means either shorts haven’t entered at scale yet, or they’re also waiting—preparing to ambush at higher levels. This is a neutral-to-bullish signal, but it absolutely doesn’t mean the uptrend is solid.
The strongest counterpoint is: a funding rate of zero could also be a sign of insufficient momentum. If the bulls were truly overpowering, the funding rate should be pushed higher. This current zero-funding state looks more like both sides are probing, with the upward move lacking leveraged “fuel” to accelerate. Once price goes sideways or stalls, it can easily trigger a chain reaction of profit-taking.
The next second-order effect is that with funding neutral, both long and short positions have relatively low costs. That makes it more likely for capital to stay in the game and for volatility to remain. If price can hold steady on the current platform or break upward further, it could force the waiting shorts to take losses and close—potentially triggering another round of short-term push higher. But the other way around also holds: if price turns down, stop-losses for longs in a zero-funding environment also won’t be gentle, and the decline could be sharp.
Where is this view most likely wrong? In that I assumed spot is dominant. If subsequent data shows price rising but trading volume shrinking, or if there are large sell orders in futures contracts, that would indicate momentum may be fading. The invalidation conditions are also clear: if within the next 24 hours the $NET price can’t hold above the $300 level, or if the funding rate turns positive but price then goes nowhere, then the continuity of this rally becomes highly questionable—my thesis would fail.
Action-wise: at this position and with the current funding, I choose to observe. If price can break above the prior high on increased volume (the specific prior high wasn’t provided in the input; here it refers to the recent high-level zone), I’ll consider following the trend and testing a small long position. If price directly falls back and breaks below $300, I will completely give up tracking this move.
Trading tags: #BinanceFutures #TradFi #USDⓈM #NET #NETUSDT $NET
39

·
--
$NET 24 hours surged 9.844%, with a quote of 307.19, but the funding rate stays at 0. When an asset climbs nearly 10% yet the long/short payments remain completely unchanged, this kind of divergence signal is rarely seen.
The reason could be that the rally is driven mainly by spot buying or short-term position closures, rather than a rush of leveraged long capital pushing prices up. Open interest is 964.09; based on the price conversion, the position size isn’t large. That suggests neither side has gone in with heavy bets in the current price range—there’s little evidence of real order-book confrontation. A zero funding rate means the holding cost is effectively zero, but it also means market sentiment hasn’t been ignited. Without leverage incentives, the uptrend lacks “fuel.”
The strongest counter-argument is that a no-fee rise like this may be an early-stage sign of the main players quietly accumulating, using spot strength to lift price without triggering alarms in the derivatives market. But the second-order impact is that the sustainability of the move is questionable, because the rally hasn’t built up “funding momentum.” If spot buying pauses, prices can easily give back gains, since the derivatives market hasn’t formed a bullish consensus strong enough to support the move.
My view is that under a single signal (zero funding rate +上涨), the risk of chasing longs outweighs the potential upside. I’ll wait for two situations before acting: (1) if the price retraces to around 280 and the funding rate remains below 0.01%, I’ll try a long; (2) if the funding rate suddenly turns positive and holds above 0.0005%, I’ll follow after confirming that long sentiment has started.
Trading tag: #TradFi #链上美股 #NET
Where do you think this set of assumptions is most likely to be wrong?
$NET 24 hours surged 9.844%, with a quote of 307.19, but the funding rate stays at 0. When an asset climbs nearly 10% yet the long/short payments remain completely unchanged, this kind of divergence signal is rarely seen.
The reason could be that the rally is driven mainly by spot buying or short-term position closures, rather than a rush of leveraged long capital pushing prices up. Open interest is 964.09; based on the price conversion, the position size isn’t large. That suggests neither side has gone in with heavy bets in the current price range—there’s little evidence of real order-book confrontation. A zero funding rate means the holding cost is effectively zero, but it also means market sentiment hasn’t been ignited. Without leverage incentives, the uptrend lacks “fuel.”
The strongest counter-argument is that a no-fee rise like this may be an early-stage sign of the main players quietly accumulating, using spot strength to lift price without triggering alarms in the derivatives market. But the second-order impact is that the sustainability of the move is questionable, because the rally hasn’t built up “funding momentum.” If spot buying pauses, prices can easily give back gains, since the derivatives market hasn’t formed a bullish consensus strong enough to support the move.
My view is that under a single signal (zero funding rate +上涨), the risk of chasing longs outweighs the potential upside. I’ll wait for two situations before acting: (1) if the price retraces to around 280 and the funding rate remains below 0.01%, I’ll try a long; (2) if the funding rate suddenly turns positive and holds above 0.0005%, I’ll follow after confirming that long sentiment has started.
Trading tag: #TradFi #链上美股 #NET
Where do you think this set of assumptions is most likely to be wrong?
The reason could be that the rally is driven mainly by spot buying or short-term position closures, rather than a rush of leveraged long capital pushing prices up. Open interest is 964.09; based on the price conversion, the position size isn’t large. That suggests neither side has gone in with heavy bets in the current price range—there’s little evidence of real order-book confrontation. A zero funding rate means the holding cost is effectively zero, but it also means market sentiment hasn’t been ignited. Without leverage incentives, the uptrend lacks “fuel.”
The strongest counter-argument is that a no-fee rise like this may be an early-stage sign of the main players quietly accumulating, using spot strength to lift price without triggering alarms in the derivatives market. But the second-order impact is that the sustainability of the move is questionable, because the rally hasn’t built up “funding momentum.” If spot buying pauses, prices can easily give back gains, since the derivatives market hasn’t formed a bullish consensus strong enough to support the move.
My view is that under a single signal (zero funding rate +上涨), the risk of chasing longs outweighs the potential upside. I’ll wait for two situations before acting: (1) if the price retraces to around 280 and the funding rate remains below 0.01%, I’ll try a long; (2) if the funding rate suddenly turns positive and holds above 0.0005%, I’ll follow after confirming that long sentiment has started.
Trading tag: #TradFi #链上美股 #NET
Where do you think this set of assumptions is most likely to be wrong?
·
--
$NET 24 hours of surge up 9.844%, current price 307.19, and the perpetual contract funding rate is still at zero. The price is rising while the funding rate is zero—this indicates that the buy-side is basically pushing with spot, and leveraged traders simply aren’t chasing. Open interest is 964.09; if this number doesn’t rise along with it, the rally is just an empty shell. A spot-driven one-way push is most likely to lead to a pullback.
A funding rate of zero means longs don’t have to pay, and shorts have no cost. The open-position structure looks balanced on the surface, but it’s actually fragile. Once the funding rate turns positive, arbitrage capital will immediately step in to short the spot and go long the contracts to capture the funding rate spread, and the price will be quickly pressured back. The strongest counter-evidence is when market sentiment suddenly flips bullish and the funding rate turns positive instantly—then the logic behind the rise collapses directly.
Second-order effects.
Trading tag: #TradFi #链上美股 #NET
Where do you think this assessment is most likely to be wrong?
$NET 24 hours of surge up 9.844%, current price 307.19, and the perpetual contract funding rate is still at zero. The price is rising while the funding rate is zero—this indicates that the buy-side is basically pushing with spot, and leveraged traders simply aren’t chasing. Open interest is 964.09; if this number doesn’t rise along with it, the rally is just an empty shell. A spot-driven one-way push is most likely to lead to a pullback.
A funding rate of zero means longs don’t have to pay, and shorts have no cost. The open-position structure looks balanced on the surface, but it’s actually fragile. Once the funding rate turns positive, arbitrage capital will immediately step in to short the spot and go long the contracts to capture the funding rate spread, and the price will be quickly pressured back. The strongest counter-evidence is when market sentiment suddenly flips bullish and the funding rate turns positive instantly—then the logic behind the rise collapses directly.
Second-order effects.
Trading tag: #TradFi #链上美股 #NET
Where do you think this assessment is most likely to be wrong?
A funding rate of zero means longs don’t have to pay, and shorts have no cost. The open-position structure looks balanced on the surface, but it’s actually fragile. Once the funding rate turns positive, arbitrage capital will immediately step in to short the spot and go long the contracts to capture the funding rate spread, and the price will be quickly pressured back. The strongest counter-evidence is when market sentiment suddenly flips bullish and the funding rate turns positive instantly—then the logic behind the rise collapses directly.
Second-order effects.
Trading tag: #TradFi #链上美股 #NET
Where do you think this assessment is most likely to be wrong?
107
Log in to explore more content
Join global crypto users on Binance Square
⚡️ Get latest and useful information about crypto.
💬 Trusted by the world’s largest crypto exchange.
👍 Discover real insights from verified creators.
Email / Phone number
Trending Topics
1
#AppleDebutsFoldablePhone
123 views
28 Discussing
2
#US10YTreasuryYieldHitsHighestSinceNov2023
3,032 views
103 Discussing
3
#USTreasuryToBuyBackUpTo$6BLongDatedDebt
8,364 views
124 Discussing
4
#BitcoinSurpasses$79K
52,970 views
250 Discussing
5
#BrentCrudeTops$100
108,748 views
373 Discussing
6
#USADPWeeklyEmploymentRises12000
79,698 views
1,028 Discussing
7
#BankOfAmericaGroupPilotsUSBDCStablecoin
61,290 views
823 Discussing
8
#RippleLobbiesToAdvanceCLARITYActVote
93,207 views
1,080 Discussing
9
#GrayscaleZcashETFTops$500M
14,203 views
122 Discussing
10
#LAPTOPFoundationXAccountSuspended
3,324 views
53 Discussing