Crypto traders may not realize how much trading fees can add up. Some even think these fees are negligible, not realizing that frequent trading can rack up a hefty bill—possibly even exceeding your initial capital. Open the Binance app and go to Funds → Futures → Today’s P&L → Funding Fees and Trading Fees to see how much you’ve paid in fees over the past year. If you trade futures frequently or with large positions, your fees could exceed your initial capital in just one month. To check whether your account is eligible for trading fee rebates, follow these steps 👉👉👉如何查看自己手续费是否有返佣
Hello everyone, I am Feige. I entered the circle in 2017, and I consider myself an old player. Along the way, I have encountered countless pitfalls and have summarized some of my own methodologies. From initially blindly following trends to now focusing more on studying cycles, macro trends, and funding logic, I have gradually found my own rhythm.
Throughout this journey, I have realized that the crypto world is not just about rises and falls; it is more like a cyclical game: some are FOMOing during the highs, while others are quietly positioning during the lows.
I currently work as a blogger at Binance Square, sharing some personal thoughts and observations. I am not a guru; I am just an old player who has experienced several rounds of bull and bear markets. I hope to share the pitfalls I have encountered and the lessons I have learned, so that newcomers can avoid detours, and also gain new inspirations through communication.
If you also believe in cycles, believe in logic, and believe in long-term accumulation, then perhaps we can become fellow travelers here.
Regarding the viewpoints of my posts, please note the following points:
1: The crypto market is constantly changing, so my viewpoints will also change with the market. This industry changes too quickly; only by continuously following industry progress can we keep growing. Sticking rigidly to conventional wisdom will only lead to being eliminated by the times. I hope everyone can be more open-minded.
2: My viewpoints published in the square are divided into short-term and long-term. For example, even if the long-term outlook is bullish, there will still be pullbacks; and even if the long-term outlook is bearish, there will be rebounds. Don’t let short-term viewpoints affect your long-term perspectives. An upward trend does not mean it will only rise without looking back; more often, it is a trend of rises and falls. Similarly, a downward trend is not a continuous crash without rebounds; more often, it is a downward trend with fluctuations. I hope everyone can understand the differences between short-term and long-term viewpoints.
3: In this market, apart from BTC, which can be blindly trusted, other coins have market cycles, especially altcoins. Before buying a coin, you should at least investigate a bit; some things need to be understood to a certain extent. You can't just buy whatever others say. Especially if you have limited funds, you need to consider the actual situation and be more cautious.
Thank you to every friend who follows and supports me. You are my motivation to keep sharing, and I hope we can all reap our own rewards in the cycle.
If you need a commission rebate, scan the QR code on Binance to add me as a friend. It's simple and easy to understand, and you can easily get in touch with me 🤝
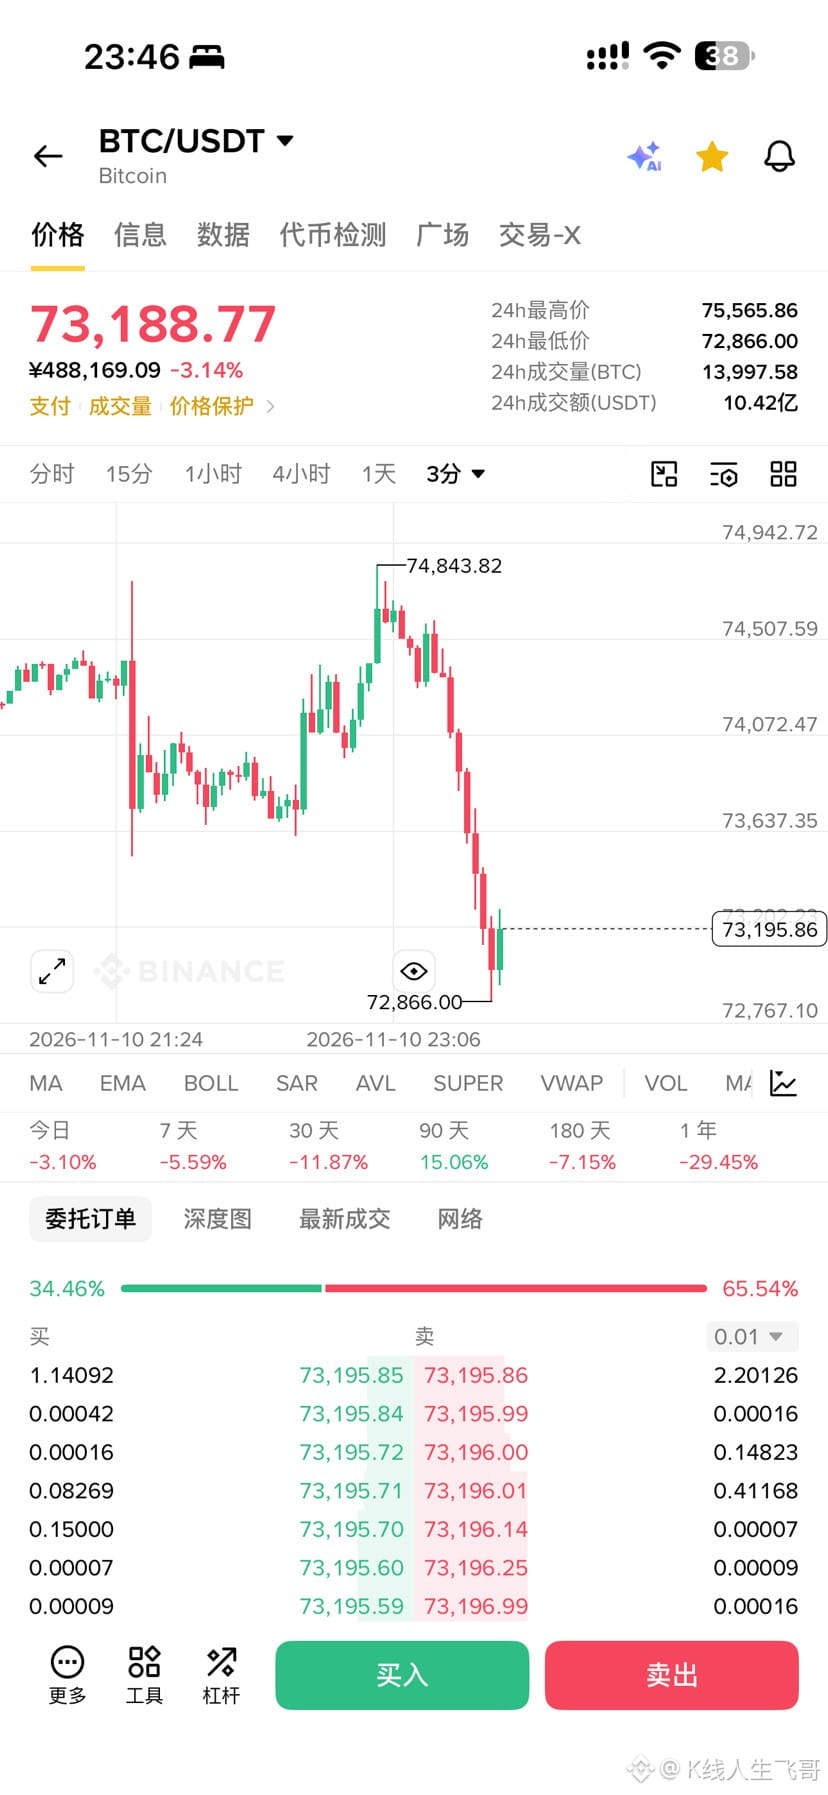
$BTC This market is a bit too brutal, isn't it? Before the crash, it even rebounded upward to liquidate the short positions and lure in longs. It really doesn’t want to let retail investors make even a little money. You could say it cast a net to wipe everyone out.
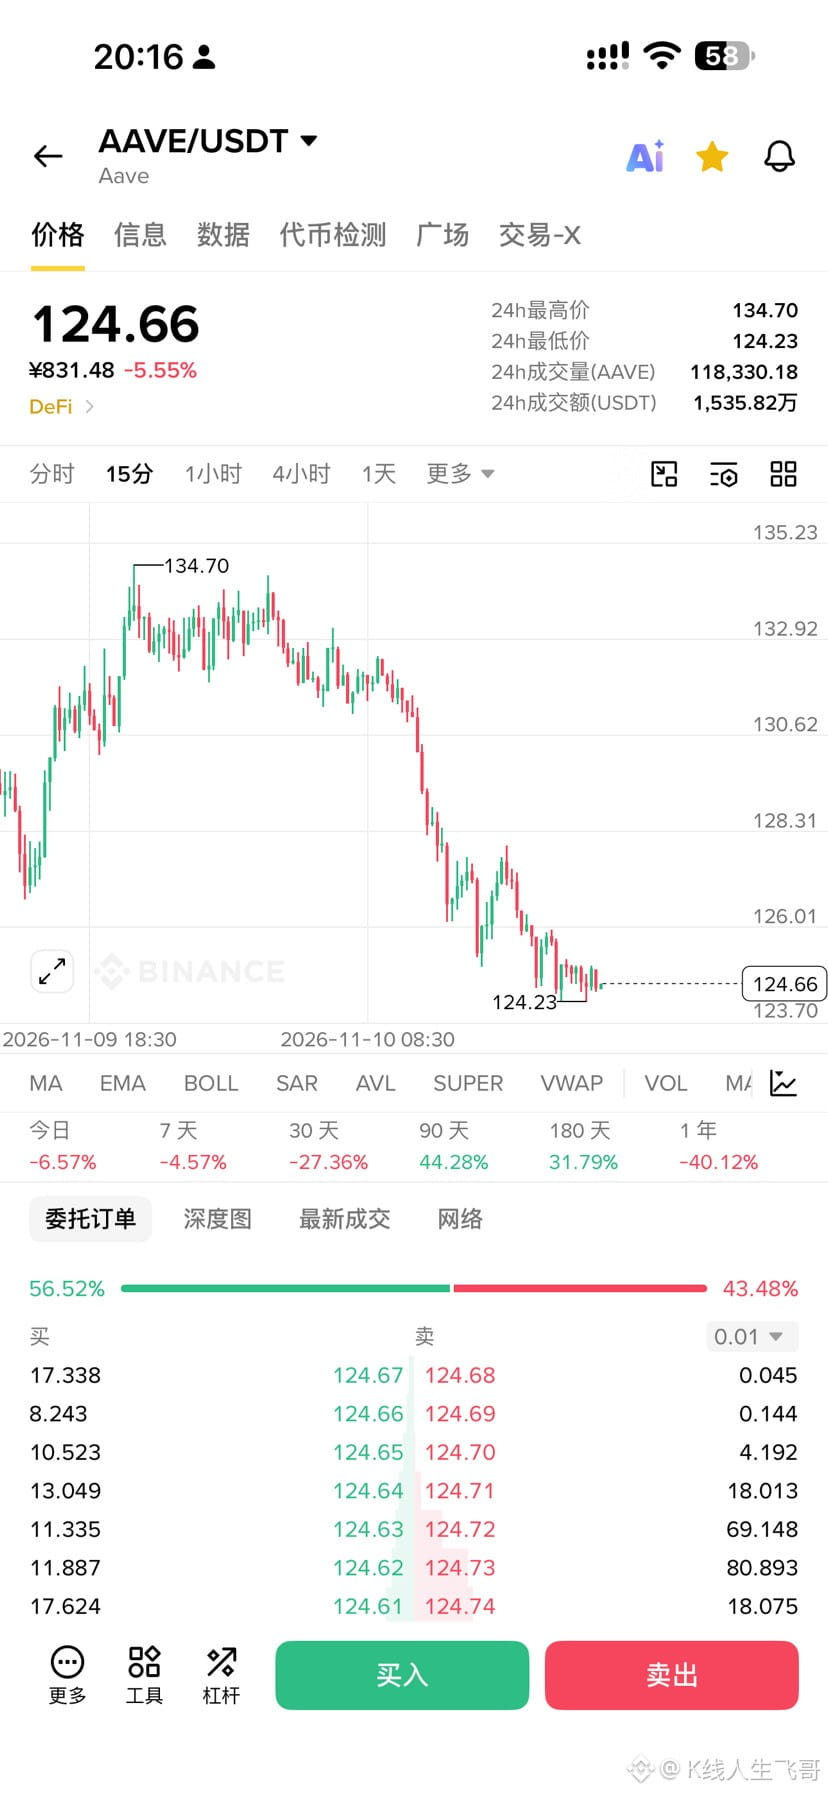
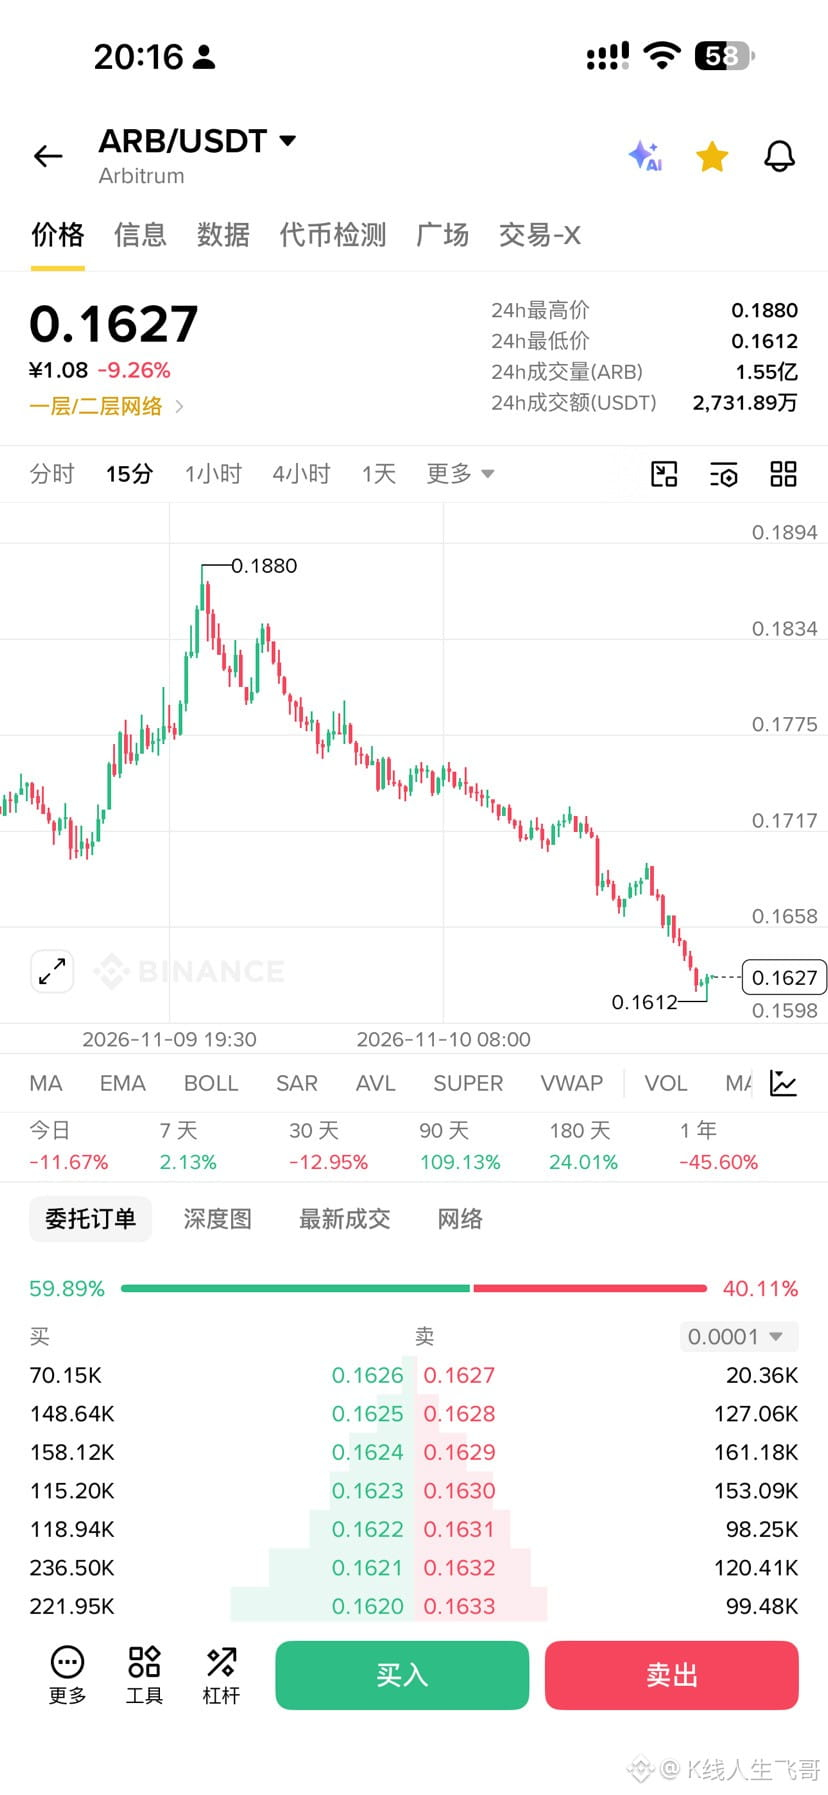
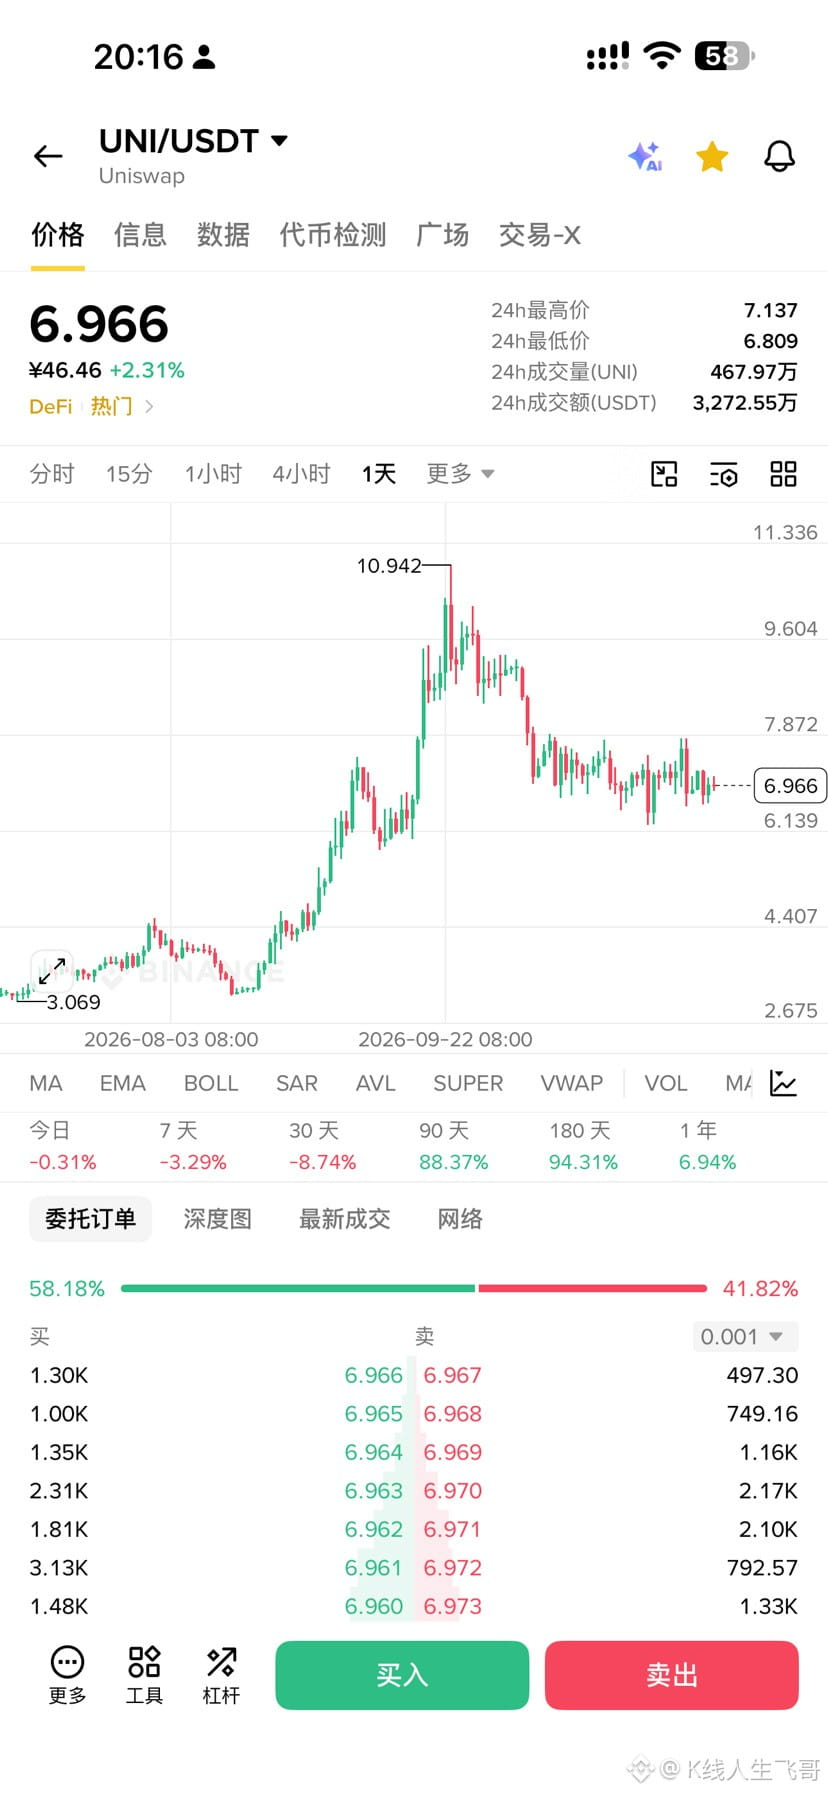
Yesterday, $ARB and AAVE rallied against the trend, giving the impression that the market had stabilized. But today they took a sharp catch-up drop. Turns out yesterday’s rally was a fakeout. Now I’m really worried that $UNI and $PEPE will also see a catch-up drop, because these two coins also seem to have stabilized, and could rebound quite well as long as the broader market holds steady. But if the broader market keeps falling, these two will still take a catch-up drop 📉, because every coin has to follow Bitcoin’s lead.
In the short term, try to stay away from crypto projects and crypto-related U.S. stocks closely associated with Trump.
The Democrats haven’t even taken office yet, but they’ve already started planning to settle scores with people connected to Trump—first Jensen Huang, and now Elon Musk. The news just came out that the U.S. is going to investigate Musk. You can see that the impact of losing control of both chambers is huge: anyone who sponsored Trump is likely to get hurt. So which coins are particularly close to Trump?
Besides Trump’s own TRUMP and WLFI, which are the first in the firing line, $XRP donated $5 million to Trump, Coinbase donated $1 million, the team behind $ONDO donated $1 million, and CRCL donated $1 million. The most notable example is CRO, which donated $37 million to Trump. After that donation, the SEC ended its investigation into the project. The team behind $SOL also donated several million dollars to fund Trump’s election campaign, and the team behind Robinhood’s U.S. stock ticker HOOD donated over a million dollars to Trump’s inauguration. Binance hasn’t openly funded Trump, but it has been quite close to him behind the scenes.
Of course, these projects have already fallen a lot in the short term. Wait for a rebound before considering an exit, since even if the Democrats want to settle scores, it will take time.
These are all crypto projects or crypto-related U.S. stocks closely associated with Trump. Keep an eye on related developments lately to avoid being caught off guard by sudden negative news.
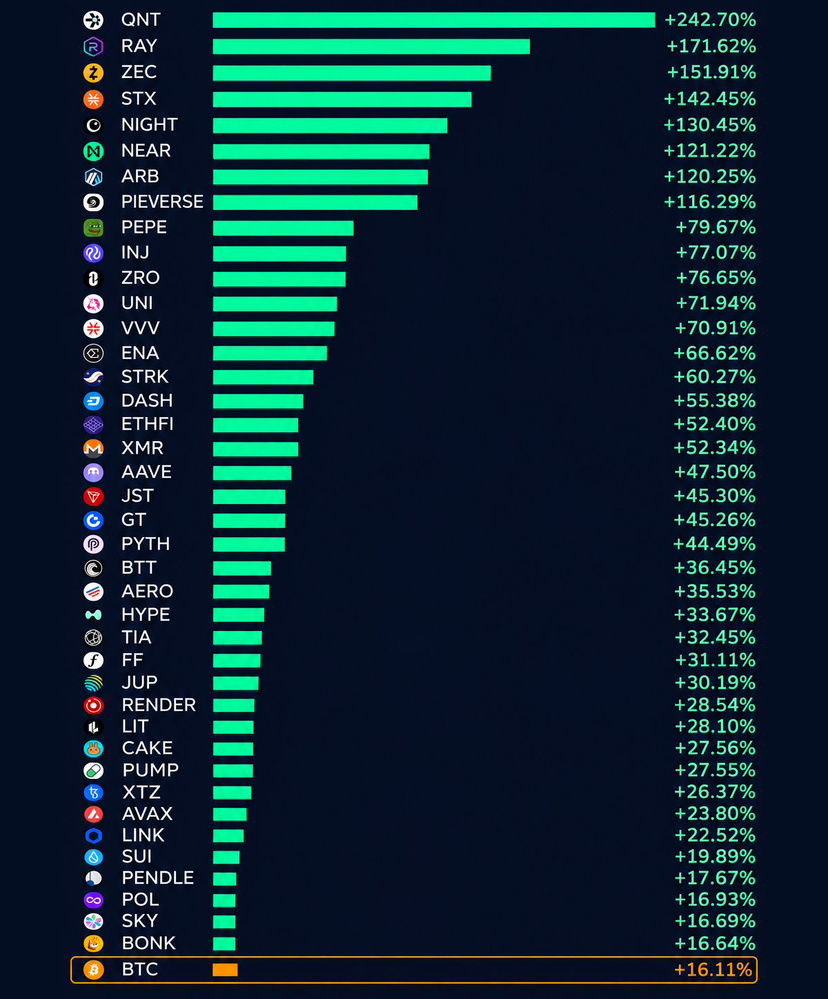
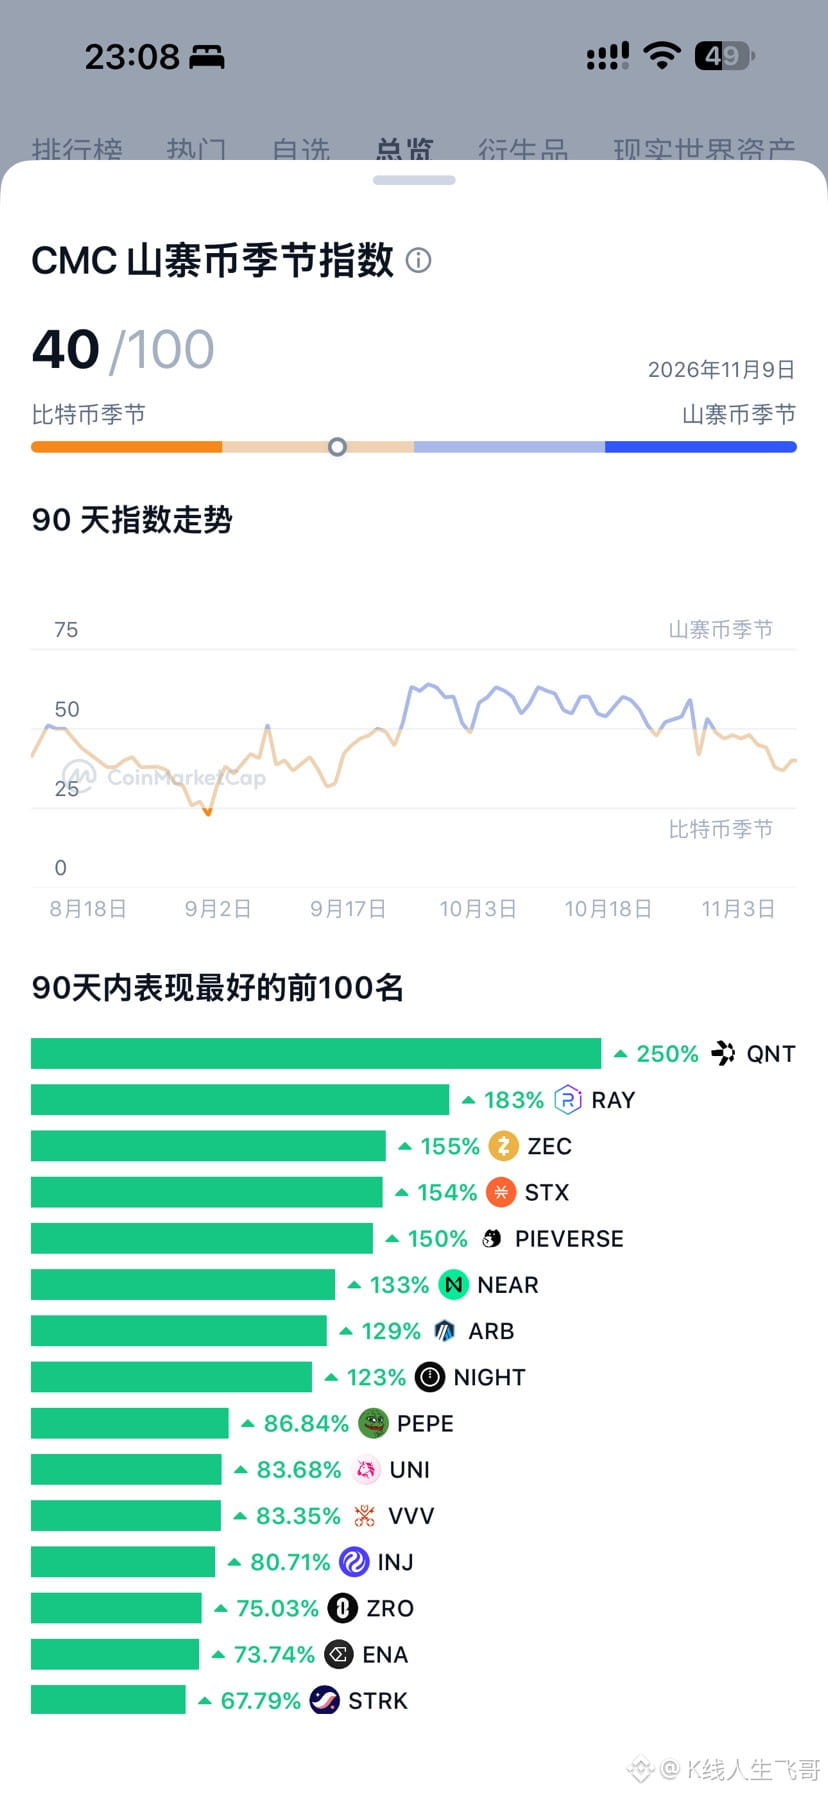
Only 40 altcoins have outperformed $BTC in the past 90 days If you don't know which altcoins to buy during this pullback, just buy the ones shown in the image. Remember: buy strength, not weakness. Trash will always be trash.
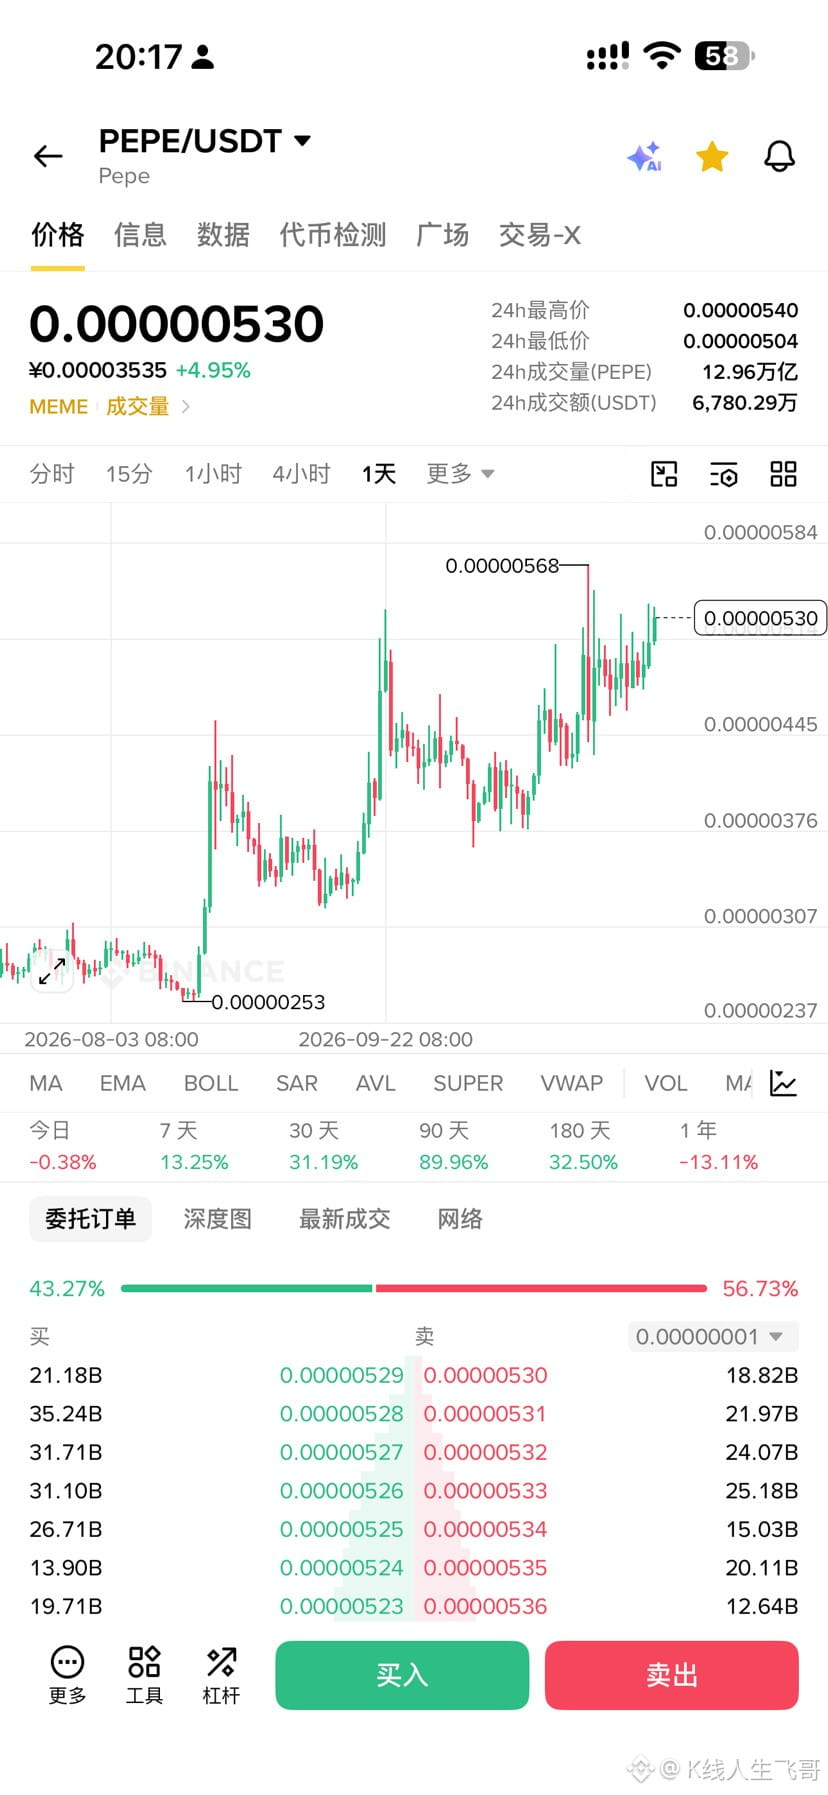
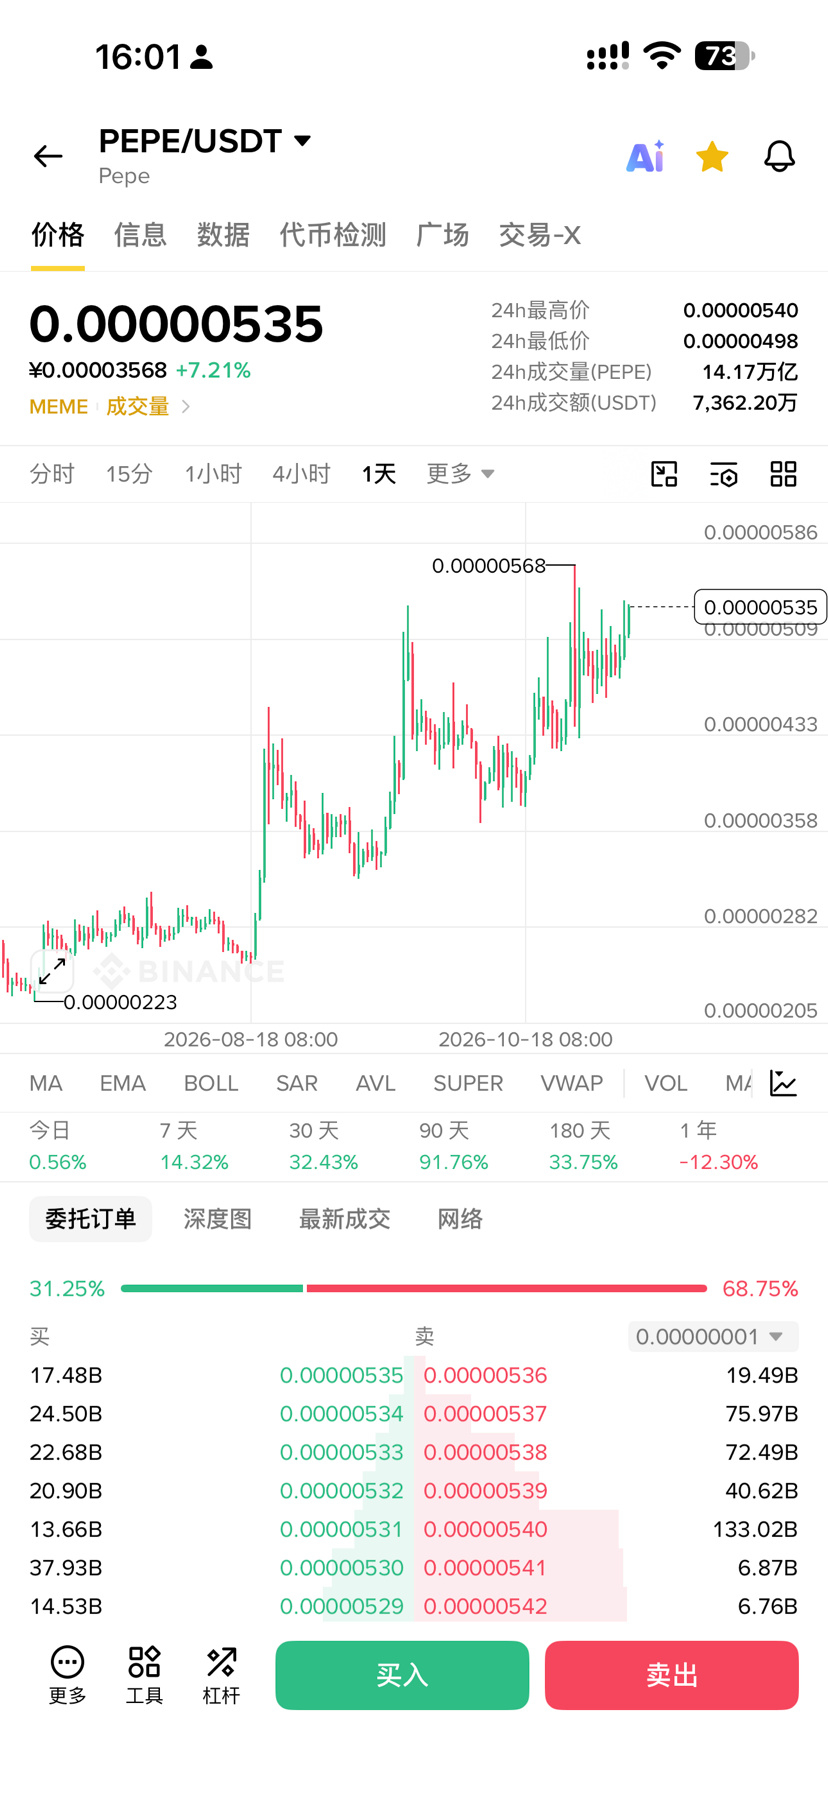
$PEPE just won’t drop any further, which suggests the crypto market is about to make a move As for MEME coins, PEPE is the spark that could ignite them You can keep an eye on $BOME and $PENGU .
Stay patient and buy into assets you believe in gradually
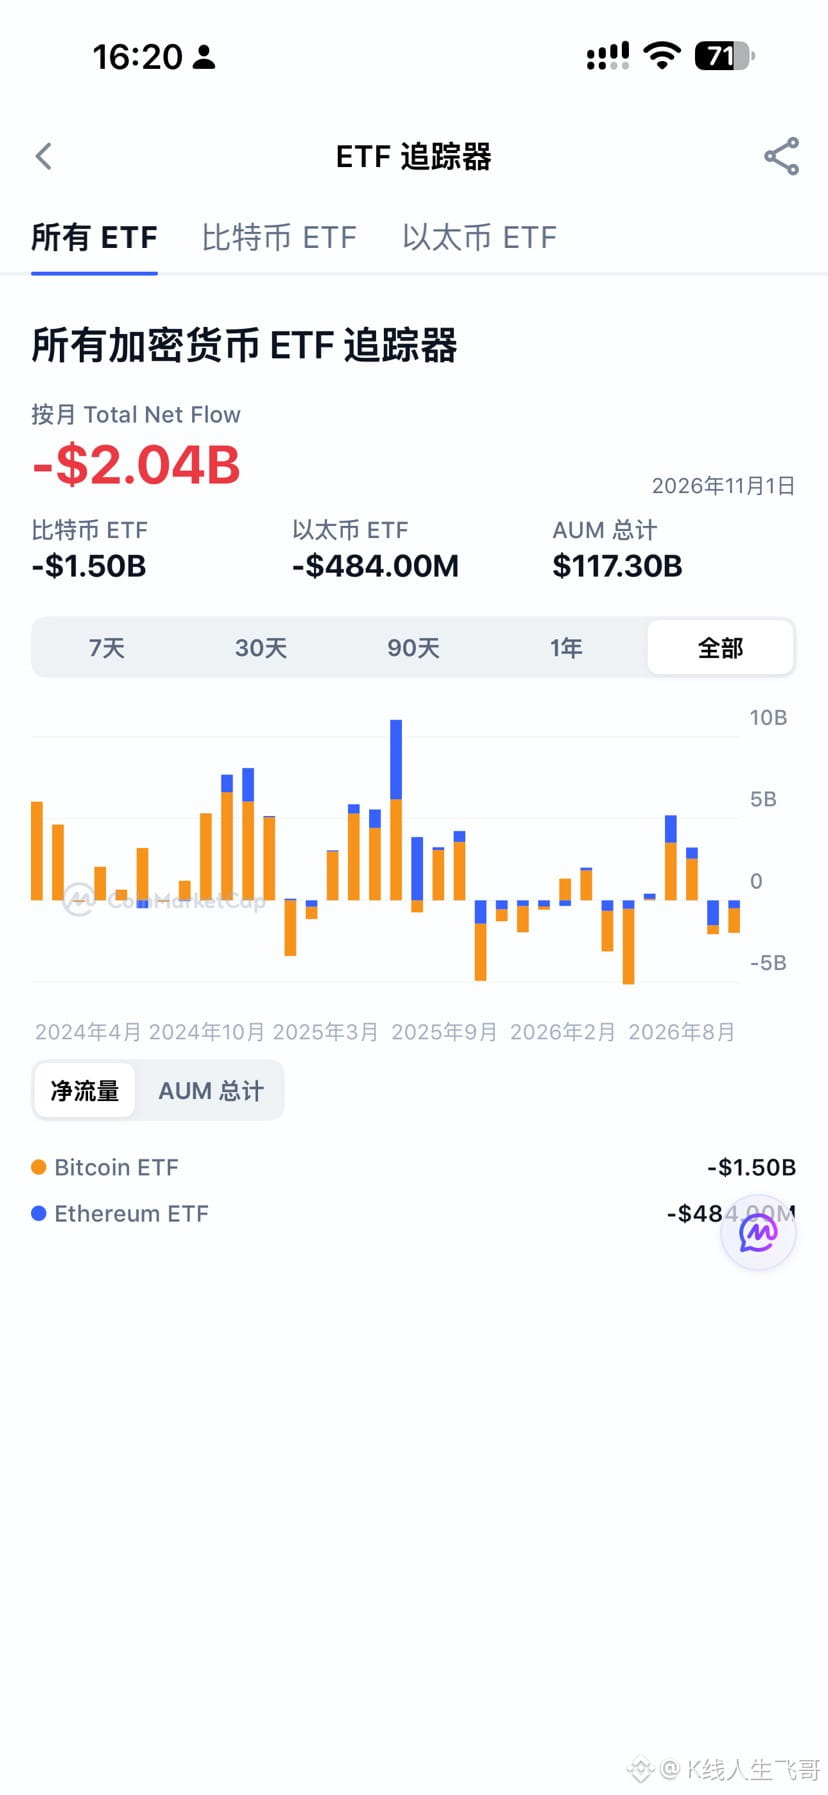
Even after the crypto market was hit by a major security incident recently, outflows from IBIT remained relatively limited. Against the backdrop of weakness across the U.S. stock market, crypto has actually shown more resilience than many people expected.
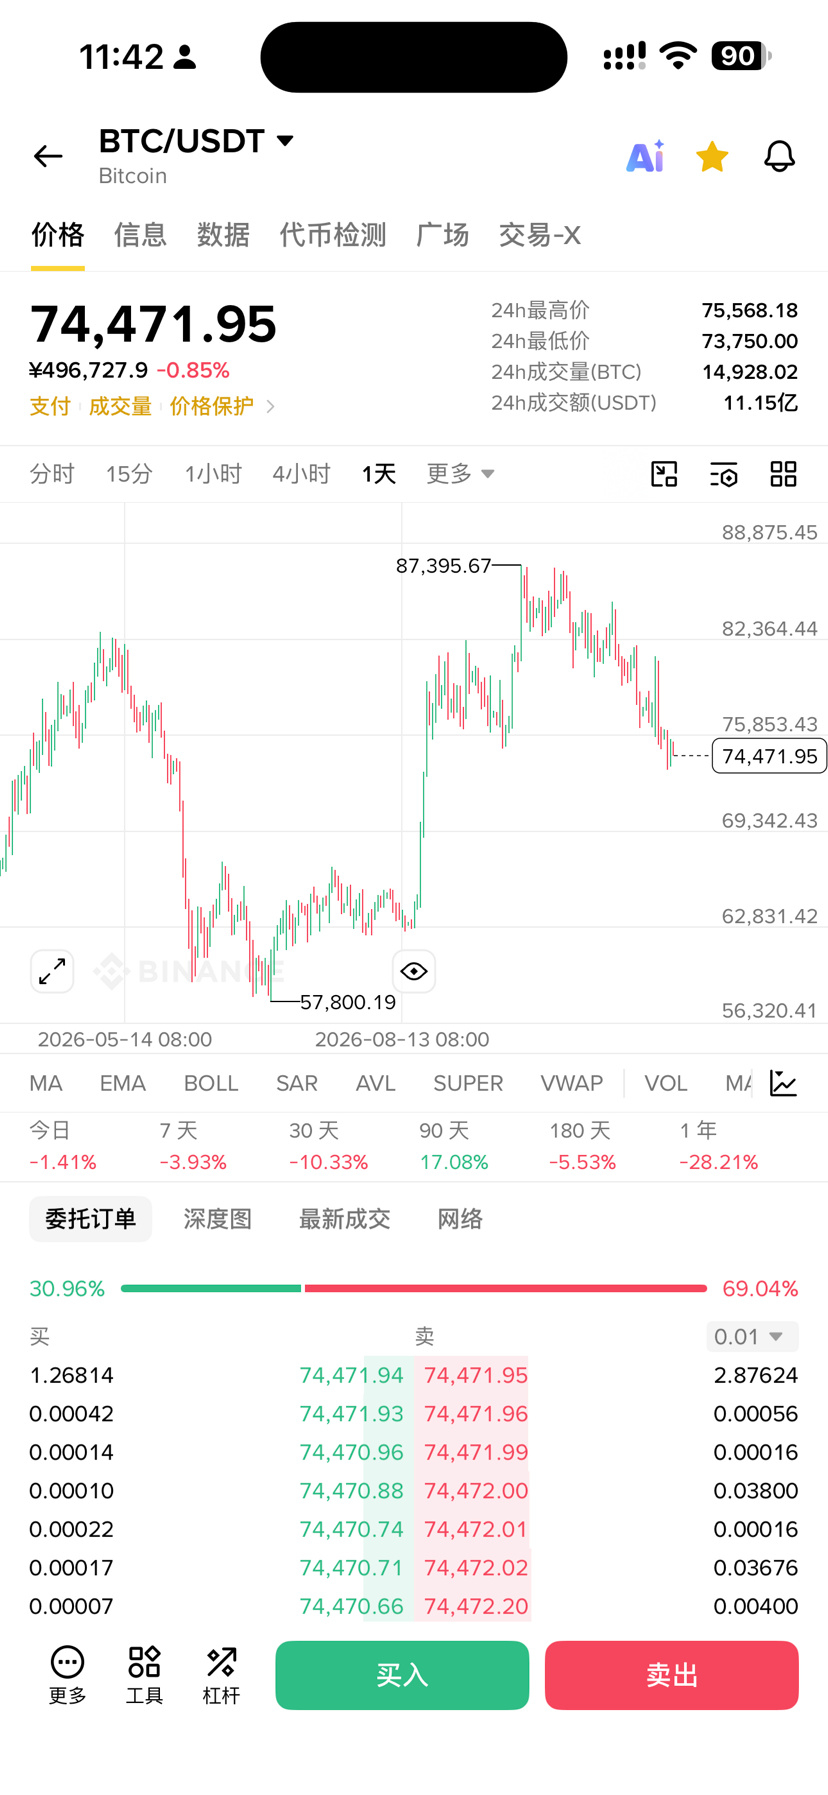
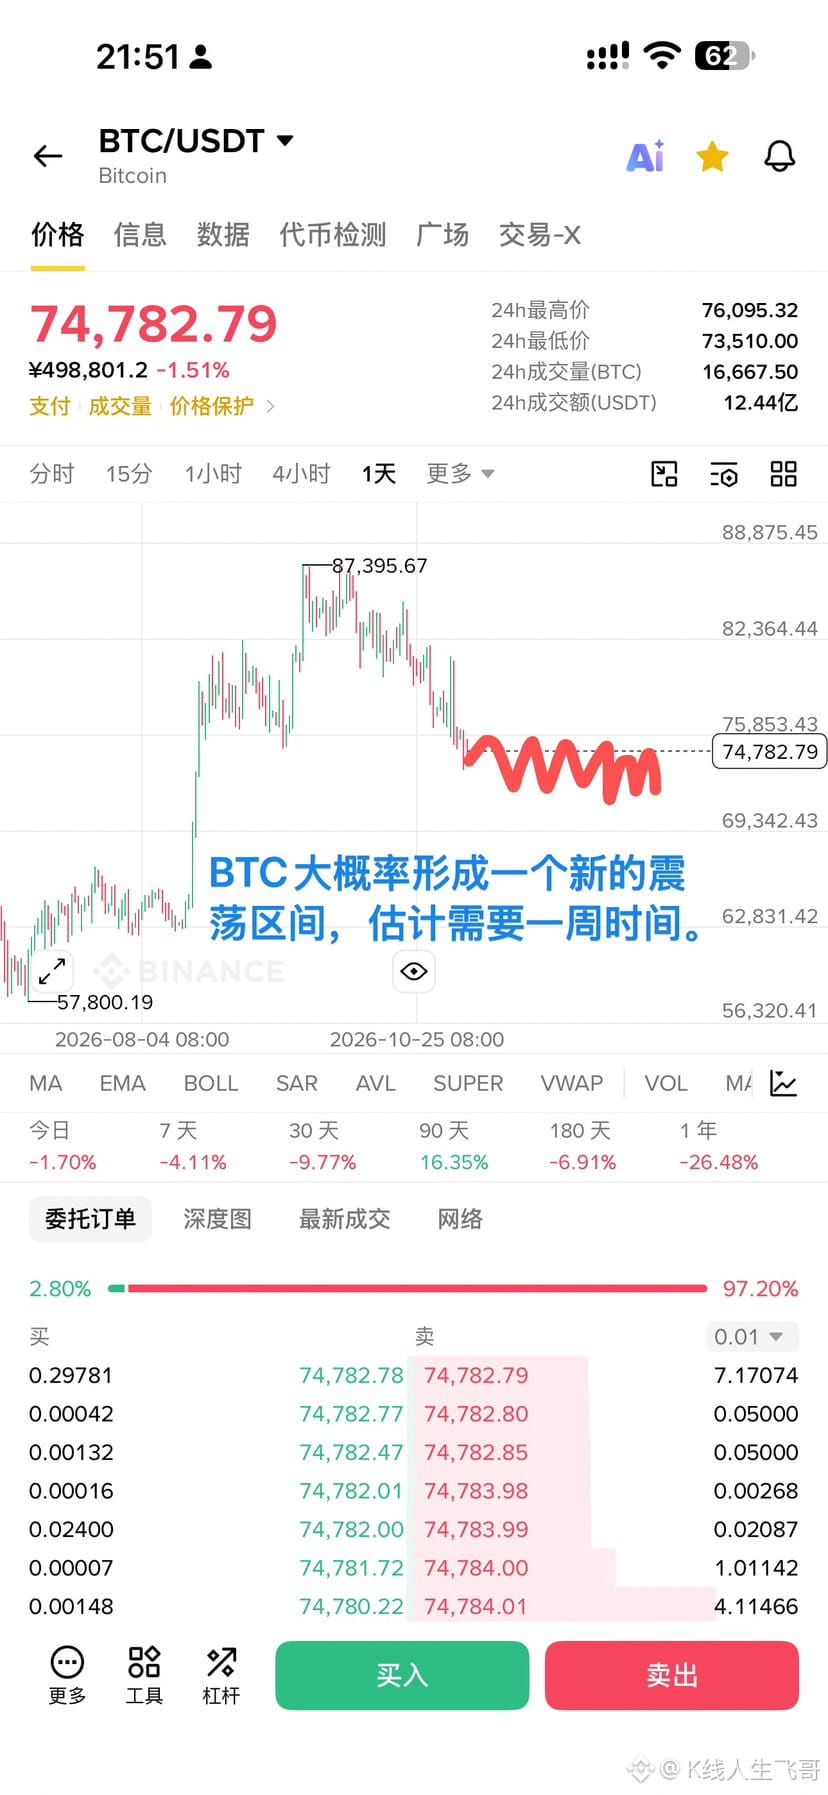
I don’t think there’s any need to be outright bearish anymore, but we also can’t assume the bottom is in. BTC has fallen below $74,000 and ETH below $2,100, and the market could still dip further, toward the $70,000 range. However, in terms of risk and reward, there may not be much room left to keep betting on further declines.
The market will most likely need a period of choppy consolidation. A truly large-scale wave of buying may have to wait for an improved macro environment or a major positive catalyst.
Taking a longer-term view, I remain optimistic about the crypto market’s performance from now through next summer. The total crypto market cap is currently about $2.47 trillion. Compared with the S&P 500’s market cap of about $68 trillion, crypto still makes up only a small part of global capital markets.
My strategy is to gradually increase my spot holdings rather than blindly chase short-term rebounds. I currently plan to allocate about 70% of my portfolio to BTC, ETH, CRCL, and COIN.
$PEPE The rebound has been quite impressive. The hack incident happened on October 30, and everyone got the chance to buy the dip in PEPE around 0.0000044. Even though altcoins have plunged over the past few days, PEPE has held up relatively well. Next, we’re approaching our target of around 0.0000055. As I’ve said, you need to choose altcoins carefully: either pick one with strong fundamentals or one with an upcoming narrative. PEPE is a typical example of the latter.
Now, let’s talk about $PEPE and what might happen next. This coin was created in 2023. At the time, it was the leading MEME coin on the hugely popular Ethereum chain. During the last bull market, its market cap soared to tens of billions of dollars. It then kept correcting throughout the bear market, falling by as much as around 90% from its all-time high to this cycle’s low. That was a fairly normal bear-market correction, and most of those who were going to be shaken out have probably already sold.
In this rebound, PEPE has gained only about 100%, which isn’t particularly impressive overall. As we’ve discussed before, ETH has already risen by about 80%. If an altcoin with a smaller market cap has only gained this much, it’s hard to say it has shown enough upside potential. From a purely technical perspective, PEPE has only just started to move on the monthly chart and is still in the bottom range.
On the news front, PEPE has another potential catalyst worth watching: Canary Capital reportedly filed an application for a spot PEPE ETF in early October, and the market is watching for updates on the approval process.
If ETF expectations continue to build, they could give PEPE additional room to rally. So, in the short term, PEPE’s move may not be over yet.
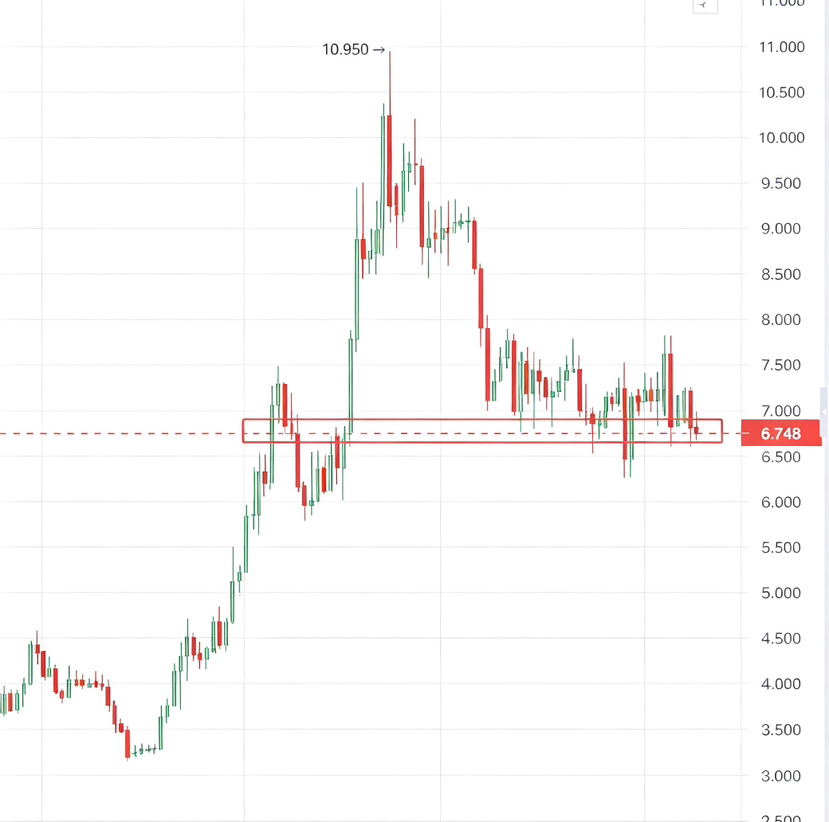
$UNI recently has been even stronger than a high school student; during the $BTC pullback period, even $HYPE fell below a key level, yet UNI has performed quite resiliently. If BTC can subsequently stabilize and start a new major uptrend, I believe UNI’s upside elasticity could be very strong, and it may even have the chance to surpass HYPE.
From the weekly structure, since its all-time high in 2021, UNI has formed a multi-year pennant consolidation pattern. My expectation is that in the short term it may first retest around 6 dollars, then gradually move toward 15, 30, 45, and even 50 dollars.
In a more optimistic scenario, UNI has the chance to challenge the previous 45-dollar high again and break through it further; an extreme target could be 67 dollars. But for expectations above 100 dollars, I think there is still not enough basis at this stage.
Justin Sun’s latest views Bearish on storage, Nvidia, and the Nasdaq Bullish on AI applications and AI healthcare
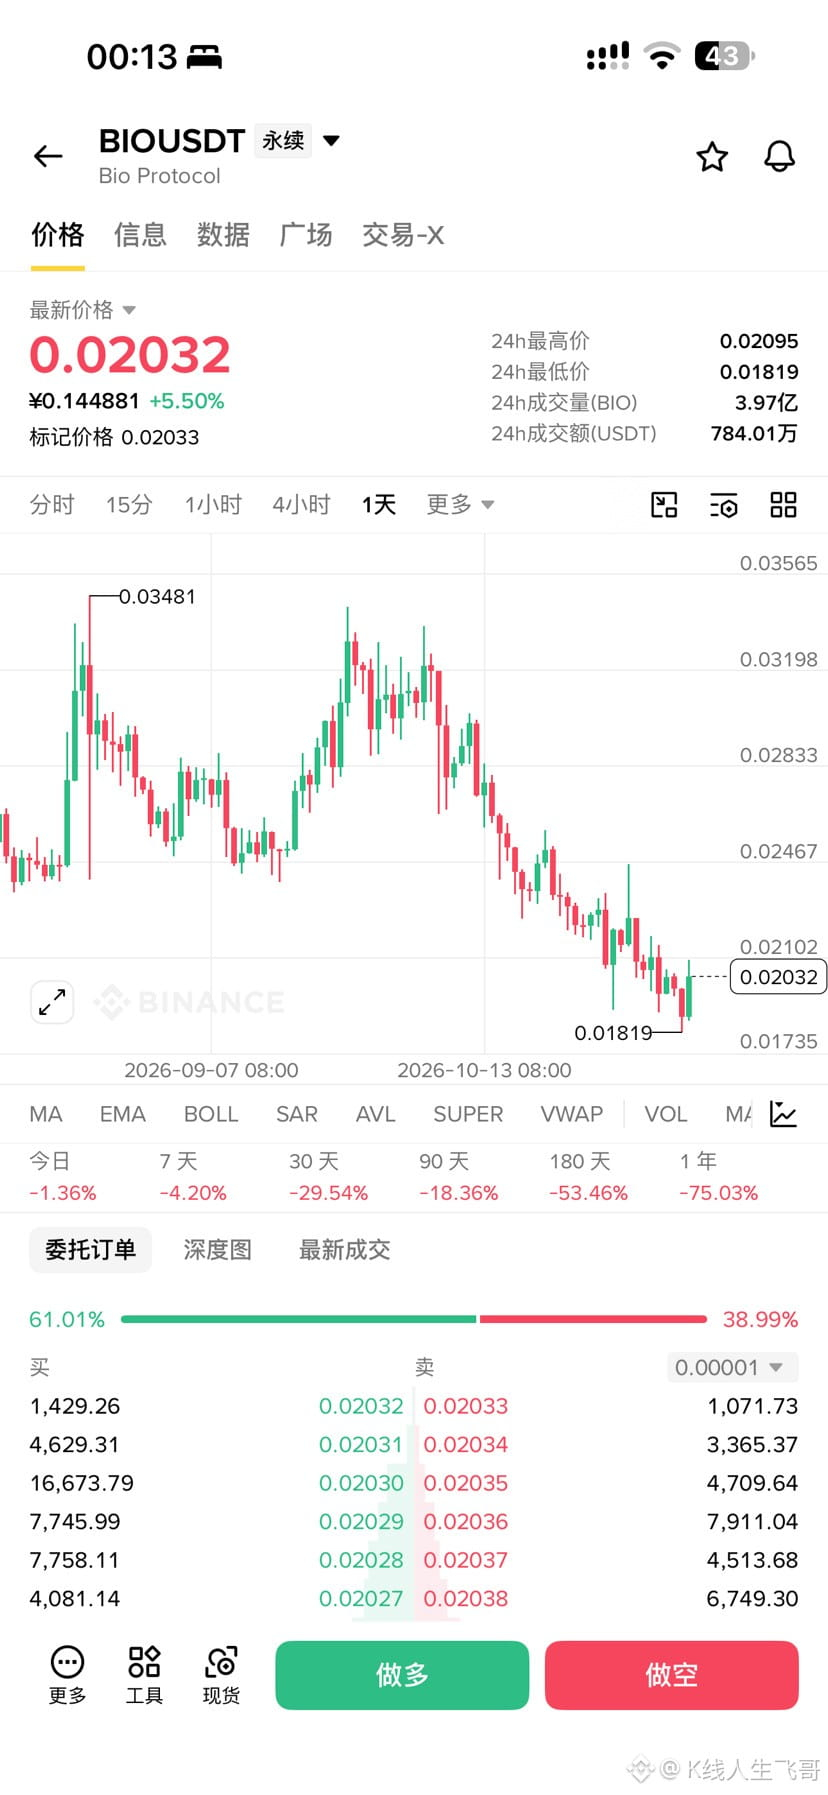
From this perspective, you could keep an eye on $BIO . In my personal opinion, it could be one of the altcoins worth positioning in ahead of the next bull market. Right now, global financial markets are largely focused on AI, while the DeSci life sciences sector is still in its very early stages. Whether in pharmaceuticals or life sciences, both require a great deal of time and effort upfront. By the next bull market in 2028, the DeSci life sciences sector may be just beginning to take off.
On the daily chart, BIO shows a classic pattern of three steps forward and two steps back. Although its price action has been volatile, the overall trend is still range-bound near the bottom, and the candlestick pattern is quite textbook. The price has only just started to turn upward. People joke that this coin is the elixir of immortality researched by CZ, but as a leading project in the DeSci sector, I think BIO will still attract market attention in the next bull market. BIO’s market cap is currently modest, and I estimate its upside in a bull market starts at 5x.
Following up on my previous post, $BTC , if we go by my rigid, historical-pattern-based analysis, yesterday’s 73,500 probably wasn’t the bottom of this pullback. I reckon it could retrace to around 70,000. But from a dip-buying perspective, I don’t think there’s a huge difference between around 70,000 and 74,000. Looking back at BTC’s bull market this cycle, it’s not exactly the same as 2023, but it’s pretty close: three steps forward, two steps back. Most altcoins have fallen back to where they started. Just looking at the candlestick chart, it seems like nothing has changed—the market is simply repeating itself. The retail investors in the market may not be the same people as in 2023, though, so everyone’s mindset has changed too.
K线人生飞哥
·
--
Yesterday during the livestream, I shared my thoughts with everyone about the upcoming market outlook for $BTC .
During Bitcoin’s bear-to-bull transition in 2023, the first trend wave rebounded from 15,000 to its first high, around 22,000. It then pulled back to around 20,500, where support was confirmed, before continuing its rebound to a second high of 22,500. The first trend wave then came to an end, and a daily-chart correction began, breaking below the 20,500 support level that had been tested during the pullback from the first high. The price fell to around 19,000, found support, and rebounded, before the second trend wave began.
Now, let’s compare that with the market in 2026. Bitcoin bottomed around 58,000, then spent a long time accumulating in the 60,000 range before the first trend wave began. It rebounded to its first high, around 82,000, then pulled back to support around 76,000. After that support held, it rebounded to around 87,000, the peak of our first trend wave. A daily-chart correction then began, and the price is currently testing the support around 76,000 that was established during the pullback from the first high. If we follow the 2023 playbook, this support level will most likely break. I expect a further pullback to around 70,000, followed by range-bound trading. However, because of the recent hacking incident, this period of consolidation may last longer. The second trend wave will need time to rebuild confidence.
I looked at a Bitcoin candlestick chart from 2023, when it broke out of its bottoming range, and compared it with the current 2026 chart as Bitcoin emerges from its bottoming range. They’re not exactly identical, but they’re pretty close. Why would there be a false breakdown? Because 76,000 is the psychological line in the sand for most retail investors. A decisive break below this level toward 70,000 would trigger widespread panic. Everyone would think this is just another bear-market rally, not a transition from a bear market to a bull market. Then panicked investors would sell, completing this phase of the shakeout before the second wave begins. Will history repeat itself? Let’s wait and see.
How can you tell whether an altcoin is worth holding long term???
Just look at whether its price action is sustained. At the moment, most altcoins on the market are at the top of the gainers list one day and the top of the losers list the next. These coins are simply being pumped and dumped by unscrupulous market makers, who’ll take whatever profit they can get. Take ZKC, ZKP, TUT, and POL, for example: the project teams have basically given up, while the market makers still have coins on hand and use a market rally to pump them and sell to unsuspecting buyers. So, let’s look at this latest pullback: if an altcoin hasn’t fallen below—or back to—its previous low, that basically means the market makers are still in and haven’t abandoned it.
Altcoins with sustained price action are a sign that the project teams haven’t given up and are still following the broader market. Examples include AAVE, UNI, ZEC, NEAR, MORPHO, LINK, AERO, RAY, ENA, and LIT. These are all blockchain infrastructure or trending projects. Compared with other altcoins, they may be suitable for a medium- to long-term position—in other words, holding through a full market cycle.
Choosing the right altcoins is important right now. If both the project team and the market makers have already abandoned a coin, holding it long term means you’ll have wasted another market cycle.
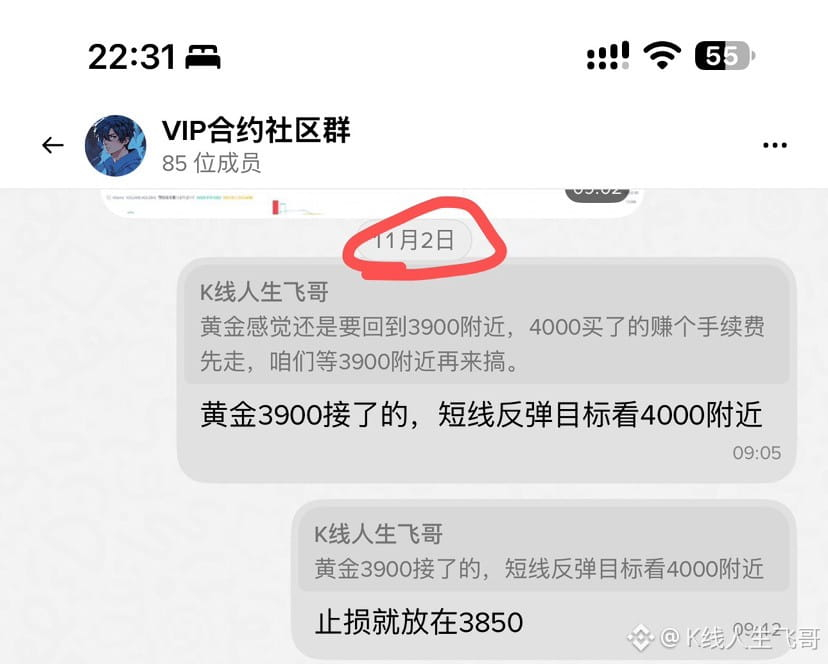
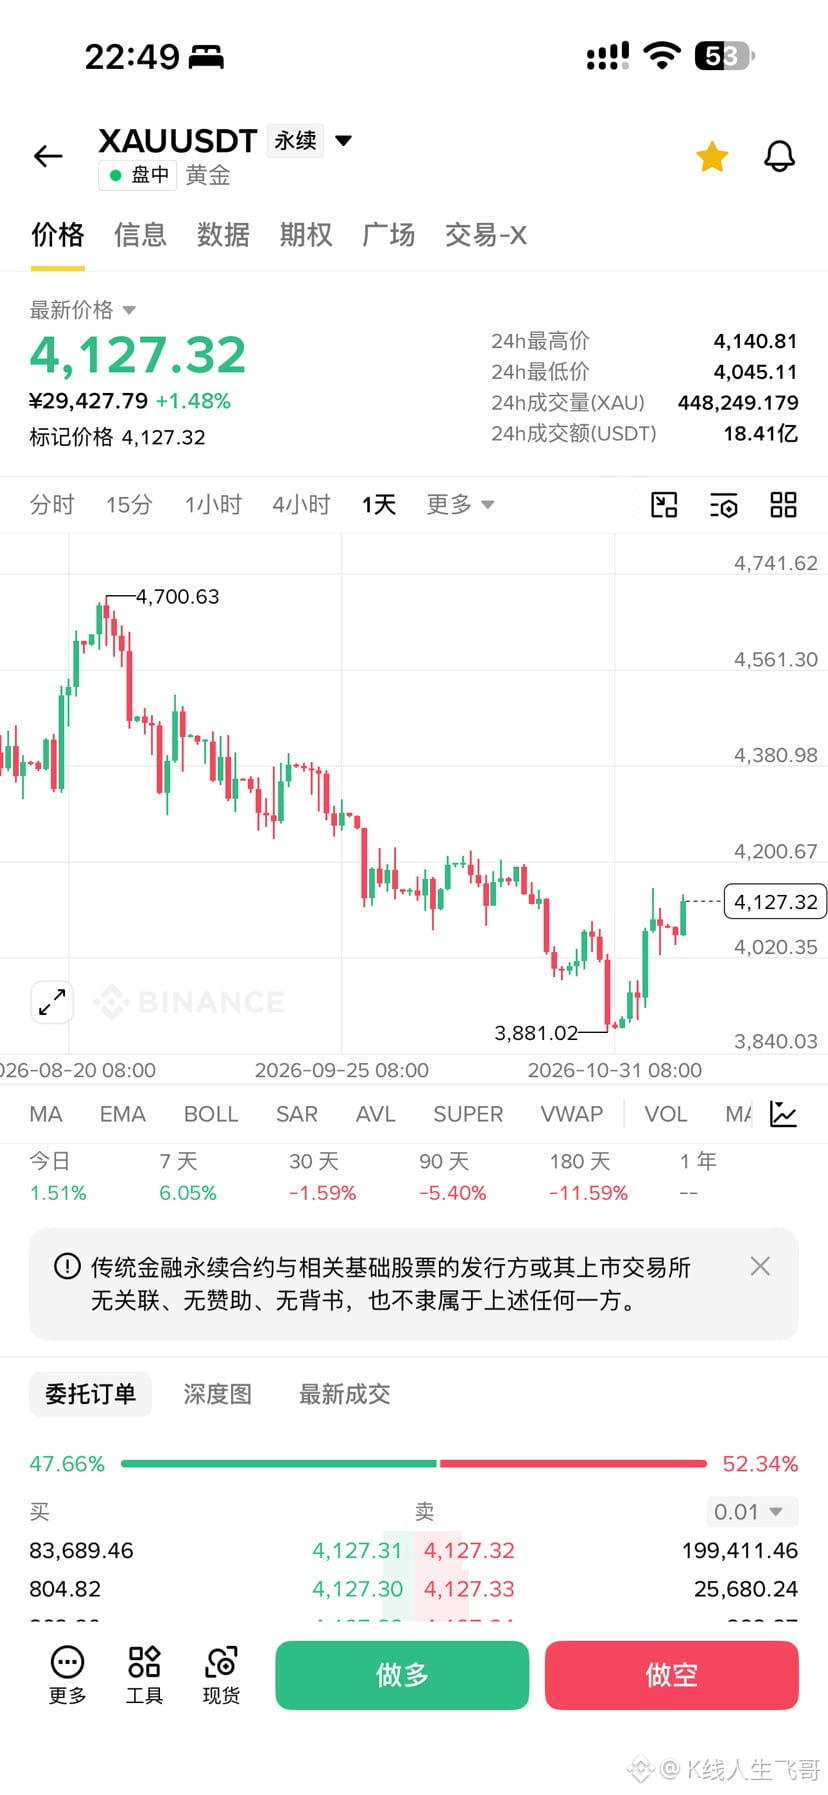
Since our community discussed buying the dip at 3900 on November 2, with an initial target of 4000, gold has since reached that first target. We’ve continued to track it, and the latest target is now 👀4200.
Next, I’ll share a public post on the Square to analyze my forecast for gold’s upcoming movements.
For now, I’m more inclined to view this rebound as a return to the 3950–4200 dollar trading range, rather than a sign that the broader trend has turned bullish.
Last week, gold reclaimed 3950 dollars on strong volume, with clear volume support on both the weekly and daily charts. This suggests that buyers did step in at lower levels. However, the subsequent increase in volume alongside stalled price action near 4150 dollars shows that selling pressure overhead remains significant.
The two key levels to watch next are:
4150 dollars: The first short-term resistance level. If gold continues to meet resistance here, a pullback remains possible. 4200 dollars: The upper boundary of the range and a key level for determining whether the market can truly turn stronger.
My approach remains to treat this as range-bound trading for now, while maintaining a bearish view on the broader time frame. If clear selling pressure emerges around 4150–4200 dollars, we’ll need to watch whether 3950 dollars can hold. If gold breaks decisively above 4200 dollars on strong volume, we’ll need to reassess the original bearish outlook.
Returning to the range doesn’t mean breaking out of it. The key thing to watch next is price and volume action at these important levels.
K线人生飞哥
·
--
There hasn’t been much trading activity in the community lately. Aside from a few altcoins we’re bullish on, like PEPE and RAY, and BTC, we’ve mainly been trading gold in the community. $XAU
Let me explain the basic logic behind gold and the price levels I’ve discussed in the community, and why I’m still bearish even though I expect a short-term rebound.
First, let’s look at the long-term fundamentals. Ultimately, gold’s long-term trend depends on the direction of global monetary and credit expansion.
According to the Kondratiev wave theory, the global economy may now be gradually moving from recession into depression. The momentum behind credit expansion among businesses and households is weakening, while the global broad money-to-GDP ratio is also under pressure to peak and decline.
Over the past decade or so, credit cycles in China and the U.S. have diverged significantly: China has continued to expand countercyclically, providing important support for gold demand. But since 2025, China’s credit growth has slowed, and consumption and investment have been weak. The U.S., meanwhile, has relied mainly on AI infrastructure to support growth. If the global trend of credit expansion reverses, gold could lose an important driver of price gains.
At the same time, global capital is still flowing into the U.S., with dollar liquidity fueling major investments in AI infrastructure. This trend may continue until AI is truly commercialized and its productivity gains are realized.
My view is that gains in major global asset classes don’t rotate endlessly. Real estate, Bitcoin, and gold have all gone through their own periods of valuation expansion, and there may not be another broad-based rally in the future. By contrast, AI technology could become the main destination for capital in the next phase.
If global credit expansion continues to slow while dollar capital remains concentrated in the U.S., the long-term case for gold will need to be reassessed. AI technology, on the other hand, could become the core beneficiary of the next cycle.
Goldman Sachs cut its gold price forecast for the end of 2026 from $4,650 to $4,150 per ounce, and lowered its year-end 2027 target from $5,400 to $4,800.
So my view is clear: a short-term rebound in gold is not a reversal. If you followed our community and bought the dip at 3,900, you should still sell after this rebound runs its course. When the next major buying opportunity comes, I’ll let you know in the community. 🔔
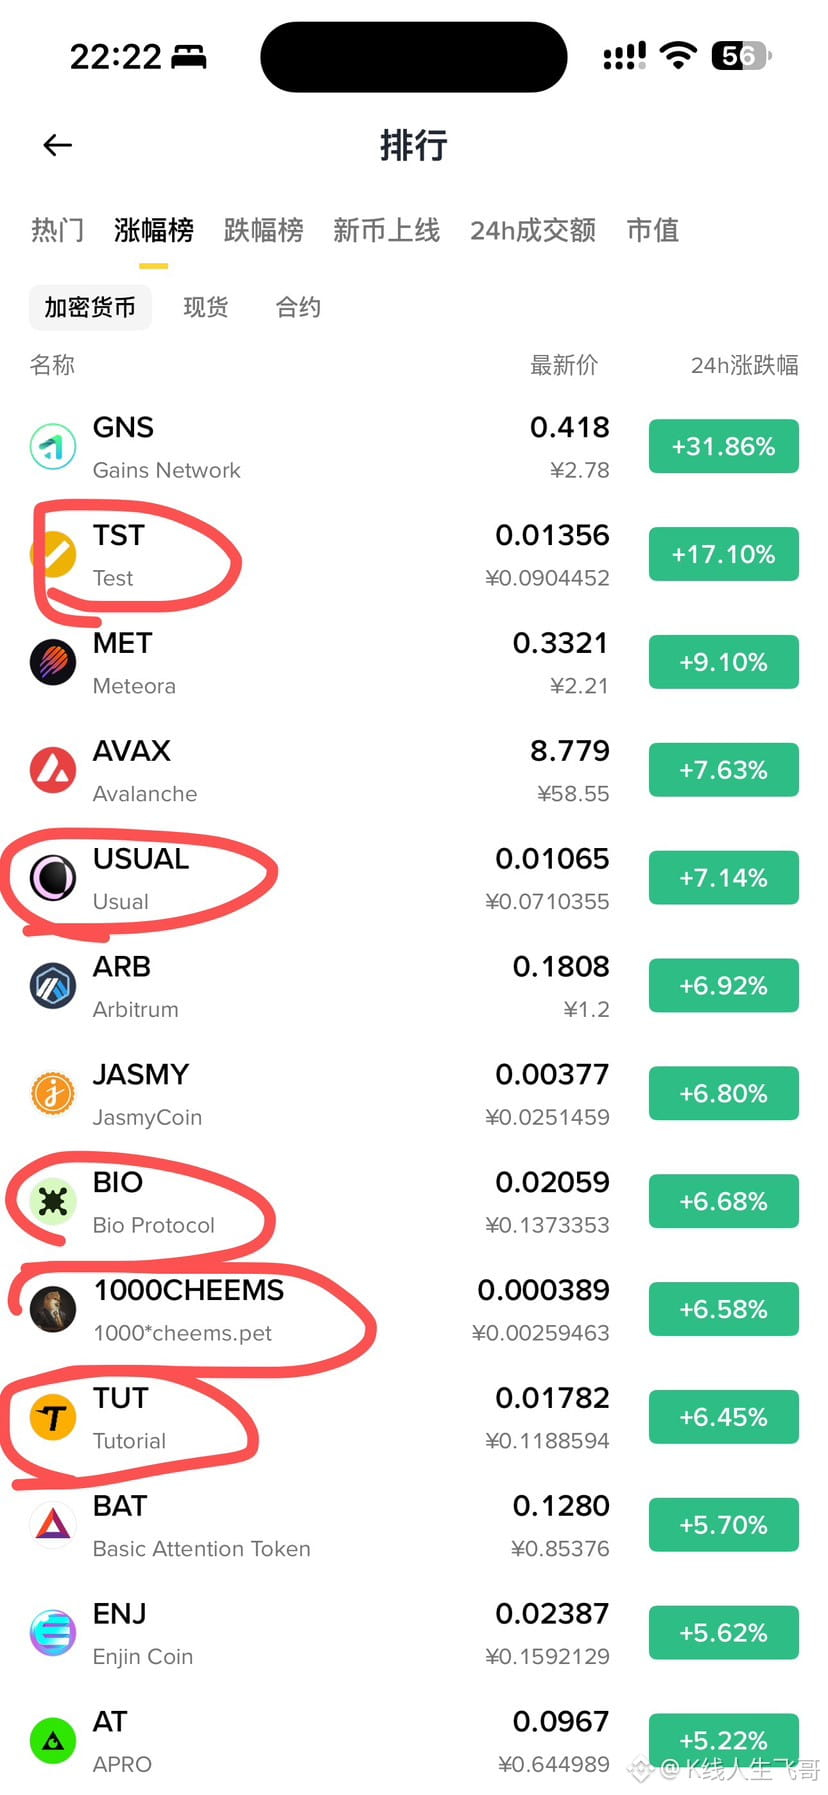
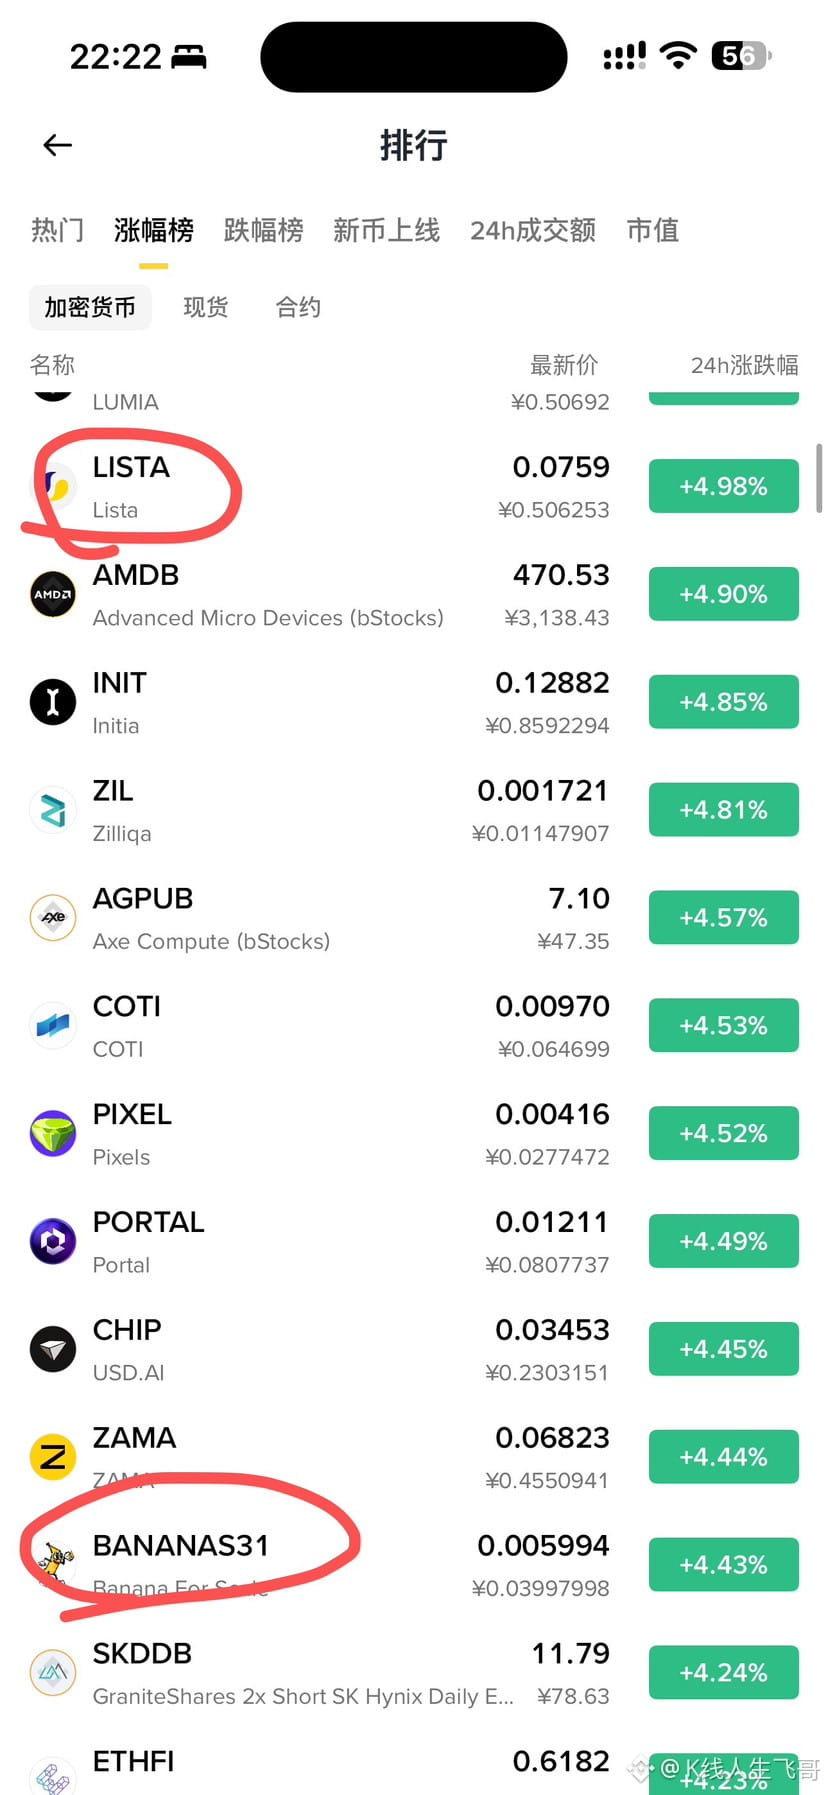
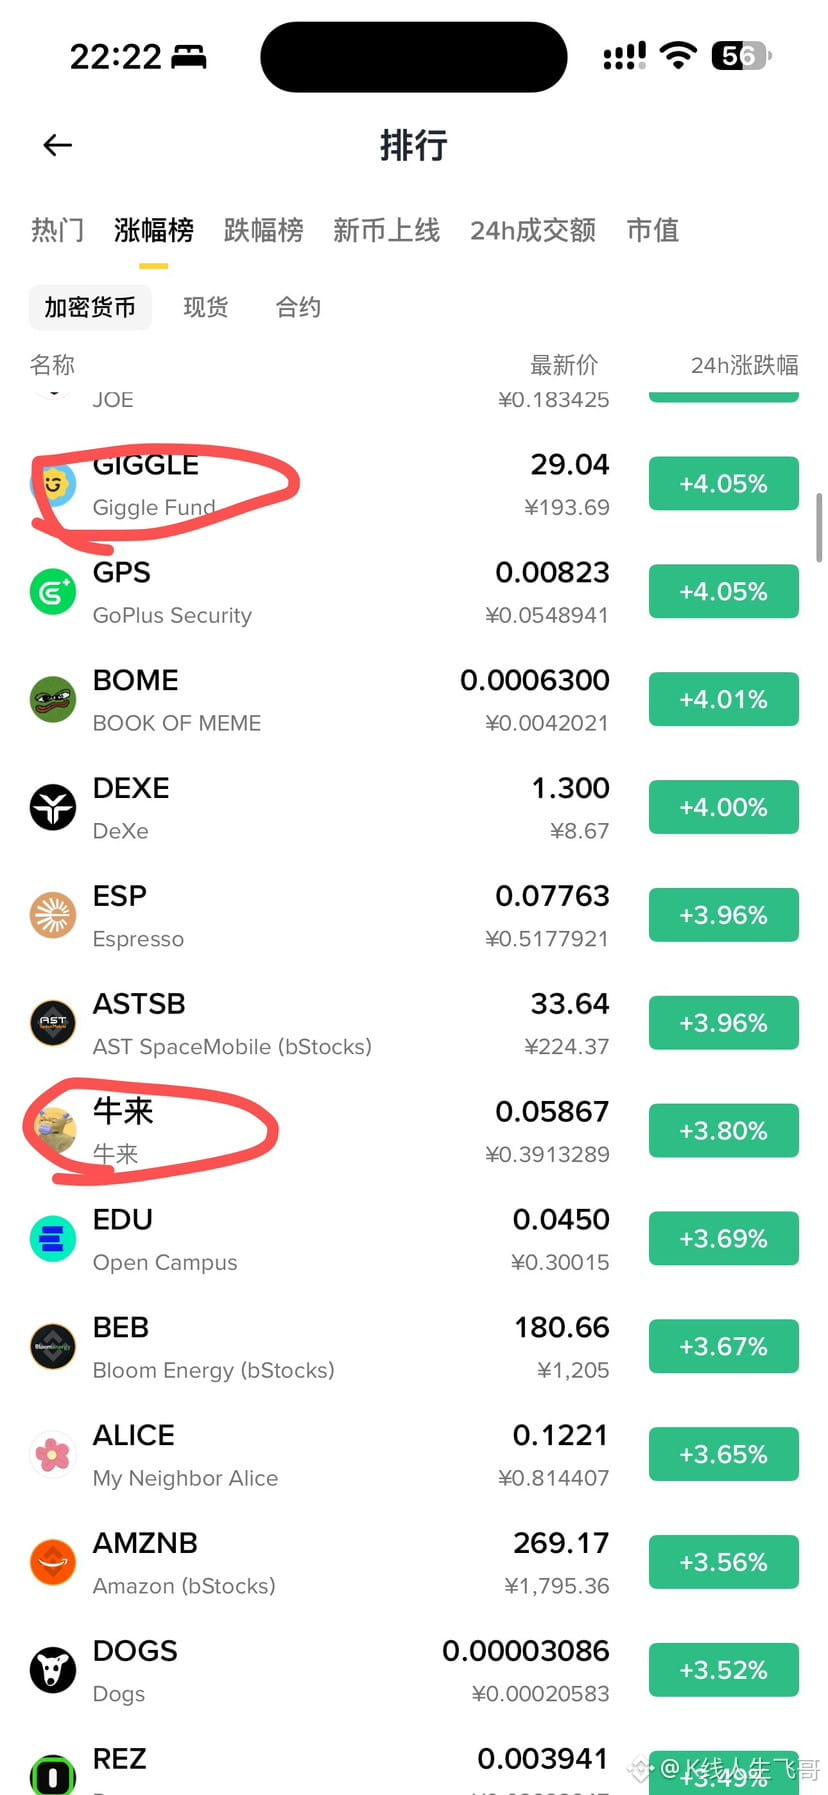
I took a look at the top gainers, and the ones rebounding the hardest are all BSC-related altcoins. As I’ve told you before, in my experience, whenever Binance faces a major negative event, it pumps $BNB and BSC-related altcoins to restore its reputation and retain users. The recent pump of $牛来 is a case in point. Other BSC-related altcoins will follow suit too. I don’t need to spell out which altcoins to buy for a short-term rebound next, do I? I’ve already given you the secret to making money.
Of course, if you’re looking for stability, choose BNB. If you think the returns are too low, just use low leverage.
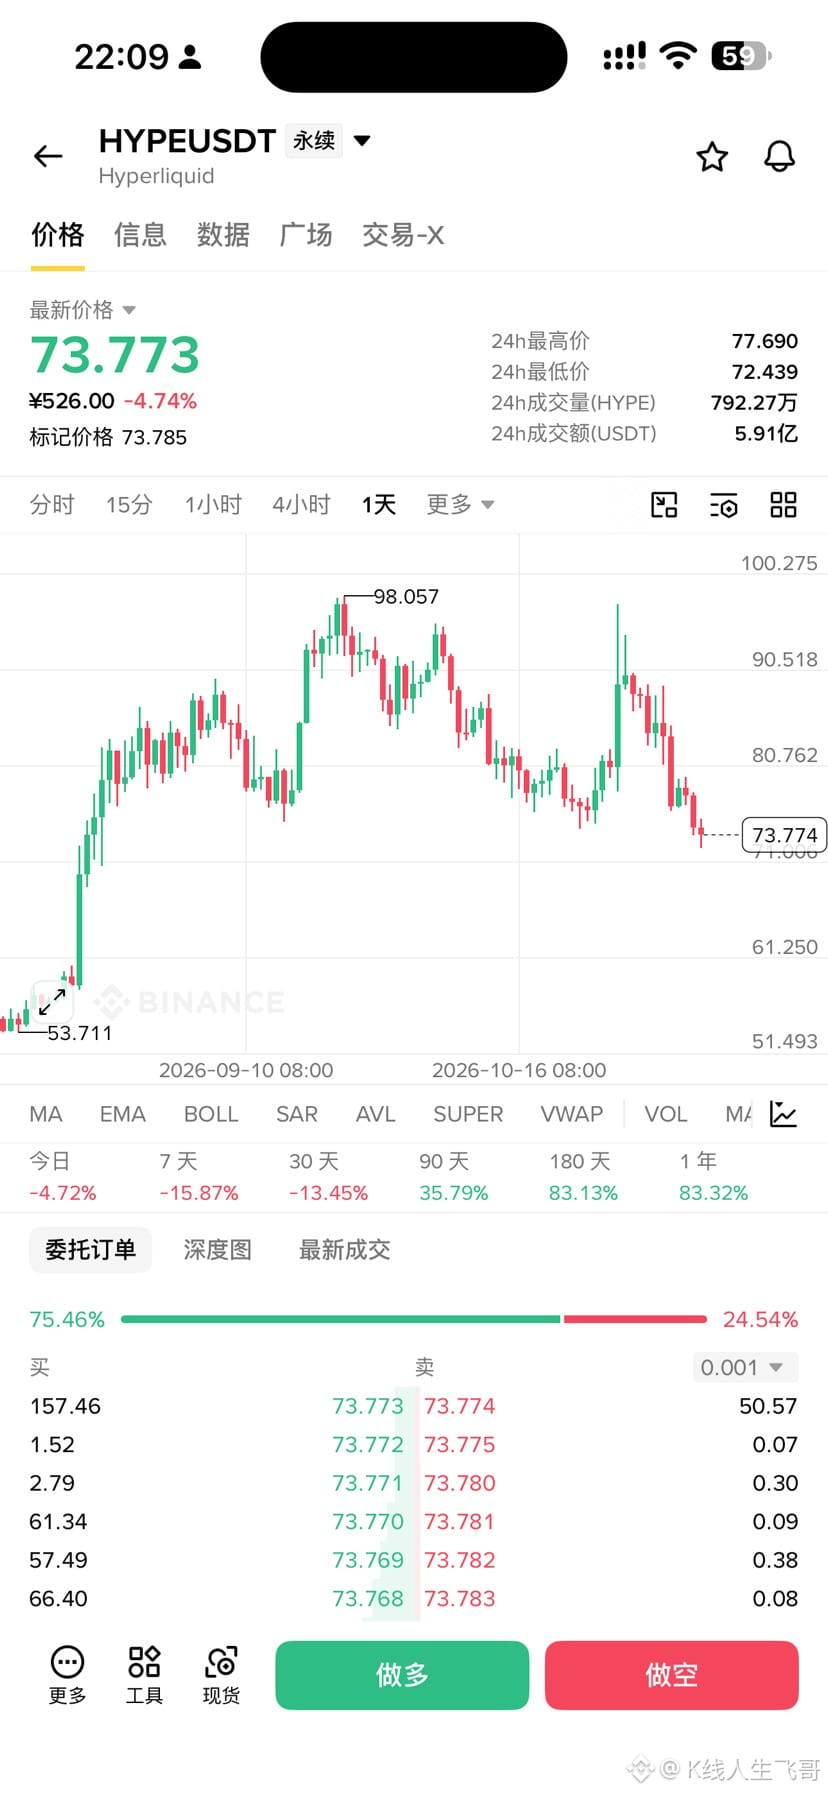
The on-chain contracts sector has already proven to be the trend of the future. The reason is simple: $BTC volatility is getting lower and lower, so the only option is to make up for it with leverage. Because of regulation and mandatory KYC, many funds on traditional CEXs have no choice but to trade on DEXs. This is also one of the reasons for $HYPE 's rise.
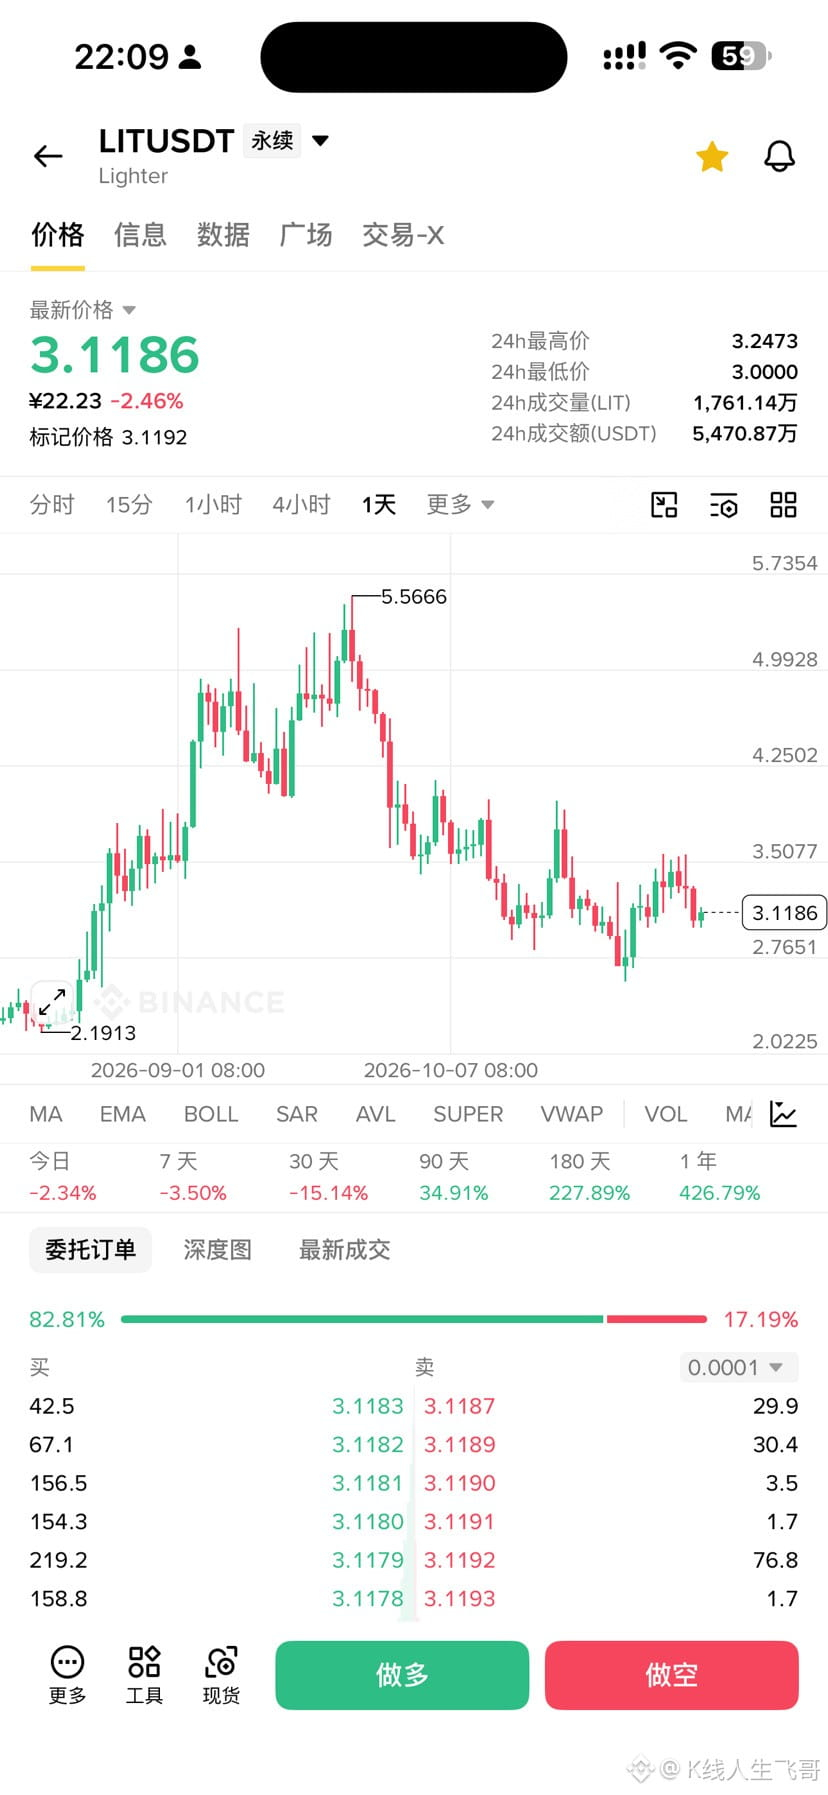
There are many projects in the perpDEX sector right now, but the only ones that really stand out are HYPE $LIT ASTER. If you're looking to buy the dip, ASTER has been stuck in a prolonged shakeout, so those without the patience to hold should avoid it. HYPE has already risen too much from its lows, and its current circulating market cap is 17.6 billion, so it is no longer cheap from a valuation perspective. LIT's current circulating market cap is around 700 million. So, comparing on-chain data and market-maker tactics, LIT offers the best value for buying this dip.
$BTC What’s the outlook for the market from here???
Back on November 4, when BTC rebounded to around $81,000, I warned that this might only be a short-term rebound, and that the price could still retest its previous low. I made it clear that a rebound is not a reversal. The price action over the past two days has largely matched expectations, with yesterday’s low already falling to around $73,000.
Looking at the current structure, I think there may not be much downside left, perhaps another $1,000–$2,000. The key area to watch next is $70,000–$75,000, which could become a new consolidation zone for the next bottoming process.
However, reaching these levels doesn’t mean the price will reverse immediately. I expect it will take another 5–7 trading days to absorb selling pressure. After that, we can see whether the daily chart forms a clear bottoming structure.
There’s no need to rush into the market at this stage. It’s better to wait for a reversal signal on the right side of the chart. If you choose to position yourself early, you should only scale in at levels where the risk-reward ratio is attractive enough.
K线人生飞哥
·
--
$BTC What’s next for the market— a rebound or a reversal?
After Bitcoin briefly dipped below $76,000, strong buying demand stepped in and the price began to rebound. I think it’s quite likely to test the area around $80,000 next, but whether it can continue higher will depend on the selling pressure at that level.
There’s a notable contradiction right now: buyers are stepping in to support the price, but both futures and spot CVD continue to make new lows. Futures open interest has started to recover more quickly, but it remains low overall.
So personally, I think some bears may have already started building positions. If the price rebounds to $80,000 and meets clear selling pressure, while open interest rises sharply and CVD struggles to rebound, the bearish signal will become clearer, and any subsequent decline could be more sustained.
I’ve consistently encouraged everyone to buy the dip at $76,000, whether in spot or futures, and whether on livestreams, in the VIP community, or on the public forum. My view hasn’t changed. In any case, I believe anyone who followed my trades during this period will have caught this major rebound.
Next, keep a close eye on order-book activity around $80,000. Personally, I still lean toward this being a rebound rather than a reversal. After all, the hacking incident has had a major impact on the market, and it will take time to rebuild confidence. However, a much deeper decline also seems unlikely. I’m more inclined to expect a choppy, whipsawing market that shakes out weak hands before the second trend wave begins.
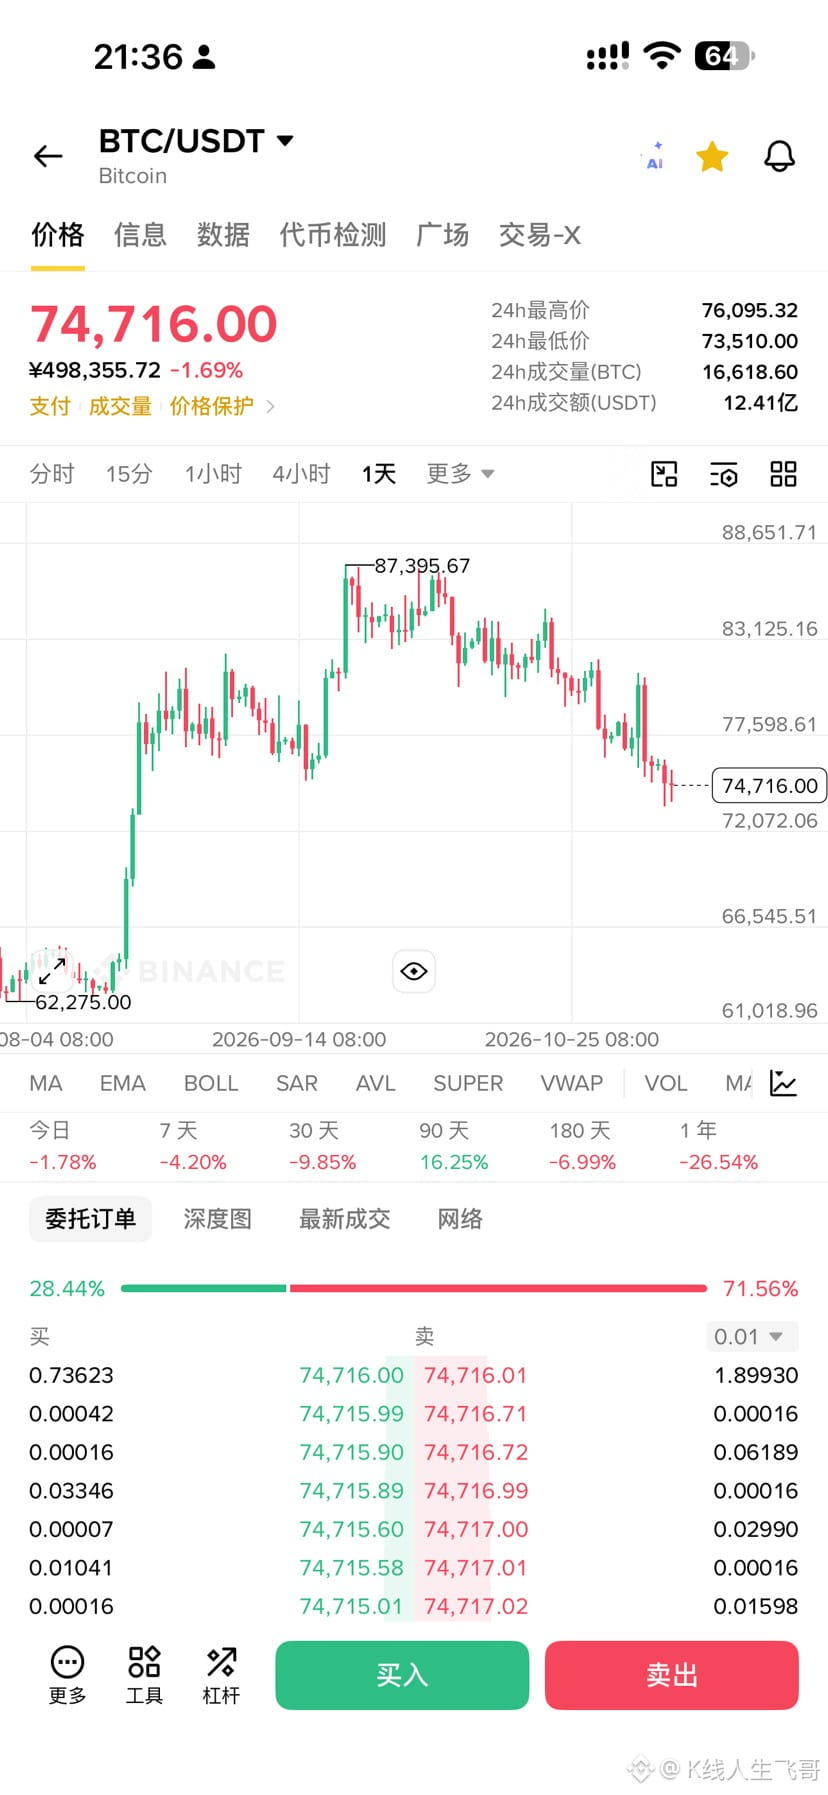
$BTC Bitcoin is increasingly behaving like a U.S. stock, and the get-rich-quick days are over.
In 2026, Bitcoin’s implied volatility index, DVOL, has fallen to a historic low, averaging around 42% for the year.
That means this thing is now less volatile than Nvidia.
A 10% daily move in Bitcoin is extremely rare—there are only a handful of days like that in a year. But among individual U.S. stocks, earnings reports can cause daily swings of over 10% several times in a single day.
So Bitcoin today is much like an individual stock in the Seven Sisters: it’s no longer a legend, and it’s not going to zero either. It’s just ordinary.
In this bull market, BTC could easily rise to $150,000–$200,000. Taking the high end of $200,000, the return from this bear market’s low of $57,000 would be only 3.5x over the three years until 2029. That return may not even beat U.S. tech stocks. So going forward, BTC can settle into the role of a high-yield investment product: the risk will keep shrinking, and the returns will correspondingly get smaller. If you’re determined to chase high returns, go buy MicroStrategy stock (MSTR), CRCL, or COIN.
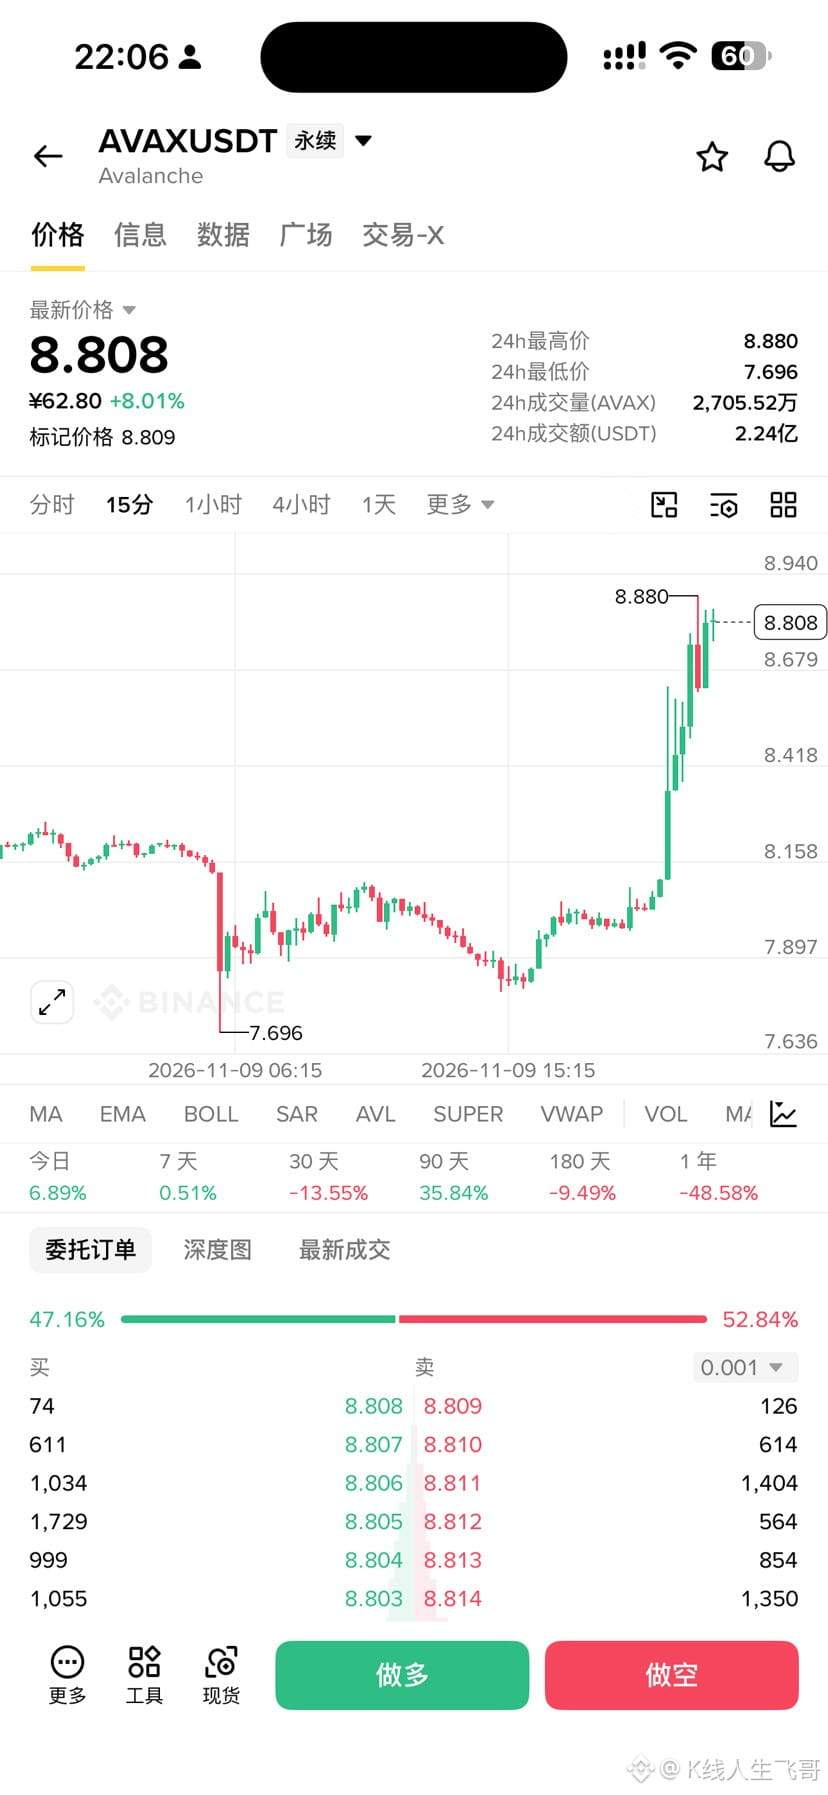
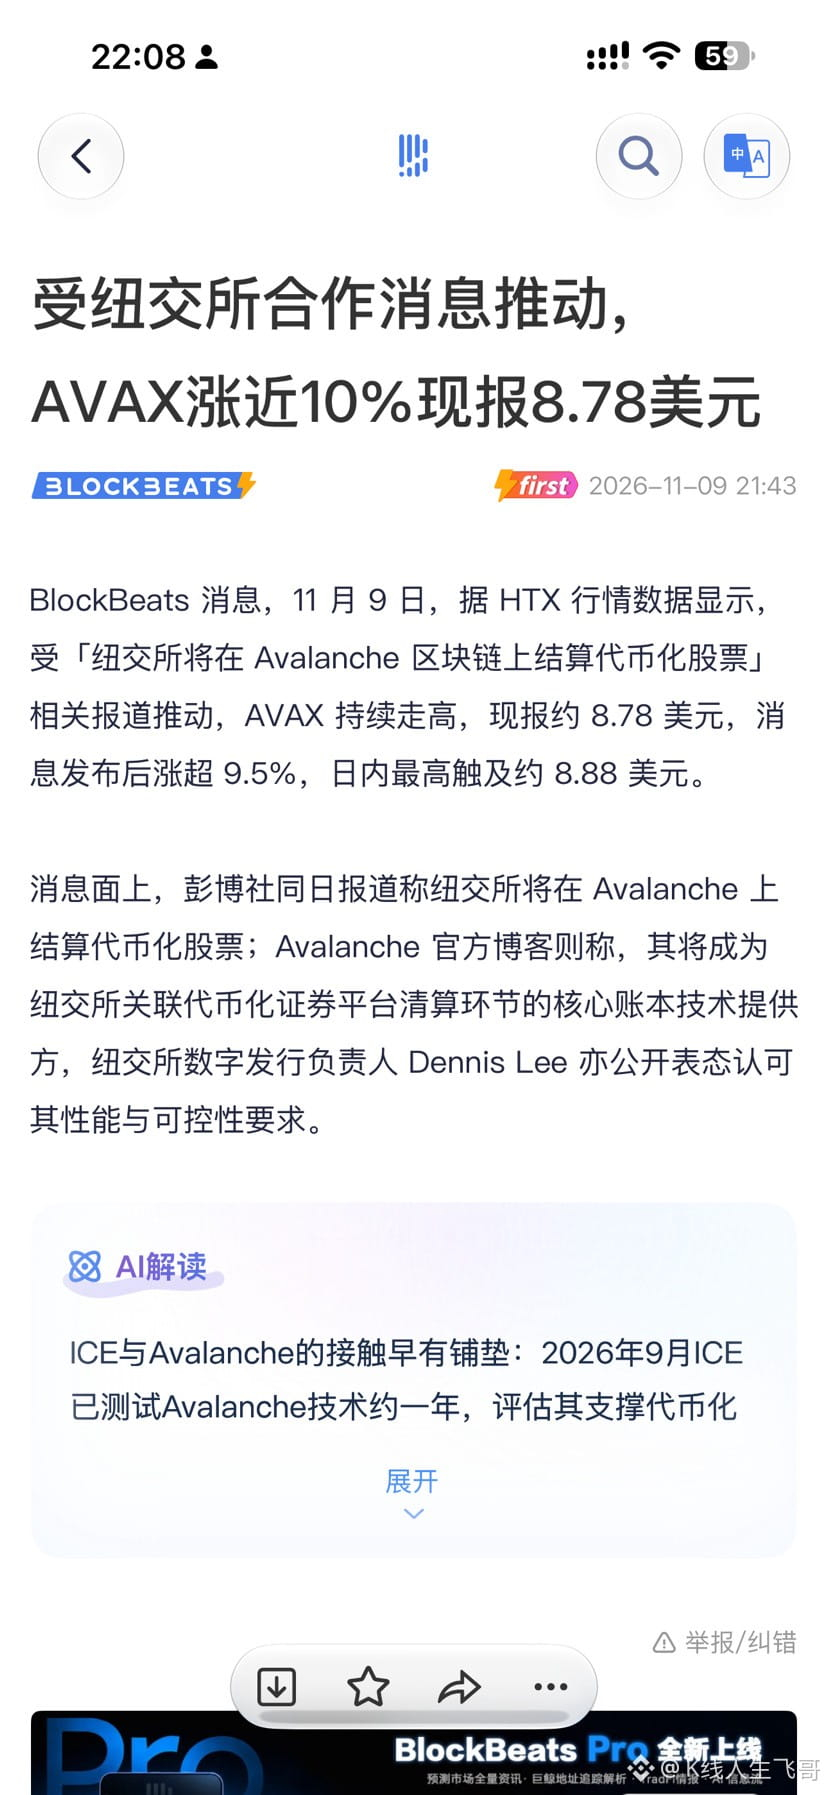
The established public chain $AVAX is pumping. Based on the usual ecosystem correlation, $JOE should follow suit. AVAX has a positive catalyst: the NYSE will settle tokenized stocks on the Avalanche blockchain. AVAX has already broken through its daily resistance level. JOE could be worth getting into early, following the usual pattern, but trading volume is too low, so it’s really only worth playing as a shitcoin.