
太阳黑子 Algo
743 Posts

太阳黑子 Algo
Report
Block User
纯粹的技术分析交易者 & 指标开发者。
自研技术指标:MIX ,本频道实时转发其触发的交易信号。
感谢关注,全网同名。
1 Following
48 Followers
29 Liked
Posts
PINNED
·
--
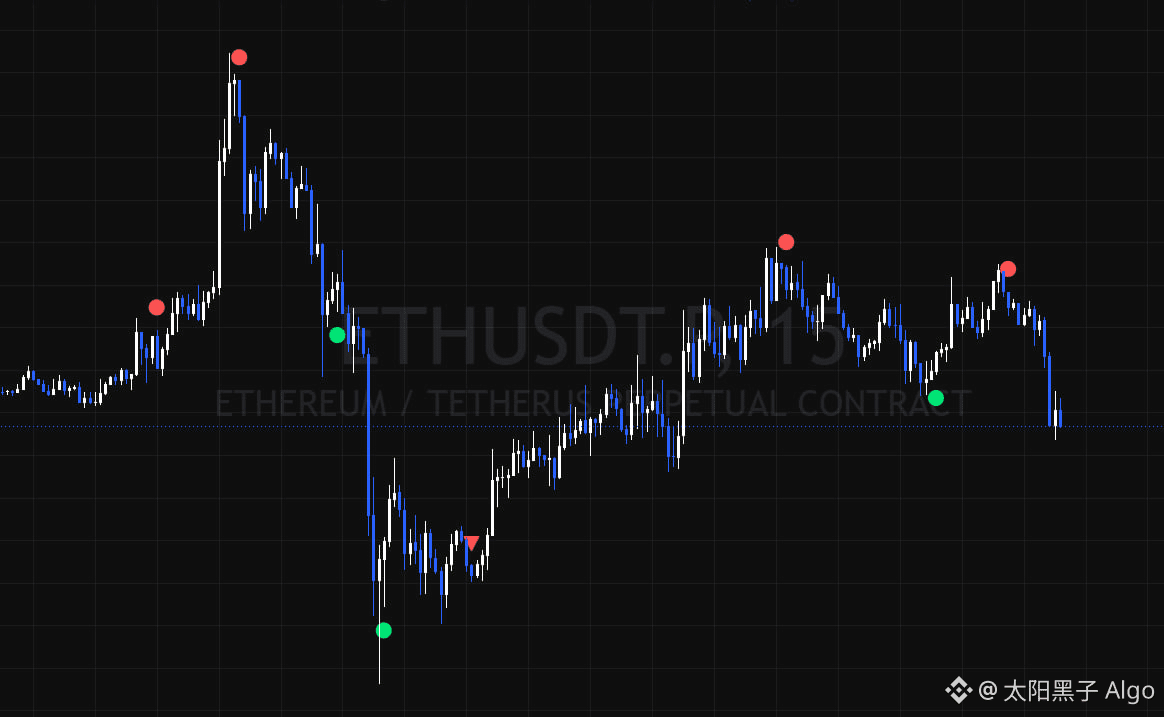
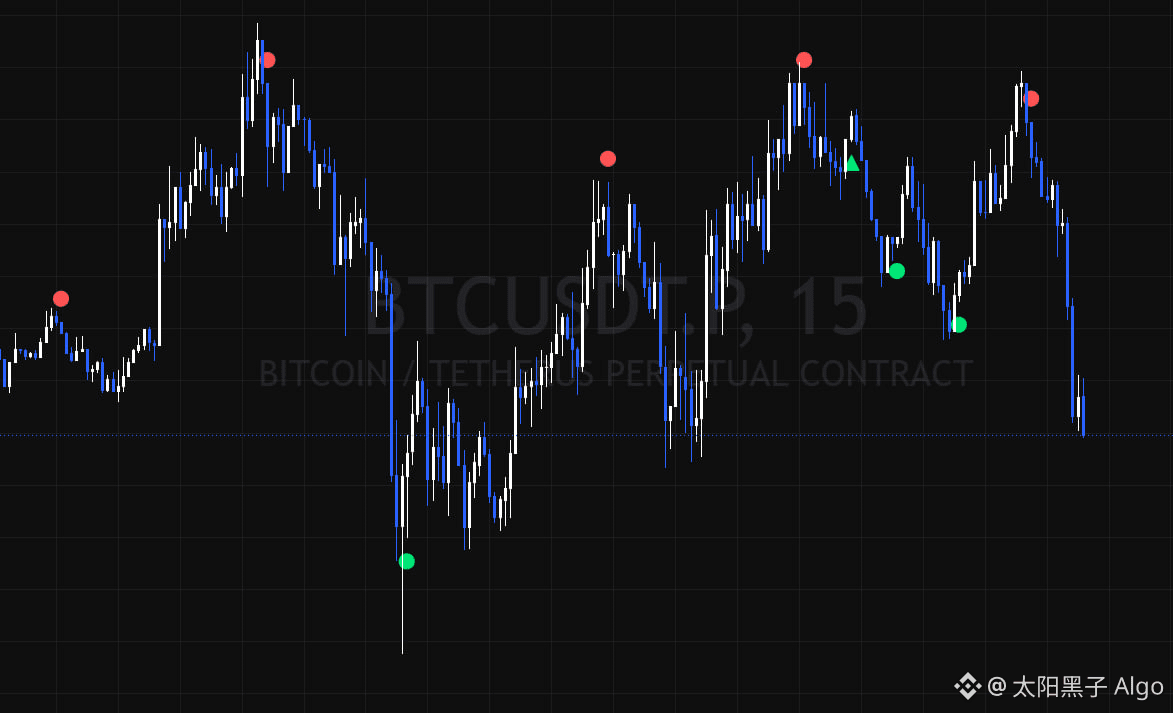
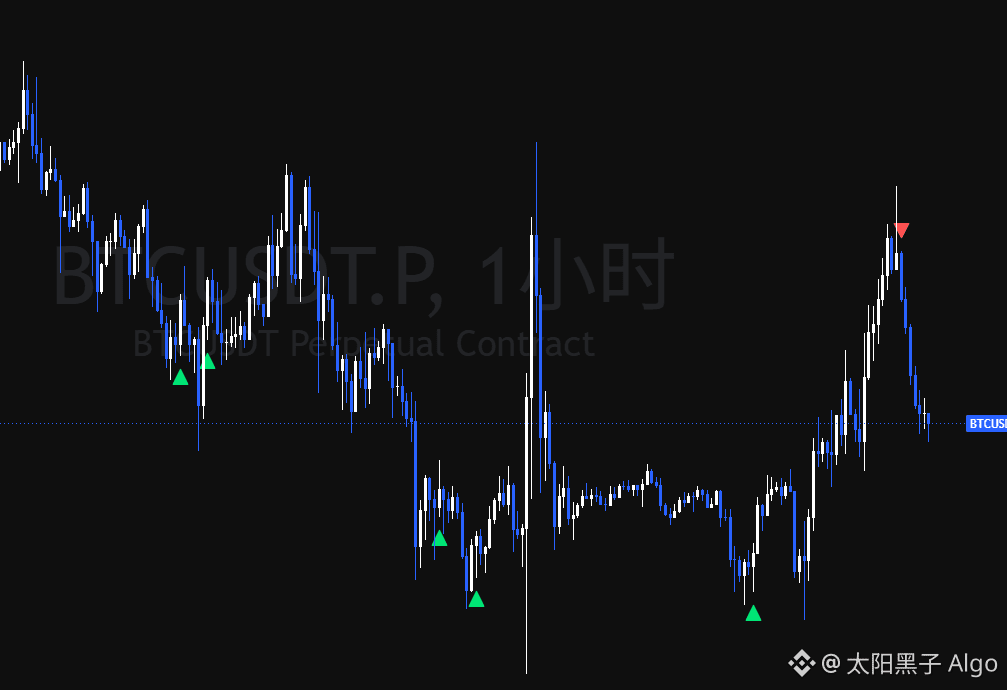
The chart above shows the BTC/ETH trading signals from the most recent 15-minute timeframe.
Let me share something: based on the chart above and the many charts in the channel, my signals will definitely appear near a certain extreme point (commonly known as bottom-picking or top-touching from the right side). So your stop-loss only needs to be placed at the nearest previous high/low relative to the signal candlestick—don’t fully follow the entry price recommendations from the group.
For example, suppose you want to open a long position on ETH, and the previous low is 2400. Then set your stop-loss at 2395–2398.
If you want to open a short position on ETH, and the previous high is 2400, then set your stop-loss at 2402–2405.
That’s basically it. Don’t widen your stop-loss out of fear—use the position sizing algorithm based on risk and loss (risk-based position sizing).
Risk-based position sizing algorithm: suppose you want to open an ETH short position.
1. First, confirm your per-trade risk (R), meaning how much you plan to lose on this trade—using 100U as an example.
2. Then confirm the entry price and stop-loss price—for instance, entry price is 2390, stop-loss price is 2400.
3. Calculate the stop-loss distance = the absolute value of (entry price − stop-loss price). That is 2390 − 2400 = -10, and the absolute value is 10.
4. Calculate the position size: position size = per-trade risk / stop-loss distance. So this trade is 100/10 = 10 (ETH).
5. Set the order type to a limit order, place an order at entry price 2390, enter the position size of 10 ETH, set the stop-loss at 2400, and the interface will show the expected loss for this order as 100U—then submit the order.
After that, do expectation management: assume that if you can’t get filled for N candlesticks, you cancel the order. I usually cancel after 9 candlesticks without fill. Using the 15-minute signal as an example, that’s 135 minutes. For any timeframe, you can apply the same cancel-order management logic.
Next is position management: assume this trade successfully enters. Based on the risk-reward plan, when you reach a certain floating profit target, you should move the stop to breakeven and reduce the position. I typically move to breakeven at +0.7R (70U) and cut the position in half at +1.5R (150U).
Finally: nobody can predict whether the next candlestick will go up or down. Whether you can profit in the long run depends on whether you can consistently and stably execute a trading system with positive expected value over the long term.
The chart above shows the BTC/ETH trading signals from the most recent 15-minute timeframe.
Let me share something: based on the chart above and the many charts in the channel, my signals will definitely appear near a certain extreme point (commonly known as bottom-picking or top-touching from the right side). So your stop-loss only needs to be placed at the nearest previous high/low relative to the signal candlestick—don’t fully follow the entry price recommendations from the group.
For example, suppose you want to open a long position on ETH, and the previous low is 2400. Then set your stop-loss at 2395–2398.
If you want to open a short position on ETH, and the previous high is 2400, then set your stop-loss at 2402–2405.
That’s basically it. Don’t widen your stop-loss out of fear—use the position sizing algorithm based on risk and loss (risk-based position sizing).
Risk-based position sizing algorithm: suppose you want to open an ETH short position.
1. First, confirm your per-trade risk (R), meaning how much you plan to lose on this trade—using 100U as an example.
2. Then confirm the entry price and stop-loss price—for instance, entry price is 2390, stop-loss price is 2400.
3. Calculate the stop-loss distance = the absolute value of (entry price − stop-loss price). That is 2390 − 2400 = -10, and the absolute value is 10.
4. Calculate the position size: position size = per-trade risk / stop-loss distance. So this trade is 100/10 = 10 (ETH).
5. Set the order type to a limit order, place an order at entry price 2390, enter the position size of 10 ETH, set the stop-loss at 2400, and the interface will show the expected loss for this order as 100U—then submit the order.
After that, do expectation management: assume that if you can’t get filled for N candlesticks, you cancel the order. I usually cancel after 9 candlesticks without fill. Using the 15-minute signal as an example, that’s 135 minutes. For any timeframe, you can apply the same cancel-order management logic.
Next is position management: assume this trade successfully enters. Based on the risk-reward plan, when you reach a certain floating profit target, you should move the stop to breakeven and reduce the position. I typically move to breakeven at +0.7R (70U) and cut the position in half at +1.5R (150U).
Finally: nobody can predict whether the next candlestick will go up or down. Whether you can profit in the long run depends on whether you can consistently and stably execute a trading system with positive expected value over the long term.
Let me share something: based on the chart above and the many charts in the channel, my signals will definitely appear near a certain extreme point (commonly known as bottom-picking or top-touching from the right side). So your stop-loss only needs to be placed at the nearest previous high/low relative to the signal candlestick—don’t fully follow the entry price recommendations from the group.
For example, suppose you want to open a long position on ETH, and the previous low is 2400. Then set your stop-loss at 2395–2398.
If you want to open a short position on ETH, and the previous high is 2400, then set your stop-loss at 2402–2405.
That’s basically it. Don’t widen your stop-loss out of fear—use the position sizing algorithm based on risk and loss (risk-based position sizing).
Risk-based position sizing algorithm: suppose you want to open an ETH short position.
1. First, confirm your per-trade risk (R), meaning how much you plan to lose on this trade—using 100U as an example.
2. Then confirm the entry price and stop-loss price—for instance, entry price is 2390, stop-loss price is 2400.
3. Calculate the stop-loss distance = the absolute value of (entry price − stop-loss price). That is 2390 − 2400 = -10, and the absolute value is 10.
4. Calculate the position size: position size = per-trade risk / stop-loss distance. So this trade is 100/10 = 10 (ETH).
5. Set the order type to a limit order, place an order at entry price 2390, enter the position size of 10 ETH, set the stop-loss at 2400, and the interface will show the expected loss for this order as 100U—then submit the order.
After that, do expectation management: assume that if you can’t get filled for N candlesticks, you cancel the order. I usually cancel after 9 candlesticks without fill. Using the 15-minute signal as an example, that’s 135 minutes. For any timeframe, you can apply the same cancel-order management logic.
Next is position management: assume this trade successfully enters. Based on the risk-reward plan, when you reach a certain floating profit target, you should move the stop to breakeven and reduce the position. I typically move to breakeven at +0.7R (70U) and cut the position in half at +1.5R (150U).
Finally: nobody can predict whether the next candlestick will go up or down. Whether you can profit in the long run depends on whether you can consistently and stably execute a trading system with positive expected value over the long term.
1
349
PINNED
·
--
👋
Hello, I’m Sunspot
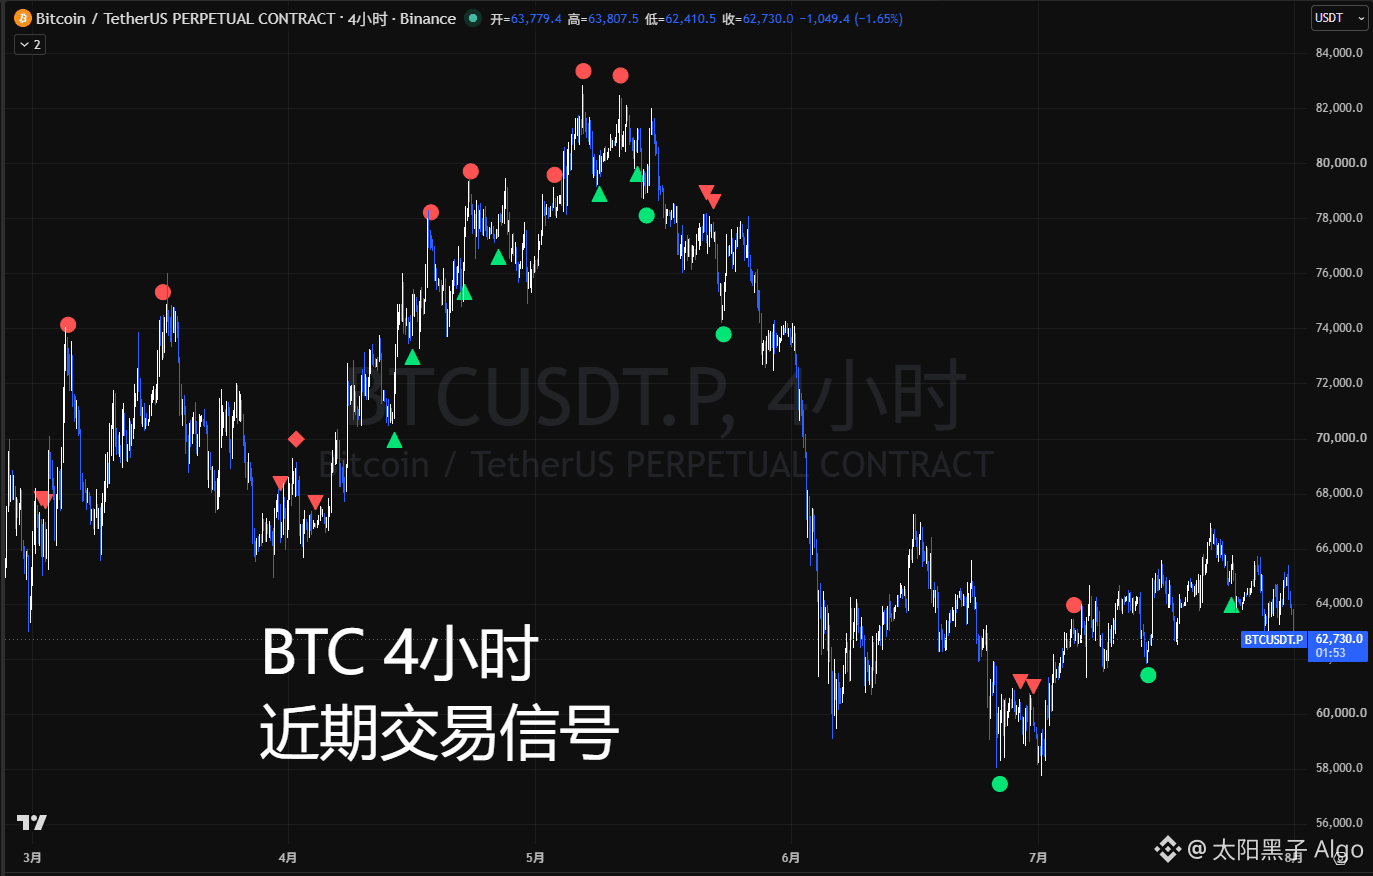
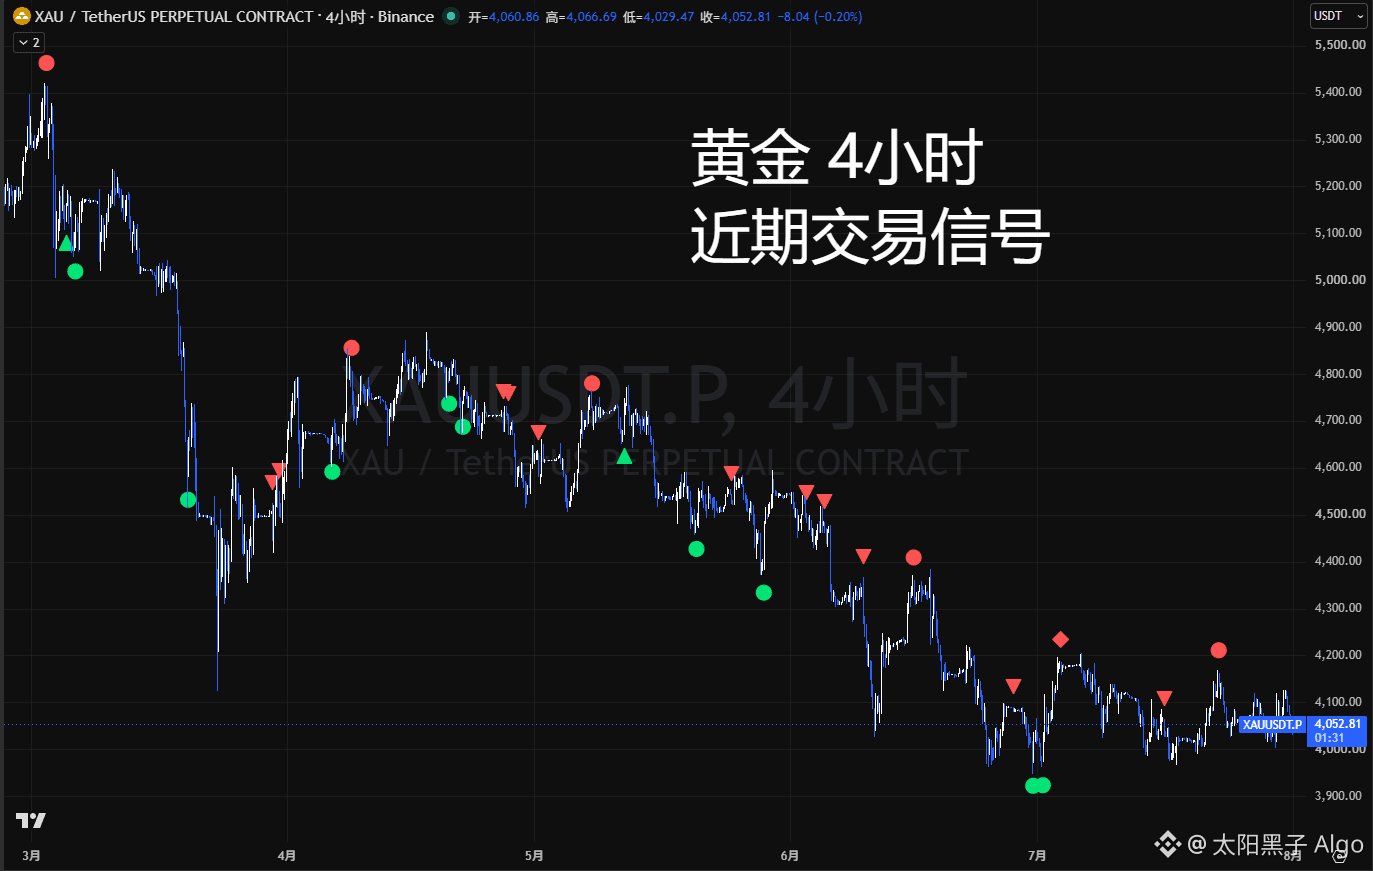
A pure technical analysis trader & indicator developer. The screenshots are of my self-developed TradingView indicator: the MIX indicator
💡
Key features
Truly non-repainting: no future functions. As soon as a signal is confirmed at the close, it gets permanently locked onto the chart—never repainting. You can review and verify the win rate and profit/loss ratio yourself through backtesting.
Universal for the whole market: no special optimization for any single asset or timeframe. It can provide trading references for any asset and timeframe.
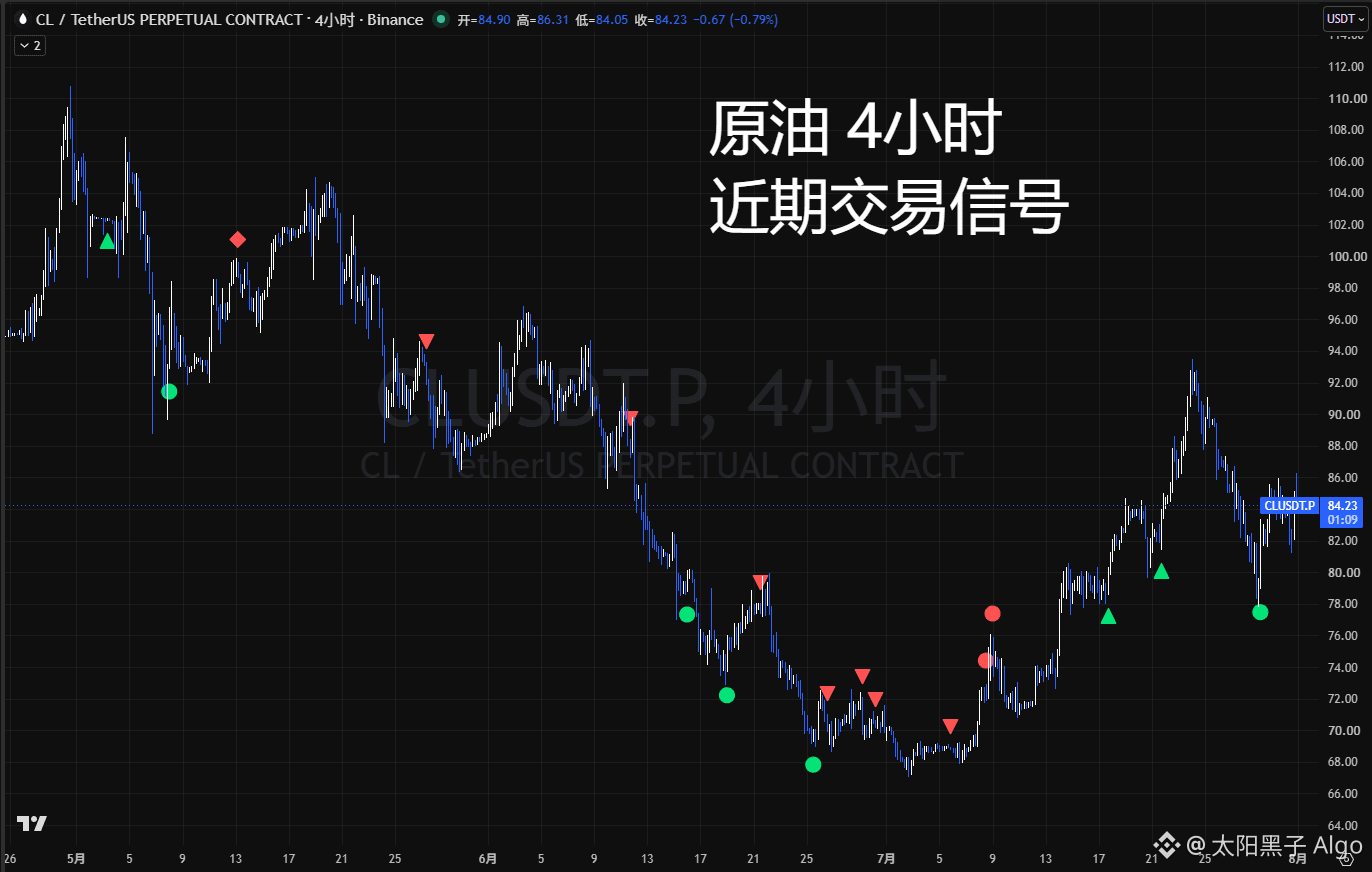
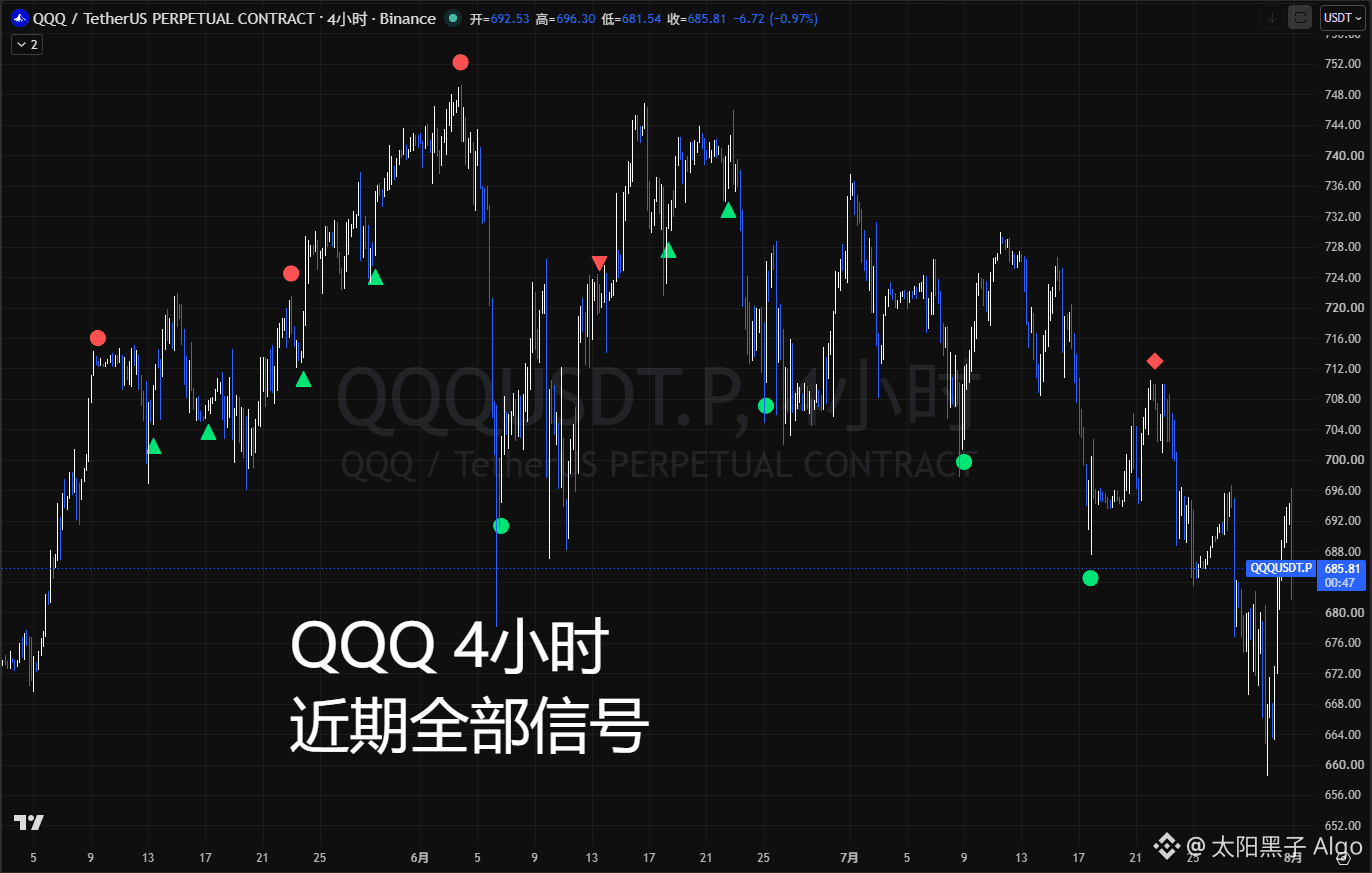
The chart includes the latest 4-hour signal screenshots for BTC, gold, crude oil, and QQQ. You can intuitively feel the signal quality. The MIX indicator’s signals come in three patterns:
1. Triangle = SWT trend signal, mainly for trend-following trades
2. Circle = VEX reversal signal, mainly for catching bottoms and topping off
3. Diamond = SWT+VEX convergence signal
In the pinned information of the public channel, there are many real-trade screenshot examples of different assets/timeframes. You can also verify validity by checking those pinned posts.
If you’d like to learn more, obtain authorization to use the indicator, or join my members-only group, please contact me via the following:
👋
Hello, I’m Sunspot
A pure technical analysis trader & indicator developer. The screenshots are of my self-developed TradingView indicator: the MIX indicator
💡
Key features
Truly non-repainting: no future functions. As soon as a signal is confirmed at the close, it gets permanently locked onto the chart—never repainting. You can review and verify the win rate and profit/loss ratio yourself through backtesting.
Universal for the whole market: no special optimization for any single asset or timeframe. It can provide trading references for any asset and timeframe.
The chart includes the latest 4-hour signal screenshots for BTC, gold, crude oil, and QQQ. You can intuitively feel the signal quality. The MIX indicator’s signals come in three patterns:
1. Triangle = SWT trend signal, mainly for trend-following trades
2. Circle = VEX reversal signal, mainly for catching bottoms and topping off
3. Diamond = SWT+VEX convergence signal
In the pinned information of the public channel, there are many real-trade screenshot examples of different assets/timeframes. You can also verify validity by checking those pinned posts.
If you’d like to learn more, obtain authorization to use the indicator, or join my members-only group, please contact me via the following:
Hello, I’m Sunspot
A pure technical analysis trader & indicator developer. The screenshots are of my self-developed TradingView indicator: the MIX indicator
💡
Key features
Truly non-repainting: no future functions. As soon as a signal is confirmed at the close, it gets permanently locked onto the chart—never repainting. You can review and verify the win rate and profit/loss ratio yourself through backtesting.
Universal for the whole market: no special optimization for any single asset or timeframe. It can provide trading references for any asset and timeframe.
The chart includes the latest 4-hour signal screenshots for BTC, gold, crude oil, and QQQ. You can intuitively feel the signal quality. The MIX indicator’s signals come in three patterns:
1. Triangle = SWT trend signal, mainly for trend-following trades
2. Circle = VEX reversal signal, mainly for catching bottoms and topping off
3. Diamond = SWT+VEX convergence signal
In the pinned information of the public channel, there are many real-trade screenshot examples of different assets/timeframes. You can also verify validity by checking those pinned posts.
If you’d like to learn more, obtain authorization to use the indicator, or join my members-only group, please contact me via the following:
267
·
--
🔴 SUI-4 hour — trend short
• Live price: 0.7161
• Signal type: Trend signal
• Data source: BINANCE
• Instrument info: SUI contract
🔴 SUI-4 hour — trend short
• Live price: 0.7161
• Signal type: Trend signal
• Data source: BINANCE
• Instrument info: SUI contract
• Live price: 0.7161
• Signal type: Trend signal
• Data source: BINANCE
• Instrument info: SUI contract
9
·
--
The most deadly thing in trading is never how the market moves—it’s you people always temporarily changing your explanation logic based on account profit and loss. In plain terms, it’s self-deception.
When you’re down a little, you say you need to “avoid risk,” and you stubbornly refuse to admit you’re wrong. But when the loss reaches a 50% cut, you start getting reckless and chase high leverage in the hope of turning it around. And you even mutter, “Since we’ve already lost so much, what’s there to be afraid of?” Does your fear have anything to do with the market? This kind of inverted risk awareness isn’t trading anymore at its core—it’s managing your ego. Closing positions and admitting you were wrong means admitting that the chain of decisions you made beforehand was all wrong. You can’t stand that. So to protect that pathetic little shred of self-respect, you’d rather gamble on a very low-probability surge than click the mouse to end the mistake.
There’s another, more covert one: packaging a speculation failure that left you deeply trapped as “long-termism.” When things go your way, you’re thinking about short-term high returns. When you’re against the tide and trapped, you immediately change your tune and call it “staying with it and growing together.” Real long-termism is different—it’s verifying the holding period, cash flow, and planning in advance under what conditions you add more and under what conditions you leave. It’s not buying and then getting stuck where you can’t sell, then finding a lofty excuse to cover it up. Is that long-termism? No, that’s helplessness.
To climb out of this vicious cycle, the only way is to throw away the part in your head that says, “I need to prove I’m right,” and replace it with probability thinking. Before placing an order, force yourself to write it out clearly: why you’re buying, the maximum how long you’ll hold, what conditions would prove that you’re wrong, and what you’ll do after you’re wrong. If you can’t write it, don’t open a trade. Once the direction is wrong, there are only two options: reduce size or exit. Absolutely no adding risk exposure in the wrong direction. That’s what gamblers do—not what traders do.
Time won’t automatically make faulty logic correct. Holding through it and getting back only earns you luck, not skill. Rip off that psychological “massage” routine, build your trading on entry rules and unconditional stop-losses, and then—only then—can you barely say you’ve pulled yourself out of that gambling pit.
The most deadly thing in trading is never how the market moves—it’s you people always temporarily changing your explanation logic based on account profit and loss. In plain terms, it’s self-deception.
When you’re down a little, you say you need to “avoid risk,” and you stubbornly refuse to admit you’re wrong. But when the loss reaches a 50% cut, you start getting reckless and chase high leverage in the hope of turning it around. And you even mutter, “Since we’ve already lost so much, what’s there to be afraid of?” Does your fear have anything to do with the market? This kind of inverted risk awareness isn’t trading anymore at its core—it’s managing your ego. Closing positions and admitting you were wrong means admitting that the chain of decisions you made beforehand was all wrong. You can’t stand that. So to protect that pathetic little shred of self-respect, you’d rather gamble on a very low-probability surge than click the mouse to end the mistake.
There’s another, more covert one: packaging a speculation failure that left you deeply trapped as “long-termism.” When things go your way, you’re thinking about short-term high returns. When you’re against the tide and trapped, you immediately change your tune and call it “staying with it and growing together.” Real long-termism is different—it’s verifying the holding period, cash flow, and planning in advance under what conditions you add more and under what conditions you leave. It’s not buying and then getting stuck where you can’t sell, then finding a lofty excuse to cover it up. Is that long-termism? No, that’s helplessness.
To climb out of this vicious cycle, the only way is to throw away the part in your head that says, “I need to prove I’m right,” and replace it with probability thinking. Before placing an order, force yourself to write it out clearly: why you’re buying, the maximum how long you’ll hold, what conditions would prove that you’re wrong, and what you’ll do after you’re wrong. If you can’t write it, don’t open a trade. Once the direction is wrong, there are only two options: reduce size or exit. Absolutely no adding risk exposure in the wrong direction. That’s what gamblers do—not what traders do.
Time won’t automatically make faulty logic correct. Holding through it and getting back only earns you luck, not skill. Rip off that psychological “massage” routine, build your trading on entry rules and unconditional stop-losses, and then—only then—can you barely say you’ve pulled yourself out of that gambling pit.
When you’re down a little, you say you need to “avoid risk,” and you stubbornly refuse to admit you’re wrong. But when the loss reaches a 50% cut, you start getting reckless and chase high leverage in the hope of turning it around. And you even mutter, “Since we’ve already lost so much, what’s there to be afraid of?” Does your fear have anything to do with the market? This kind of inverted risk awareness isn’t trading anymore at its core—it’s managing your ego. Closing positions and admitting you were wrong means admitting that the chain of decisions you made beforehand was all wrong. You can’t stand that. So to protect that pathetic little shred of self-respect, you’d rather gamble on a very low-probability surge than click the mouse to end the mistake.
There’s another, more covert one: packaging a speculation failure that left you deeply trapped as “long-termism.” When things go your way, you’re thinking about short-term high returns. When you’re against the tide and trapped, you immediately change your tune and call it “staying with it and growing together.” Real long-termism is different—it’s verifying the holding period, cash flow, and planning in advance under what conditions you add more and under what conditions you leave. It’s not buying and then getting stuck where you can’t sell, then finding a lofty excuse to cover it up. Is that long-termism? No, that’s helplessness.
To climb out of this vicious cycle, the only way is to throw away the part in your head that says, “I need to prove I’m right,” and replace it with probability thinking. Before placing an order, force yourself to write it out clearly: why you’re buying, the maximum how long you’ll hold, what conditions would prove that you’re wrong, and what you’ll do after you’re wrong. If you can’t write it, don’t open a trade. Once the direction is wrong, there are only two options: reduce size or exit. Absolutely no adding risk exposure in the wrong direction. That’s what gamblers do—not what traders do.
Time won’t automatically make faulty logic correct. Holding through it and getting back only earns you luck, not skill. Rip off that psychological “massage” routine, build your trading on entry rules and unconditional stop-losses, and then—only then—can you barely say you’ve pulled yourself out of that gambling pit.
41
·
--
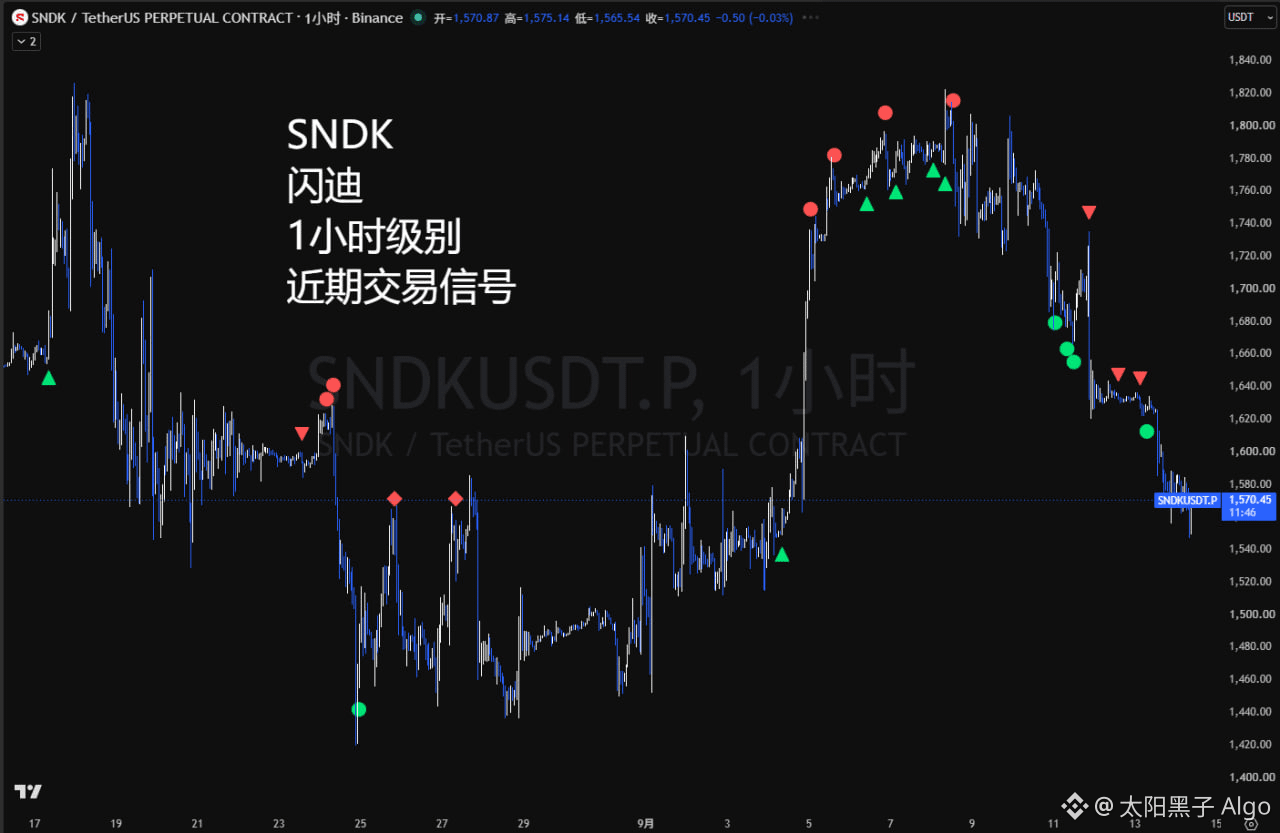
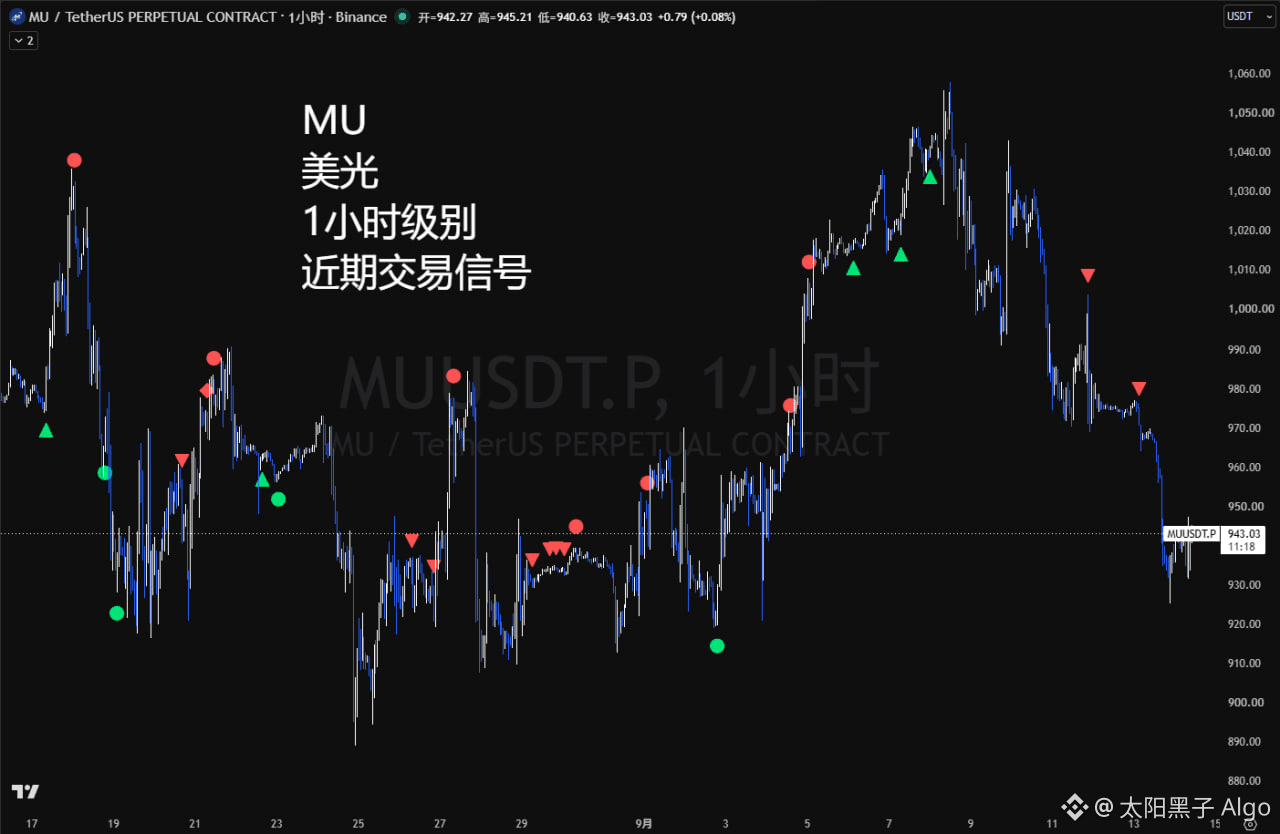
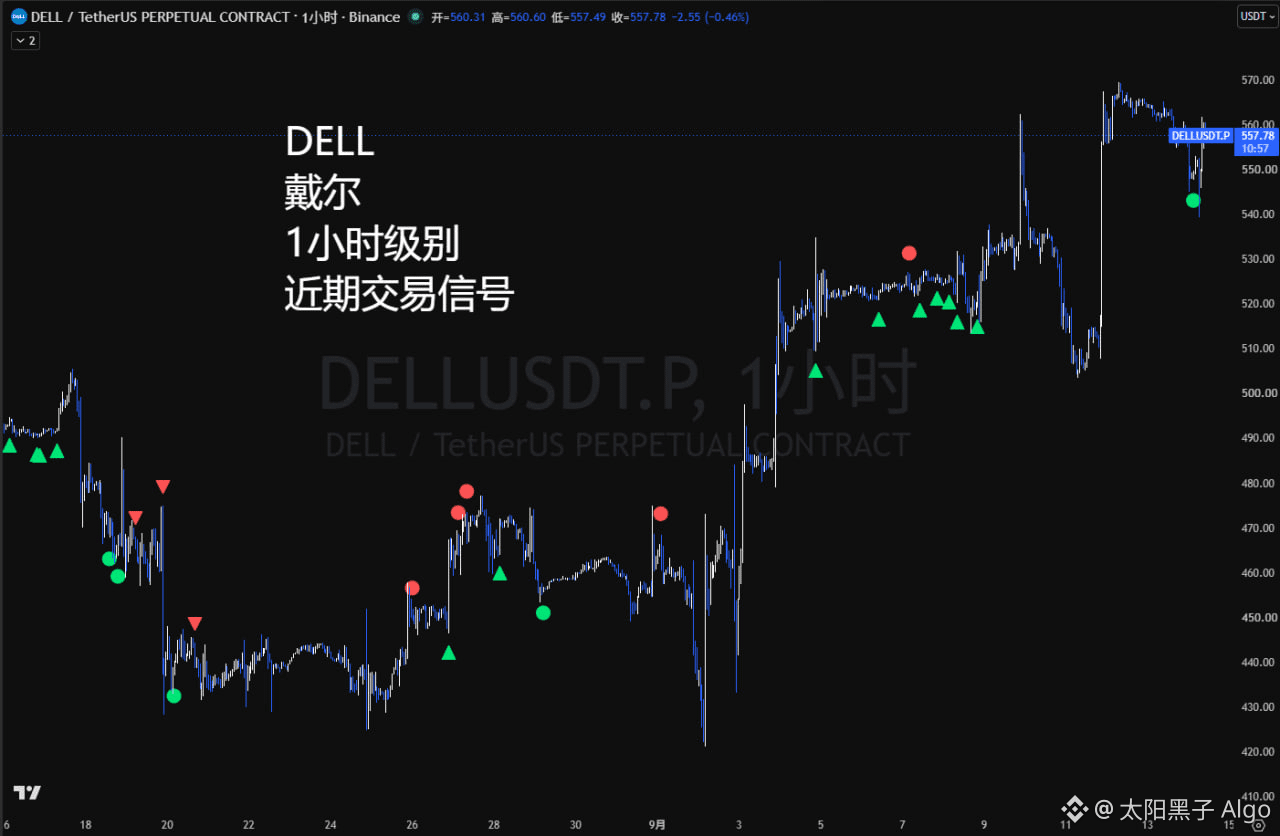
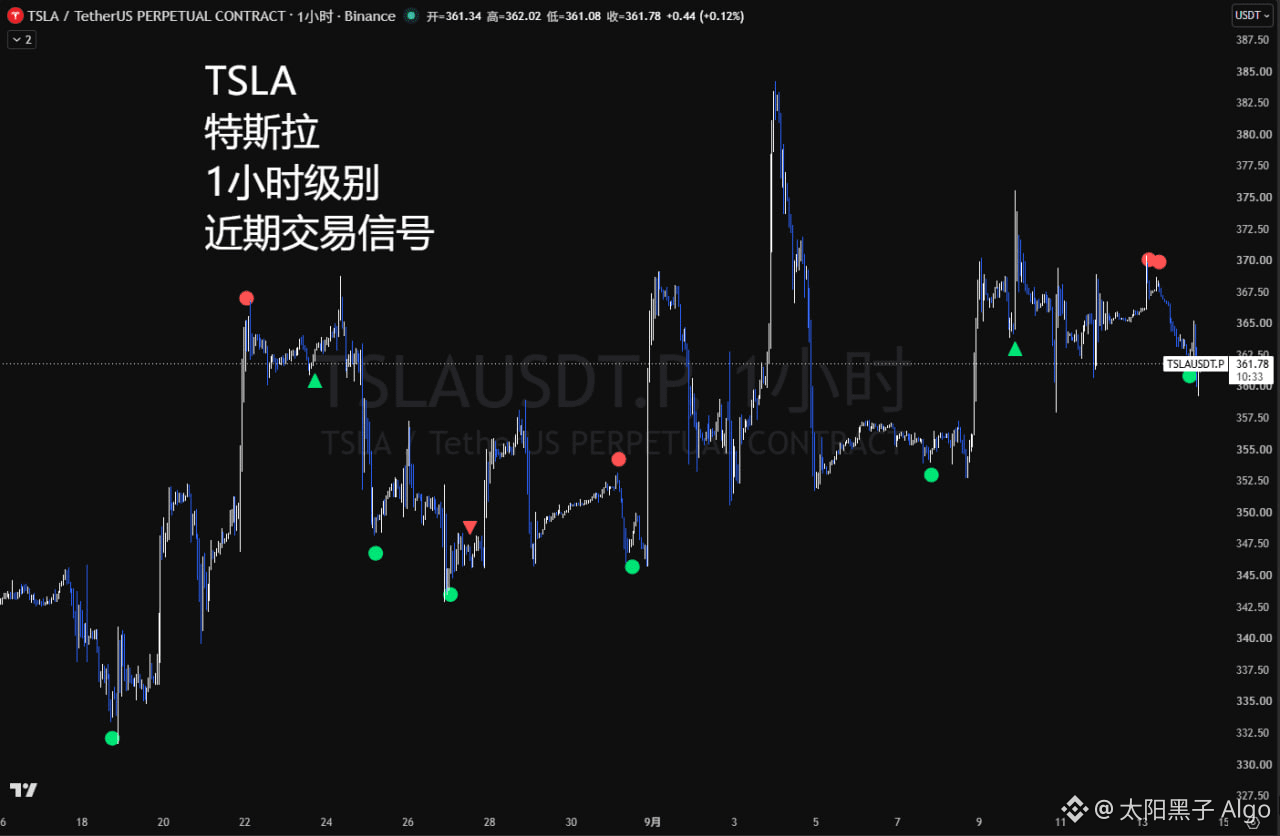
As shown in the figure are the recent 1-hour trading signals for U.S. stock individual contracts. These include signals for SanDisk/Micron/Dell and Tesla.
Whether you are a trader who uses price action analysis or you prefer a multi-indicator convergence strategy, the MIX indicator can be seamlessly integrated into your trading system.
If you are interested in U.S. stocks, you can manually review these signals shown in the screenshot and independently calculate the win rate and risk-reward ratio.
As shown in the figure are the recent 1-hour trading signals for U.S. stock individual contracts. These include signals for SanDisk/Micron/Dell and Tesla.
Whether you are a trader who uses price action analysis or you prefer a multi-indicator convergence strategy, the MIX indicator can be seamlessly integrated into your trading system.
If you are interested in U.S. stocks, you can manually review these signals shown in the screenshot and independently calculate the win rate and risk-reward ratio.
Whether you are a trader who uses price action analysis or you prefer a multi-indicator convergence strategy, the MIX indicator can be seamlessly integrated into your trading system.
If you are interested in U.S. stocks, you can manually review these signals shown in the screenshot and independently calculate the win rate and risk-reward ratio.
142
·
--
See translation
🟢 NVDA-4小时-逆势做多
• 实时价格:212.28
• 信号类型:反转信号
• 数据来源:BINANCE
• 品种信息:英伟达股票
🟢 NVDA-4小时-逆势做多
• 实时价格:212.28
• 信号类型:反转信号
• 数据来源:BINANCE
• 品种信息:英伟达股票
• 实时价格:212.28
• 信号类型:反转信号
• 数据来源:BINANCE
• 品种信息:英伟达股票
·
--
🟢 SOXL-4小时-逆势做多
• Live price: 102.95
• Signal type: Reversal signal
• Data source: BINANCE
• Instrument info: 3x Long Semiconductor ETF
🟢 SOXL-4小时-逆势做多
• Live price: 102.95
• Signal type: Reversal signal
• Data source: BINANCE
• Instrument info: 3x Long Semiconductor ETF
• Live price: 102.95
• Signal type: Reversal signal
• Data source: BINANCE
• Instrument info: 3x Long Semiconductor ETF
109
·
--
🟢 QQQ-4 hour-逆勢做多
• Real-time price: 710.22
• Signal type: Reversal signal
• Data source: BINANCE
• Instrument information: NASDAQ 100 ETF
🟢 QQQ-4 hour-逆勢做多
• Real-time price: 710.22
• Signal type: Reversal signal
• Data source: BINANCE
• Instrument information: NASDAQ 100 ETF
• Real-time price: 710.22
• Signal type: Reversal signal
• Data source: BINANCE
• Instrument information: NASDAQ 100 ETF
106
·
--
🟢 AAPL-4小时-做多顺势
• Live price: 333.49
• Signal type: Trend signal
• Data source: BINANCE
• Instrument info: Apple stock
🟢 AAPL-4小时-做多顺势
• Live price: 333.49
• Signal type: Trend signal
• Data source: BINANCE
• Instrument info: Apple stock
• Live price: 333.49
• Signal type: Trend signal
• Data source: BINANCE
• Instrument info: Apple stock
36
·
--
🟢 ETH-4 hour trend-following long
• Live price: 2521.97
• Signal type: Trend signal
• Data source: BINANCE
• Instrument info: Ethereum contract
🟢 ETH-4 hour trend-following long
• Live price: 2521.97
• Signal type: Trend signal
• Data source: BINANCE
• Instrument info: Ethereum contract
• Live price: 2521.97
• Signal type: Trend signal
• Data source: BINANCE
• Instrument info: Ethereum contract
39
·
--
🟢 HYPE-4 hours - trend-following long
• Real-time price: 79.881
• Signal type: reversal signal
• Data source: BINANCE
• Instrument info: HYPE contract
🟢 HYPE-4 hours - trend-following long
• Real-time price: 79.881
• Signal type: reversal signal
• Data source: BINANCE
• Instrument info: HYPE contract
• Real-time price: 79.881
• Signal type: reversal signal
• Data source: BINANCE
• Instrument info: HYPE contract
3
·
--
🟢 NBIS-4 hour - go long with the trend
• Live price: 216.85
• Signal type: reversal signal
• Data source: BINANCE
• Instrument information: Nebius stock
🟢 NBIS-4 hour - go long with the trend
• Live price: 216.85
• Signal type: reversal signal
• Data source: BINANCE
• Instrument information: Nebius stock
• Live price: 216.85
• Signal type: reversal signal
• Data source: BINANCE
• Instrument information: Nebius stock
103
·
--
🔴 XAG-4 hour-Short in line with the trend
• Live price: 64.51
• Signal type: Trend signal
• Data source: BINANCE
• Instrument info: Silver contract
🔴 XAG-4 hour-Short in line with the trend
• Live price: 64.51
• Signal type: Trend signal
• Data source: BINANCE
• Instrument info: Silver contract
• Live price: 64.51
• Signal type: Trend signal
• Data source: BINANCE
• Instrument info: Silver contract
·
--
🟢 CL-4小时-顺势做多
• Real-time price: 96.27
• Signal type: Trend signal
• Data source: BINANCE
• Product information: Crude oil contract
🟢 CL-4小时-顺势做多
• Real-time price: 96.27
• Signal type: Trend signal
• Data source: BINANCE
• Product information: Crude oil contract
• Real-time price: 96.27
• Signal type: Trend signal
• Data source: BINANCE
• Product information: Crude oil contract
85
·
--
🟢 SKHY-4小时-顺势做多
• Real-time price: 191.29
• Signal type: trend signal
• Data source: BINANCE
• Instrument information: SK Hynix stock
🟢 SKHY-4小时-顺势做多
• Real-time price: 191.29
• Signal type: trend signal
• Data source: BINANCE
• Instrument information: SK Hynix stock
• Real-time price: 191.29
• Signal type: trend signal
• Data source: BINANCE
• Instrument information: SK Hynix stock
·
--
🟢 BTC-4小时-顺势做多
• Live price: 77188.1
• Signal type: Reversal signal
• Data source: BINANCE
• Instrument info: Bitcoin futures
🟢 BTC-4小时-顺势做多
• Live price: 77188.1
• Signal type: Reversal signal
• Data source: BINANCE
• Instrument info: Bitcoin futures
• Live price: 77188.1
• Signal type: Reversal signal
• Data source: BINANCE
• Instrument info: Bitcoin futures
31
·
--
🟢 SNDK-4 Hour - Trade in the Trend (Go Long)
• Live price: 1698.35
• Signal type: MIX resonance signal
• Data source: BINANCE
• Instrument information: Sandisk stock
🟢 SNDK-4 Hour - Trade in the Trend (Go Long)
• Live price: 1698.35
• Signal type: MIX resonance signal
• Data source: BINANCE
• Instrument information: Sandisk stock
• Live price: 1698.35
• Signal type: MIX resonance signal
• Data source: BINANCE
• Instrument information: Sandisk stock
170
·
--
🟢 QQQ-4 Hour - Follow the Trend to Go Long
• Live Price: 711.94
• Signal Type: Reversal Signal
• Data Source: BINANCE
• Instrument Info: Nasdaq 100 ETF
🟢 QQQ-4 Hour - Follow the Trend to Go Long
• Live Price: 711.94
• Signal Type: Reversal Signal
• Data Source: BINANCE
• Instrument Info: Nasdaq 100 ETF
• Live Price: 711.94
• Signal Type: Reversal Signal
• Data Source: BINANCE
• Instrument Info: Nasdaq 100 ETF
62
·
--
🟢 HYPE-4 hour momentum long
• Live price: 79.841
• Signal type: reversal signal
• Data source: BINANCE
• Instrument info: HYPE contract
🟢 HYPE-4 hour momentum long
• Live price: 79.841
• Signal type: reversal signal
• Data source: BINANCE
• Instrument info: HYPE contract
• Live price: 79.841
• Signal type: reversal signal
• Data source: BINANCE
• Instrument info: HYPE contract
41
·
--
🟢 GOOGL-4小时-逆势做多
• Current price: 332.96
• Signal type: Reversal signal
• Data source: BINANCE
• Instrument information: Google stock
🟢 GOOGL-4小时-逆势做多
• Current price: 332.96
• Signal type: Reversal signal
• Data source: BINANCE
• Instrument information: Google stock
• Current price: 332.96
• Signal type: Reversal signal
• Data source: BINANCE
• Instrument information: Google stock
3
Log in to explore more content
Join global crypto users on Binance Square
⚡️ Get latest and useful information about crypto.
💬 Trusted by the world’s largest crypto exchange.
👍 Discover real insights from verified creators.
Email / Phone number
Trending Topics
BitcoinReboundsTo$79K
12,952 views
126 Discussing
🚨 $BTC is pushing higher.
Bitcoin is trading around $78,804, up roughly 1.9%, after reclaiming the $78K area. The next level to watch is the intraday high near $78,905.
A clean break above that level could open the way toward $79K–$80K. If BTC gets rejected, support sits around $78,300, then $77,975.
Bulls have momentum, but BTC needs to hold above $78K.
#Bitcoin #BTC #CryptoTrading #CryptoMarket #CryptoAnalysis
PulseON
·13 Likes
·12.8k views
SouthKoreaCryptoTaxDelayPetitionTops50000
0 views
3 Discussing
SolanaTransactionV1GoesLiveOnMainnet
0 views
2 Discussing