
方隅望远
307 Posts

方隅望远
Report
Block User
上班族,休息时间做单,偶尔摸鱼看盘,挣点零花钱,主搞山寨小短线,舔一口就跑。
25 Following
61 Followers
9 Liked
Posts
·
--
We spent a long time discussing the following with friends in the group: BlockBeats’ key things to watch on 11/20.
Intraday volatility may increase, so using less leverage may be safer.
I still feel pretty calm after reading this—probably because I’ve been through too many similar situations.
$BTC latest: 61423.17.
We spent a long time discussing the following with friends in the group: BlockBeats’ key things to watch on 11/20.
Intraday volatility may increase, so using less leverage may be safer.
I still feel pretty calm after reading this—probably because I’ve been through too many similar situations.
$BTC latest: 61423.17.
Intraday volatility may increase, so using less leverage may be safer.
I still feel pretty calm after reading this—probably because I’ve been through too many similar situations.
$BTC latest: 61423.17.
367
·
--
Anyone watching the market?
Everyone in the plaza is spamming #Injective代币化房地产抵押贷款超15亿美元 ! It’s already had 22,000 views!
What do you guys think about $INJ ? Let’s hear it in the comments.
Trending topics can bring traffic, but traffic doesn’t necessarily mean sales.
Anyone watching the market?
Everyone in the plaza is spamming #Injective代币化房地产抵押贷款超15亿美元 ! It’s already had 22,000 views!
What do you guys think about $INJ ? Let’s hear it in the comments.
Trending topics can bring traffic, but traffic doesn’t necessarily mean sales.
Everyone in the plaza is spamming #Injective代币化房地产抵押贷款超15亿美元 ! It’s already had 22,000 views!
What do you guys think about $INJ ? Let’s hear it in the comments.
Trending topics can bring traffic, but traffic doesn’t necessarily mean sales.
80
·
--
21:13 News flash: Trump Media plans not to sell Bitcoin or issue additional shares, and to repay approximately $884 million in debt
Things appear steady on the surface; what’s worth noting is the direction this points to.
$BTC , down 0.54% on the day. There’s been quite a bit of news today, and this is one item that’s relatively worth keeping an eye on.
#BTC
21:13 News flash: Trump Media plans not to sell Bitcoin or issue additional shares, and to repay approximately $884 million in debt
Things appear steady on the surface; what’s worth noting is the direction this points to.
$BTC , down 0.54% on the day. There’s been quite a bit of news today, and this is one item that’s relatively worth keeping an eye on.
#BTC
Things appear steady on the surface; what’s worth noting is the direction this points to.
$BTC , down 0.54% on the day. There’s been quite a bit of news today, and this is one item that’s relatively worth keeping an eye on.
#BTC
30
·
--
Trading Notes | Circulating Market Cap and FDV
① Circulating market cap divided by FDV is approximately the current circulating percentage. The lower the ratio, the more tokens are yet to be unlocked in the future.
② Circulating market cap equals the current price × the number of tokens in circulation.
③ For tokens with a very low circulating percentage, check the unlock schedule for the coming year before deciding how much to invest.
$BTC 63567.41(-1.85%)
Trading Notes | Circulating Market Cap and FDV
① Circulating market cap divided by FDV is approximately the current circulating percentage. The lower the ratio, the more tokens are yet to be unlocked in the future.
② Circulating market cap equals the current price × the number of tokens in circulation.
③ For tokens with a very low circulating percentage, check the unlock schedule for the coming year before deciding how much to invest.
$BTC 63567.41(-1.85%)
① Circulating market cap divided by FDV is approximately the current circulating percentage. The lower the ratio, the more tokens are yet to be unlocked in the future.
② Circulating market cap equals the current price × the number of tokens in circulation.
③ For tokens with a very low circulating percentage, check the unlock schedule for the coming year before deciding how much to invest.
$BTC 63567.41(-1.85%)
45
·
--
The chain reaction triggered by a trending topic: trending topic → association → stock chart → hesitation → exit the app—all in under five minutes.
This time it was “Why are so many AI big shots physics majors?” It brought up $WLD in the AI concept sector.
It’s fine to join the buzz, but keep leverage low—and be quick to get out.
The chain reaction triggered by a trending topic: trending topic → association → stock chart → hesitation → exit the app—all in under five minutes.
This time it was “Why are so many AI big shots physics majors?” It brought up $WLD in the AI concept sector.
It’s fine to join the buzz, but keep leverage low—and be quick to get out.
This time it was “Why are so many AI big shots physics majors?” It brought up $WLD in the AI concept sector.
It’s fine to join the buzz, but keep leverage low—and be quick to get out.
126
·
--
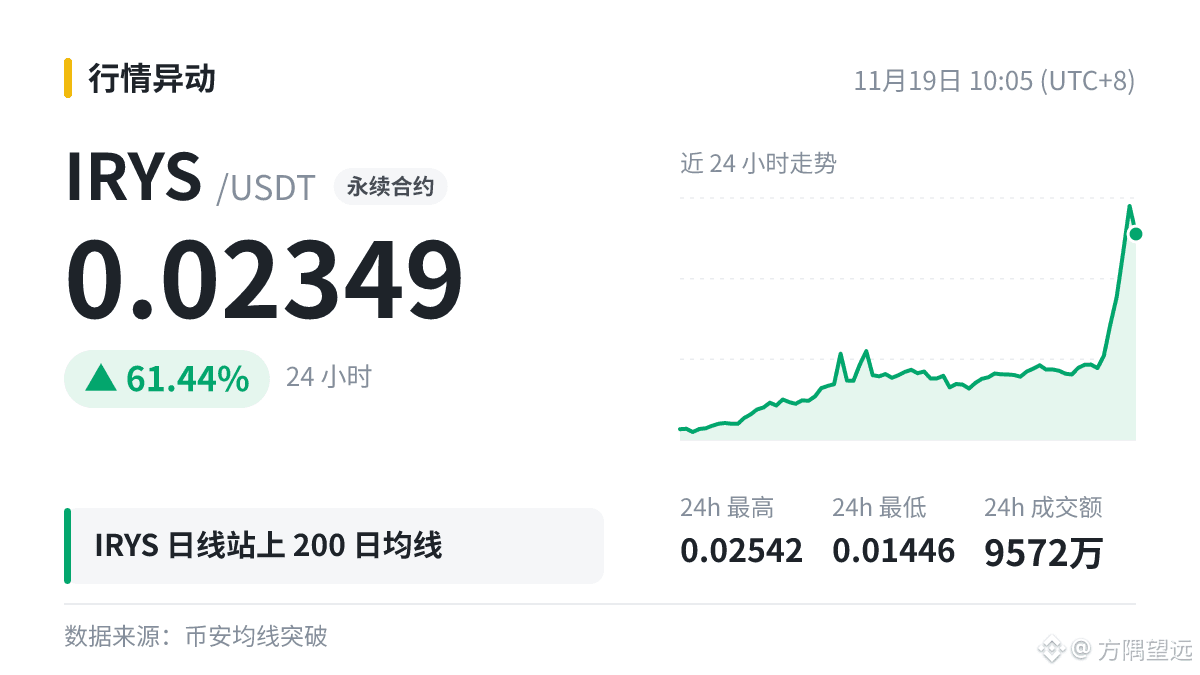
Trend signal | $IRYS
Daily MA200: 0.01935 | above | 24h +61.44%
The few candlesticks after the signal appears are more convincing than the signal itself.
Trend signal | $IRYS
Daily MA200: 0.01935 | above | 24h +61.44%
The few candlesticks after the signal appears are more convincing than the signal itself.
Daily MA200: 0.01935 | above | 24h +61.44%
The few candlesticks after the signal appears are more convincing than the signal itself.
176
·
--
Trending topic on Square (63k views): #俄罗斯央行将AlfaBank纳入加密交易登记册
$BTC 62859.88, 24h -3.16%
Hot topics rise and fade quickly. Treat them as leads, not reasons to trade.
Trending topic on Square (63k views): #俄罗斯央行将AlfaBank纳入加密交易登记册
$BTC 62859.88, 24h -3.16%
Hot topics rise and fade quickly. Treat them as leads, not reasons to trade.
$BTC 62859.88, 24h -3.16%
Hot topics rise and fade quickly. Treat them as leads, not reasons to trade.
72
·
--
As soon as the news broke, the candlestick chart moved faster than the reporters—I’d only just read the first line.
It was this: CoinShares sold all of its ETH holdings and halved its SOL position to raise funds for a share buyback.
$ETH 1794.67. The key thing to watch next is whether more details emerge from the parties involved.
As soon as the news broke, the candlestick chart moved faster than the reporters—I’d only just read the first line.
It was this: CoinShares sold all of its ETH holdings and halved its SOL position to raise funds for a share buyback.
$ETH 1794.67. The key thing to watch next is whether more details emerge from the parties involved.
It was this: CoinShares sold all of its ETH holdings and halved its SOL position to raise funds for a share buyback.
$ETH 1794.67. The key thing to watch next is whether more details emerge from the parties involved.
177
·
--
24-hour contract decliners at a glance | Biggest drop: $Lobster -15.52%
$Lobster -15.52%; $EVAA -14.98%; $STABLE -10.35%; MAGMA -8.76%; JCT -8.37%
Leading decliners are down 15%–30%, with selling pressure concentrated.
24-hour contract decliners at a glance | Biggest drop: $Lobster -15.52%
$Lobster -15.52%; $EVAA -14.98%; $STABLE -10.35%; MAGMA -8.76%; JCT -8.37%
Leading decliners are down 15%–30%, with selling pressure concentrated.
$Lobster -15.52%; $EVAA -14.98%; $STABLE -10.35%; MAGMA -8.76%; JCT -8.37%
Leading decliners are down 15%–30%, with selling pressure concentrated.
544
·
--
“A-share rebound hits resistance time and again—who will break the deadlock?” has climbed the trending charts.
$BTC , which is tied to stock market movements, may see a lag before buzz from outside the crypto sphere affects its price—and the buzz may not carry over at all.
Keep an eye on whether the discussion changes tone. If public opinion turns, the linked coin may fall back too.
“A-share rebound hits resistance time and again—who will break the deadlock?” has climbed the trending charts.
$BTC , which is tied to stock market movements, may see a lag before buzz from outside the crypto sphere affects its price—and the buzz may not carry over at all.
Keep an eye on whether the discussion changes tone. If public opinion turns, the linked coin may fall back too.
$BTC , which is tied to stock market movements, may see a lag before buzz from outside the crypto sphere affects its price—and the buzz may not carry over at all.
Keep an eye on whether the discussion changes tone. If public opinion turns, the linked coin may fall back too.
86
·
--
Deep Tide TechFlow News: Hong Kong Monetary Authority explores developing agentic AI to monitor digital asset trading
The impact is limited. If you plan to trade, use price movements as your guide.
$BTC , 24h -0.62%. For now, focus on this; more details are still being updated.
Deep Tide TechFlow News: Hong Kong Monetary Authority explores developing agentic AI to monitor digital asset trading
The impact is limited. If you plan to trade, use price movements as your guide.
$BTC , 24h -0.62%. For now, focus on this; more details are still being updated.
The impact is limited. If you plan to trade, use price movements as your guide.
$BTC , 24h -0.62%. For now, focus on this; more details are still being updated.
101
·
--
Data at a glance: $8.42 million in Binance futures liquidations over the past hour | Longs accounted for 9.7% | $ETH ranked first
Explanation: Binance’s publicly available liquidation data is a sampled snapshot: only the latest update for each contract is sent every second, so the actual liquidation amount may be higher.
How to read it: Liquidation data can indicate which side of the market has more crowded leveraged positions, but it is a retrospective statistic and should not be used on its own to predict market movements.
All indicators only summarize past trends; the market can turn in the opposite direction at any time.
Data at a glance: $8.42 million in Binance futures liquidations over the past hour | Longs accounted for 9.7% | $ETH ranked first
Explanation: Binance’s publicly available liquidation data is a sampled snapshot: only the latest update for each contract is sent every second, so the actual liquidation amount may be higher.
How to read it: Liquidation data can indicate which side of the market has more crowded leveraged positions, but it is a retrospective statistic and should not be used on its own to predict market movements.
All indicators only summarize past trends; the market can turn in the opposite direction at any time.
Explanation: Binance’s publicly available liquidation data is a sampled snapshot: only the latest update for each contract is sent every second, so the actual liquidation amount may be higher.
How to read it: Liquidation data can indicate which side of the market has more crowded leveraged positions, but it is a retrospective statistic and should not be used on its own to predict market movements.
All indicators only summarize past trends; the market can turn in the opposite direction at any time.
79
·
--
$BTC broke through the 65,000 level.
After moving above this level, the next resistance to watch is the next round number or the previous high.
After a sharp move, there is usually a period of consolidation; the way the market consolidates determines which direction it moves next.
$BTC broke through the 65,000 level.
After moving above this level, the next resistance to watch is the next round number or the previous high.
After a sharp move, there is usually a period of consolidation; the way the market consolidates determines which direction it moves next.
After moving above this level, the next resistance to watch is the next round number or the previous high.
After a sharp move, there is usually a period of consolidation; the way the market consolidates determines which direction it moves next.
31
·
--
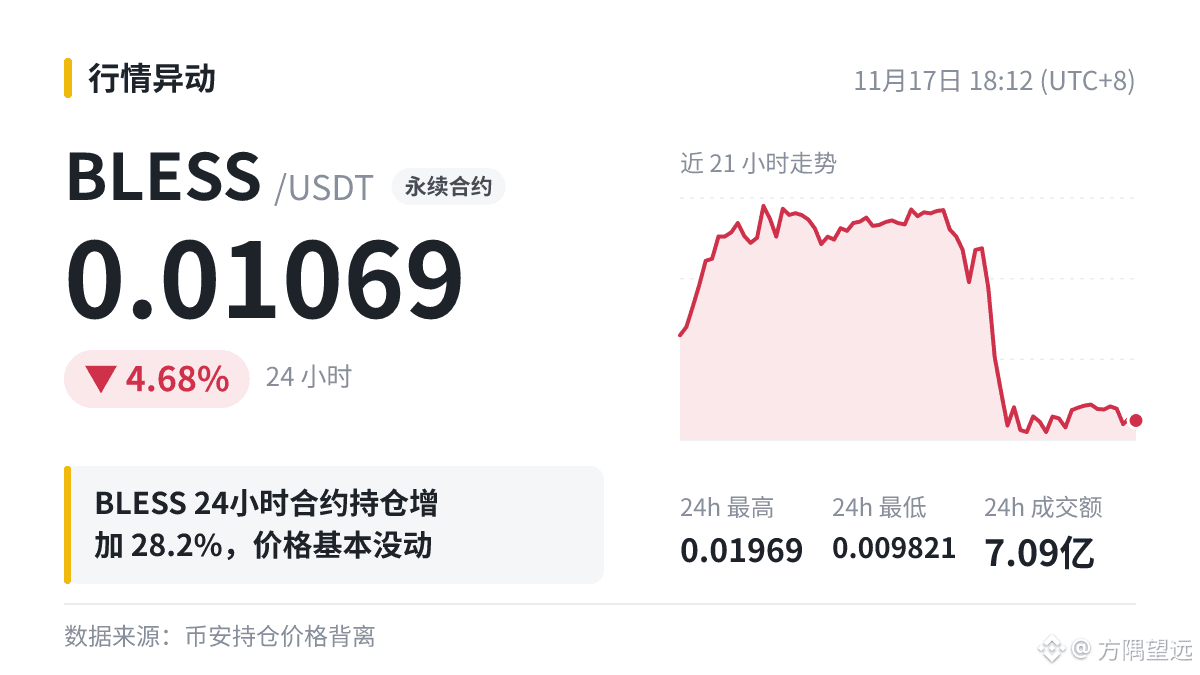
What does $BLESS 's position reveal? 24-hour open interest is up 28.17%, price is down 0.23%, and open interest is around $11.83 million.
My take: positions are building on both sides, waiting for a direction. Picking a side too soon here could get you whipsawed.
Do you usually use leverage?
#BLESS
What does $BLESS 's position reveal? 24-hour open interest is up 28.17%, price is down 0.23%, and open interest is around $11.83 million.
My take: positions are building on both sides, waiting for a direction. Picking a side too soon here could get you whipsawed.
Do you usually use leverage?
#BLESS
My take: positions are building on both sides, waiting for a direction. Picking a side too soon here could get you whipsawed.
Do you usually use leverage?
#BLESS
192
·
--
Don't place an order the moment the news breaks; wait for the candlestick to close before making a decision.
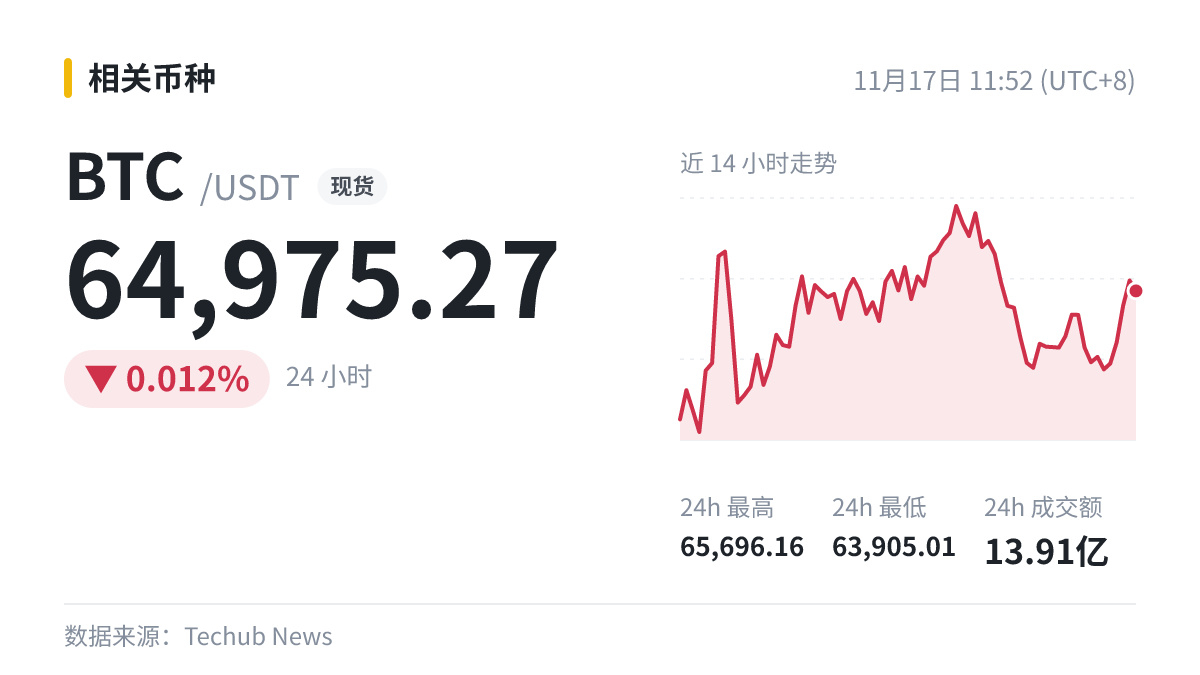
Take this news item, for example: Morgan Stanley disclosed that it increased its holdings of the BlackRock IBIT Bitcoin ETF by 18% last quarter.
The direction of the change in holdings can show how leveraged funds see things.
$BTC is currently at 64975.27, down 0.012% intraday.
Don't place an order the moment the news breaks; wait for the candlestick to close before making a decision.
Take this news item, for example: Morgan Stanley disclosed that it increased its holdings of the BlackRock IBIT Bitcoin ETF by 18% last quarter.
The direction of the change in holdings can show how leveraged funds see things.
$BTC is currently at 64975.27, down 0.012% intraday.
Take this news item, for example: Morgan Stanley disclosed that it increased its holdings of the BlackRock IBIT Bitcoin ETF by 18% last quarter.
The direction of the change in holdings can show how leveraged funds see things.
$BTC is currently at 64975.27, down 0.012% intraday.
110
·
--
Trending update: Top search: U.S. bank stocks and packaged food stocks are performing well
Related asset: $BTC (U.S. stocks) | 24h +0.14%
Had you noticed this before?
Trending update: Top search: U.S. bank stocks and packaged food stocks are performing well
Related asset: $BTC (U.S. stocks) | 24h +0.14%
Had you noticed this before?
Related asset: $BTC (U.S. stocks) | 24h +0.14%
Had you noticed this before?
42
·
--
I did the math on my fingers: $EVAA has a current funding rate of 0.0604%, which works out to an annualized rate of about 132.2%.
In other words, longs are sending red envelopes to shorts at every settlement. Even I’m not this punctual when sending red envelopes to friends.
The side with more liquidations may also take a hit to sentiment in the short term.
I did the math on my fingers: $EVAA has a current funding rate of 0.0604%, which works out to an annualized rate of about 132.2%.
In other words, longs are sending red envelopes to shorts at every settlement. Even I’m not this punctual when sending red envelopes to friends.
The side with more liquidations may also take a hit to sentiment in the short term.
In other words, longs are sending red envelopes to shorts at every settlement. Even I’m not this punctual when sending red envelopes to friends.
The side with more liquidations may also take a hit to sentiment in the short term.
1
406
·
--
Honestly, I just took a look at the 24-hour gainers chart for contracts:
1) $BLESS +88.61%
2) $SPACE +32.73%
3) $CROSS +23.13%
4) TAC +20.89%
5) EVAA +16.94%
$BLESS +88.61%—honestly, when I see gains like that, I usually just watch and don't chase. Rather than chasing the top-ranked coins, I'd rather check whether there are any further down the list that haven't risen much yet.
How do you use the gainers chart?
#BLESS
Honestly, I just took a look at the 24-hour gainers chart for contracts:
1) $BLESS +88.61%
2) $SPACE +32.73%
3) $CROSS +23.13%
4) TAC +20.89%
5) EVAA +16.94%
$BLESS +88.61%—honestly, when I see gains like that, I usually just watch and don't chase. Rather than chasing the top-ranked coins, I'd rather check whether there are any further down the list that haven't risen much yet.
How do you use the gainers chart?
#BLESS
1) $BLESS +88.61%
2) $SPACE +32.73%
3) $CROSS +23.13%
4) TAC +20.89%
5) EVAA +16.94%
$BLESS +88.61%—honestly, when I see gains like that, I usually just watch and don't chase. Rather than chasing the top-ranked coins, I'd rather check whether there are any further down the list that haven't risen much yet.
How do you use the gainers chart?
#BLESS
10
·
--
$BLESS A one-wave strategy, and it cycles insanely fast
$BLESS A one-wave strategy, and it cycles insanely fast
1
160
·
--
$BLESS how did this thing come back from the dead
$BLESS how did this thing come back from the dead
174
Log in to explore more content
Join global crypto users on Binance Square
⚡️ Get latest and useful information about crypto.
💬 Trusted by the world’s largest crypto exchange.
👍 Discover real insights from verified creators.
Email / Phone number
Trending Topics
IsAnthropic’s$1.5TMarketCapJustified?
27,869 views
154 Discussing
Anthropic Set to Open at $105 in Record Nasdaq Debut
Binance News
·13 Likes
·17.3k views
BTCBelow$62KAmidHikeFearsAndShiftToAnthropic
236 views
6 Discussing
NvidiaBoardReportedlySplitOverHuang’sReturn
152,675 views
1,289 Discussing